. 2024 Jan 12;81(1):24.
doi: 10.1007/s00018-023-05094-y.

Lactic acid promotes nucleus pulposus cell senescence and corresponding intervertebral disc degeneration via interacting with Akt

Affiliations

Lactic acid promotes nucleus pulposus cell senescence and corresponding intervertebral disc degeneration via interacting with Akt

Yuyao Zhang et al. Cell Mol Life Sci. .

Abstract

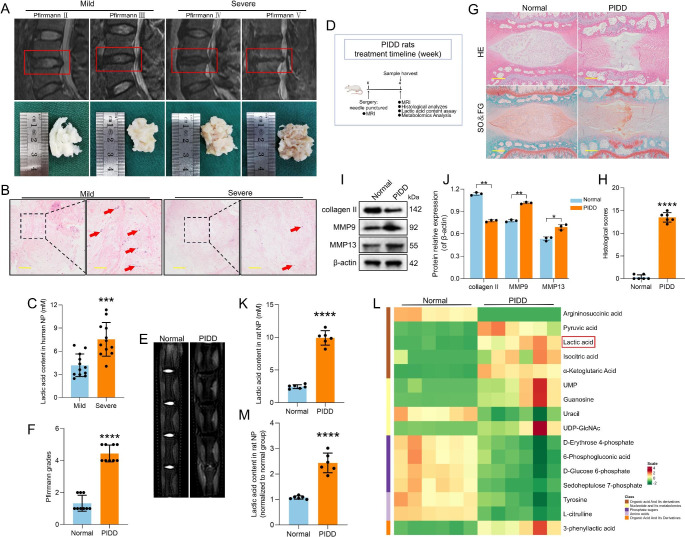
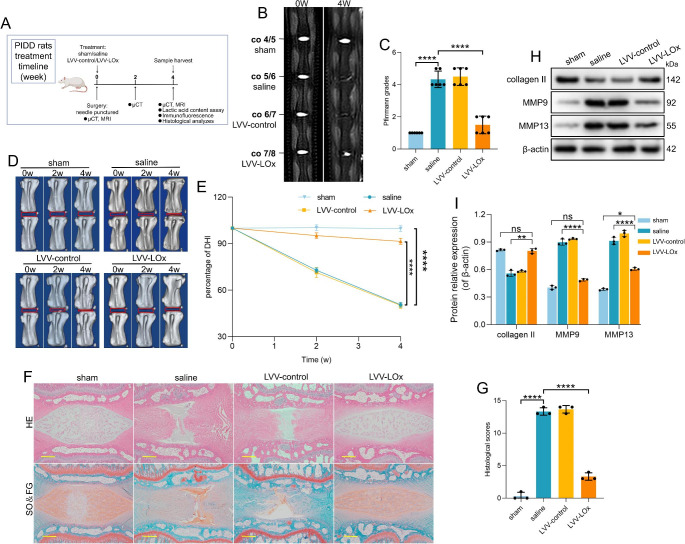
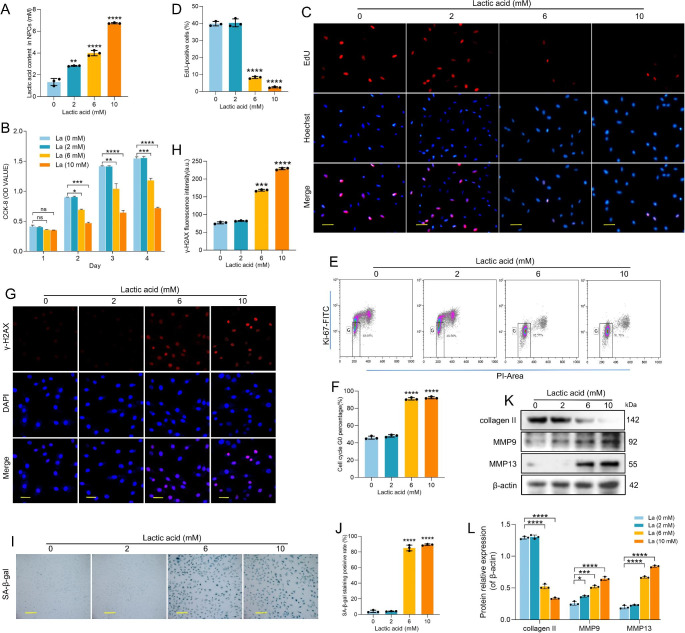
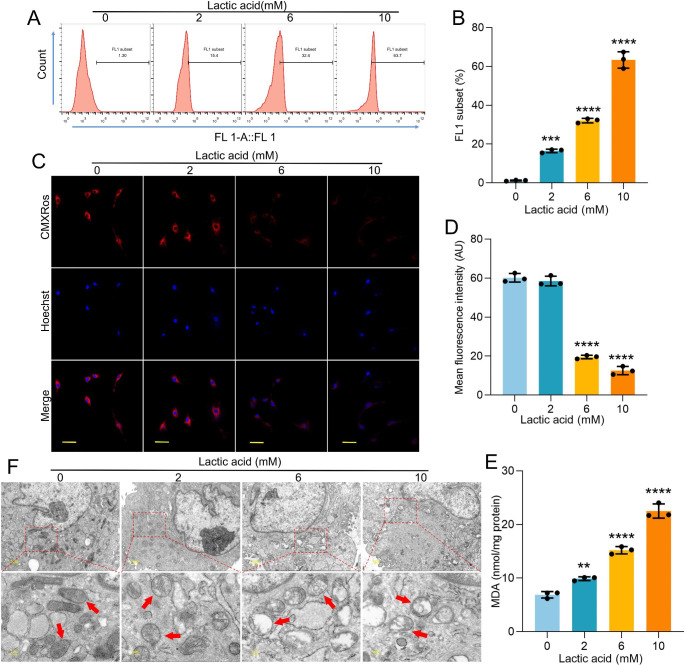
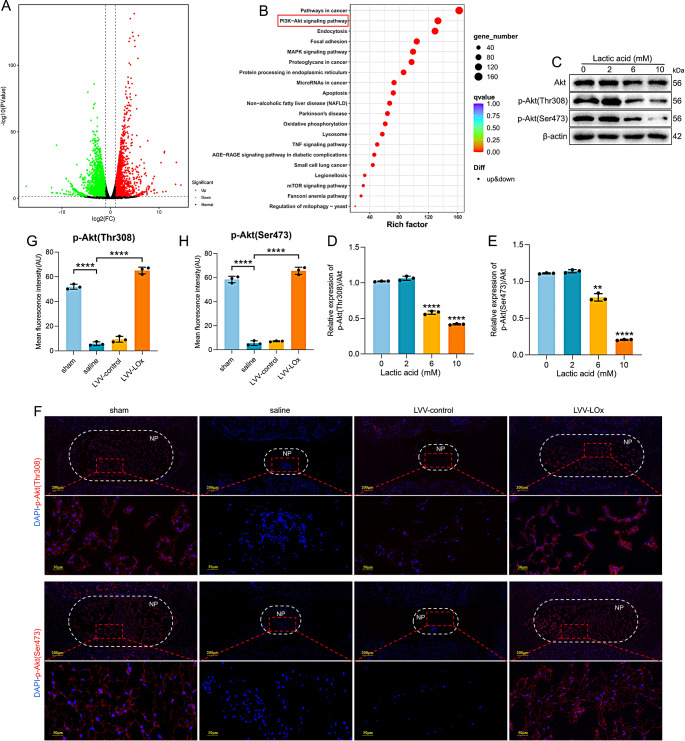
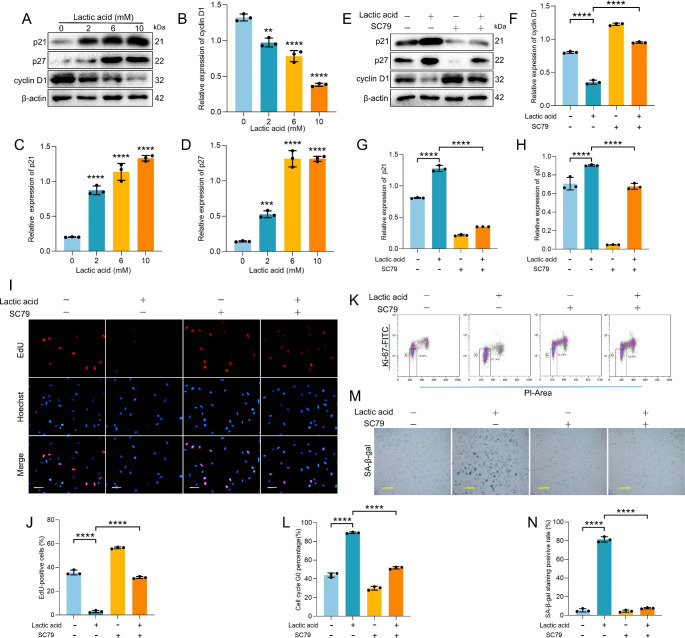
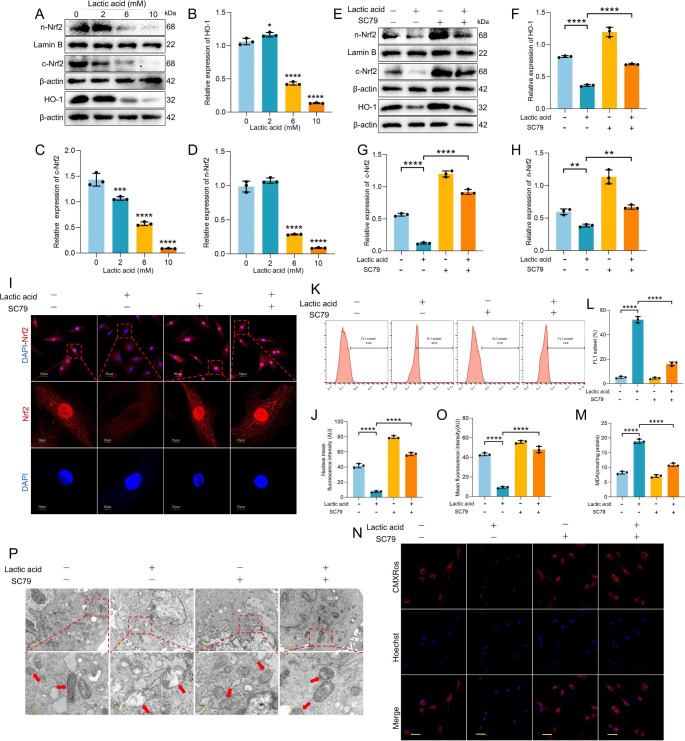
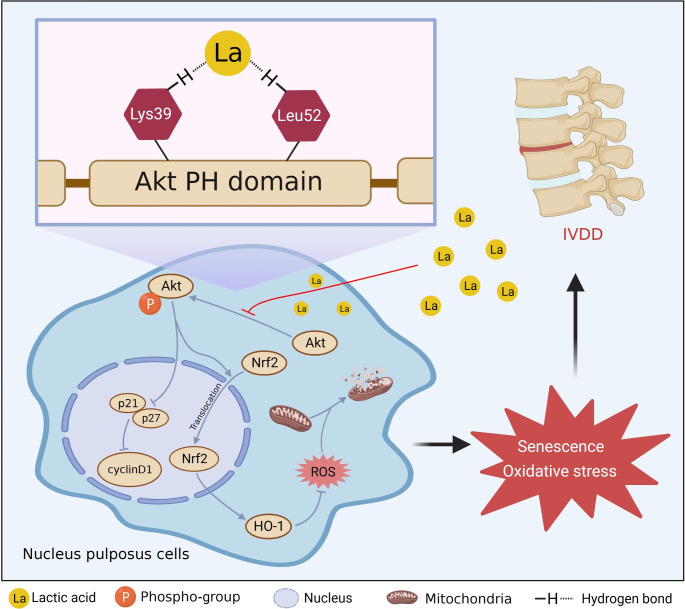
The accumulation of metabolites in the intervertebral disc is considered an important cause of intervertebral disc degeneration (IVDD). Lactic acid, which is a metabolite that is produced by cellular anaerobic glycolysis, has been proven to be closely associated with IVDD. However, little is known about the role of lactic acid in nucleus pulposus cells (NPCs) senescence and oxidative stress. The aim of this study was to investigate the effect of lactic acid on NPCs senescence and oxidative stress as well as the underlying mechanism. A puncture-induced disc degeneration (PIDD) model was established in rats. Metabolomics analysis revealed that lactic acid levels were significantly increased in degenerated intervertebral discs. Elimination of excessive lactic acid using a lactate oxidase (LOx)-overexpressing lentivirus alleviated the progression of IVDD. In vitro experiments showed that high concentrations of lactic acid could induce senescence and oxidative stress in NPCs. High-throughput RNA sequencing results and bioinformatic analysis demonstrated that the induction of NPCs senescence and oxidative stress by lactic acid may be related to the PI3K/Akt signaling pathway. Further study verified that high concentrations of lactic acid could induce NPCs senescence and oxidative stress by interacting with Akt and regulating its downstream Akt/p21/p27/cyclin D1 and Akt/Nrf2/HO-1 pathways. Utilizing molecular docking, site-directed mutation and microscale thermophoresis assays, we found that lactic acid could regulate Akt kinase activity by binding to the Lys39 and Leu52 residues in the PH domain of Akt. These results highlight the involvement of lactic acid in NPCs senescence and oxidative stress, and lactic acid may become a novel potential therapeutic target for the treatment of IVDD.

Keywords: Akt; Intervertebral disc degeneration; Lactic acid; Nucleus pulposus cell; Oxidative stress; Senescence.


Conflict of interest statement

The authors declare no conflicts of interest.

Figures

Fig. 1
Fig. 1
Lactic acid accumulation in degenerative discs. (A) Magnetic resonance imaging of patients with different Pfirrmann grades and the morphology of the nucleus pulposus tissue removed during surgery. (B) HE staining of nucleus pulposus tissues from people with different degrees of degeneration. Red arrows indicate human NPCs (scale bar = 500 μm). (C) Measurement of lactic acid content in human NP tissues with different degrees of degeneration using a lactic acid detection kit (n = 12). (D) Flow chart and timeline of in vivo experiments. (E-F) MRI detection and Pfirrmann grades of rats after different treatments (n = 9). (G-H) HE staining, SO&FG staining, and histological scores of the intervertebral disc in different groups (scale bar = 500 μm; n = 6). (I-J) Western blotting analysis showing collagen II, MMP9 and MMP13 expression in the nucleus pulposus of the normal and PIDD groups and quantification of the results. (K) Measurement of lactic acid content in rat NP tissues of normal rats and rats with PIDD using a lactic acid detection kit (n = 6). (L) Heatmap of differentially abundant metabolites in the NP tissues of normal rats and rats with PIDD. (M) Metabolomics detection of lactic acid content in the NP tissue of normal rats and rats with PIDD (n = 6). *p < 0.05; **p < 0.01; ***p < 0.001; ****p < 0.0001
Fig. 2
Fig. 2
Reduced degree of IVDD after eliminating lactic acid. (A) Flow chart and timeline of in vivo experiments. (B-C) MRI detection and Pfirrmann grades of rats after different treatments (n = 6). (D-E) Changes in the DHI% were evaluated by µCT detection (n = 6). (F-G) HE staining, SO&FG staining, and histological scores of the intervertebral disc in different groups (scale bar = 500 μm. n = 3). (H-I) Western blotting analysis showing collagen II, MMP9 and MMP13 expression in different groups and quantification of the results. *p < 0.05; **p < 0.01; ****p < 0.0001; ns represents no statistical significance
Fig. 3
Fig. 3
High concentrations of lactic acid inhibited NPCs proliferation. (A) Measurement of lactic acid content in NPCs using a lactic acid detection kit (n = 3). (B) The effect of different concentrations or treatment times of lactic acid on the proliferation of NPCs as determined by CCK-8 assay (n = 3). (C-D) The effect of different concentrations of lactic acid on the proliferation of NPCs as determined by EdU staining. Proliferating NPCs appeare red, and nuclei were counterstained with Hoechst 33,258 (blue) (scale bar = 100 μm. n = 3). (E-F) The effect of different concentrations of lactic acid on the cell cycle of NPCs; the box positions represent negative controls (n = 3). (G-H) The effect of different concentrations of lactic acid on DNA double stranded as determined by γ-H2AX; DNA double-stranded-damaged cells appear red, and nuclei were counterstained with DAPI (blue) (scale bar = 50 μm. n = 3). (I-J) The effect of different concentrations of lactic acid on the NPCs senescence as determined by SA-β-gal assay; senescent cells appear blue (scale bar = 200 μm. n = 3). (K-L) Western blotting analysis showing the effect of different lactic acid concentrations on collagen II, MMP9 and MMP13 expression and quantification of the results. La represents lactic acid; *p < 0.05; **p < 0.01; ***p < 0.001; ****p < 0.0001; ns represents no statistical significance
Fig. 4
Fig. 4
High concentrations of lactic acid damage mitochondria and induce oxidative stress in NPCs. (A-B) The effect of different concentrations of lactic acid on ROS production in NPCs. The FL1 subset was set according to the ROS intensity of the negative control (n = 3). (C-D) The effect of different concentrations of lactic acid on the MMP of NPCs as determined by the CMXRos probe (red); nuclei were counterstained with Hoechst 33,258 (blue) (scale bar = 50 μm. n = 3). (E) The effect of different concentrations of lactic acid on the MDA content of NPCs (n = 3). (F) The effect of different concentrations of lactic acid on the mitochondrial morphology of NPCs detected by TEM. **p < 0.01; ***p < 0.001; ****p < 0.0001
Fig. 5
Fig. 5
High concentrations of lactic acid affected the phosphorylation of Akt in NPCs. (A) Volcano map of differentially expressed genes in NPCs after treatment with lactic acid. (B) KEGG pathway analysis of differentially expressed genes in NPCs after treatment with lactic acid. (C-E) Western blotting analysis showing the effect of different lactic acid concentrations on p-Akt (Thr308), and p-Akt (Ser473) expression and quantification of the results (n = 3). (F-G) Immunofluorescence staining of p-Akt (Thr308) and p-Akt (Ser473) in NP tissues in different groups (n = 3). **p < 0.01; ****p < 0.0001
Fig. 6
Fig. 6
Lactic acid regulates the function of NPCs by binding to specific sites of Akt. (A) Detection of Akt kinase activity in NPCs after treatment with different concentrations of lactic acid (n = 3). (B) Domain structure of Akt. (C-D) Molecular docking diagram of lactic acid and Akt. (E) Western blotting analysis showed Akt expression after knocking down Akt with shRNA and transfecting AktWT, AktK39A, AktL52A and AktK39A,L52A into NPCs respectively. (F) Detection of Akt kinase activity in NPCs of different groups (n = 3). (G-H) The effect of site mutation of Akt on the proliferation of NPCs (red) as determined by EdU staining. Nuclei were counterstained with Hoechst 33,258 (blue) (scale bar = 100 μm. n = 3). (I-J) The effect of lactic acid (10 mM) on the senescence of Akt site-mutated NPCs (blue) as determined by SA-β-gal assay (scale bar = 200 μm. n = 3). (K-L) The effect of lactic acid (10 mM) on ROS production of Akt site-mutated NPCs as determined by a DCFH-DA probe. The FL1 subset was set according to the ROS intensity of the negative control (n = 3). (M-P) Western blotting analysis showing the effect of lactic acid (10 mM) on collagen II, MMP9 and MMP13 expression in Akt site-mutated NPCs and quantification of the results (n = 3). (Q-T) MST analysis of lactic acid in the interaction of NT-647-NHS-labeled Akt. Kd represents the dissociation constant. La represents lactic acid; *p < 0.05; **p < 0.01; ***p < 0.001; ****p < 0.0001; ns represents no statistical significance
Fig. 7
Fig. 7
High concentrations of lactic acid inhibited the proliferation of NPCs via the Akt/p21/p27/cyclin D1 pathway. (A-D) Western blotting analysis showing the effect of different lactic acid concentrations on p21, p27, and cyclin D1 expression and quantification of the results (n = 3). (E-H) Western blotting analysis showing the effect of lactic acid and/or SC79 on p21, p27, and cyclin D1 expression and quantification of the results (n = 3). (I-J) The effect of lactic acid and/or SC79 on the proliferation of NPCs as measured by EdU staining. Proliferating NPCs appear red, and nuclei were counterstained with Hoechst 33,258 (blue) (scale bar = 100 μm. n = 3). (K-L) The effect of lactic acid and/or SC79 on the cell cycle of NPCs; the box positions represent negative controls (n = 3). (M-N) The effect of lactic acid and/or SC79 on the senescence of NPCs as determined by SA-β-gal assay. The senescent cells appeared blue (scale bar = 200 μm. n = 3). **p < 0.01; ***p < 0.001; ****p < 0.0001
Fig. 8
Fig. 8
High concentrations of lactic acid promote oxidative stress in NPCs via the Akt/Nrf2/HO-1 pathway. (A-D) Western blotting analysis showing the effect of different lactic acid concentrations on Nrf2 in the nucleus (n-Nrf2), Nrf2 in the cytoplasm (c-Nrf2), and HO-1 expression and quantification of the results (n = 3). (E-H) Western blotting analysis showing the effect of lactic acid and/or SC79 on n-Nrf2, c-Nrf2, and HO-1 expression and quantification of the results (n = 3). (I-J) The effect of lactic acid and/or SC79 on the Nrf2 nuclear translocation of NPCs as determined by immunofluorescence. Nrf2 in NPCs appeared red, and nuclei were counterstained with DAPI (blue) (n = 3). (K-L) The effect of lactic acid and/or SC79 on the ROS content of NPCs as determined by flow cytometry. The FL1 subset was set according to the ROS intensity of the negative control (n = 3). (M) The effect of lactic acid and/or SC79 on the MDA content of NPCs as determined by flow cytometry (n = 3). (N-O) The effect of lactic acid and/or SC79 on the MMP of NPCs as determined by the CMXRos probe (red); nuclei were counterstained with Hoechst 33,258 (blue) (scale bar = 50 μm. n = 3). (P) The effect of lactic acid and/or SC79 on the mitochondrial morphology of NPCs detected by TEM. *p < 0.05; **p < 0.01; ***p < 0.001; ****p < 0.0001
Fig. 9
Fig. 9
Schematic diagram of the signaling pathways involved in the promotion of senescence and oxidative stress in NPCs by and corresponding IVDD by lactic acid

Similar articles

Cited by

References

    1. Andersson G. Epidemiological features of chronic low-back pain. Lancet (London England) 1999;354(9178):581–585. doi: 10.1016/s0140-6736(99)01312-4. - DOI - PubMed
    1. Wu A, et al. Global low back pain prevalence and years lived with disability from 1990 to 2017: estimates from the global burden of Disease Study 2017. Annals of Translational Medicine. 2020;8(6):299. doi: 10.21037/atm.2020.02.175. - DOI - PMC - PubMed
    1. Urban J, Smith S, Fairbank J (2004) Nutrition of the intervertebral disc, Spine, 29(23):2700-9, 10.1097/01.brs.0000146499.97948.52 - PubMed
    1. Holm S, Maroudas A, Urban J, Selstam G, Nachemson A (1981) Nutrition of the intervertebral disc: solute transport and metabolism, Connective tissue research, 8(2):101–19, 10.3109/03008208109152130 - PubMed
    1. Radek M et al (2016) Assessing the correlation between the degree of disc degeneration on the Pfirrmann scale and the metabolites identified in HR-MAS NMR spectroscopy, Magnetic resonance imaging, 34(4):376–80, 10.1016/j.mri.2015.12.005 - PubMed

MeSH terms

Substances