. 2024 Feb;25(2):218-225.
doi: 10.1038/s41590-023-01724-6. Epub 2024 Jan 11.

Long COVID manifests with T cell dysregulation, inflammation and an uncoordinated adaptive immune response to SARS-CoV-2

Affiliations

Long COVID manifests with T cell dysregulation, inflammation and an uncoordinated adaptive immune response to SARS-CoV-2

Kailin Yin et al. Nat Immunol. 2024 Feb.

Abstract

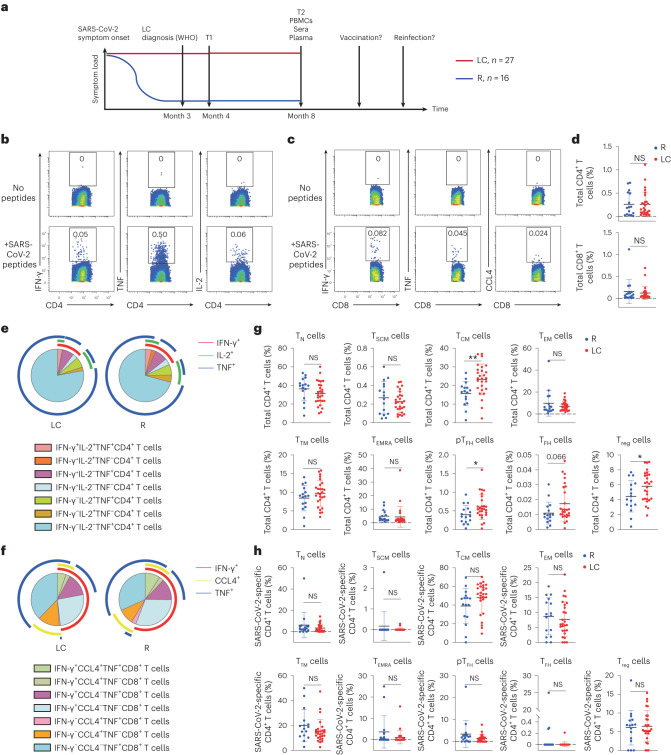
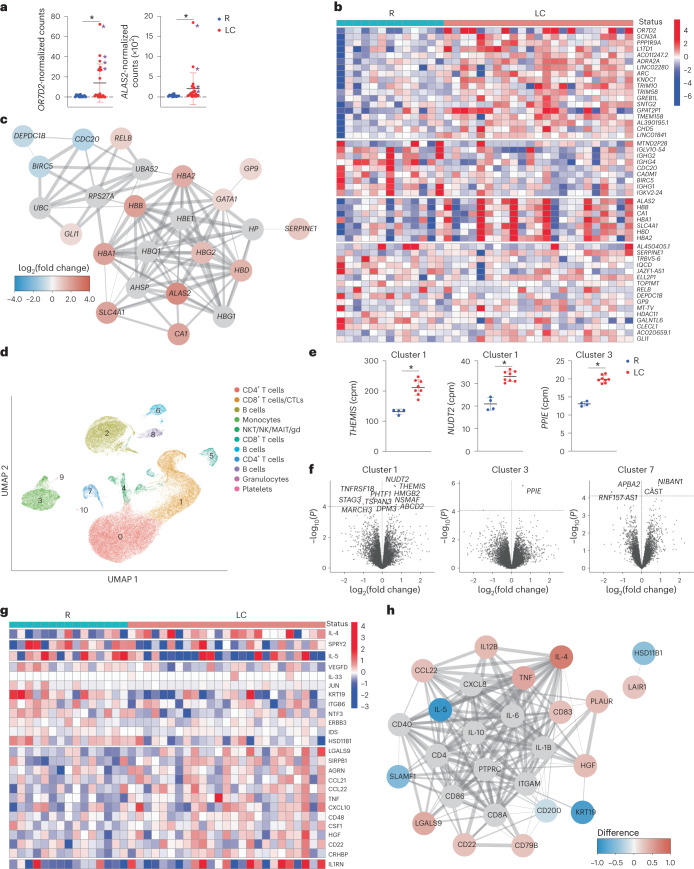
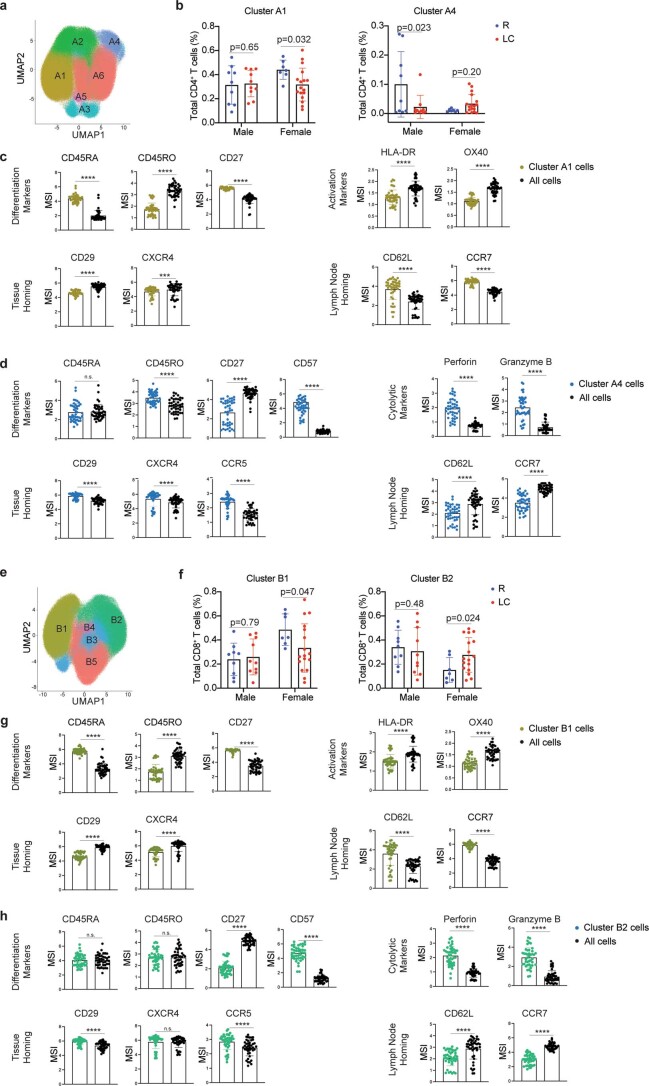
Long COVID (LC) occurs after at least 10% of severe acute respiratory syndrome coronavirus 2 (SARS-CoV-2) infections, yet its etiology remains poorly understood. We used 'omic" assays and serology to deeply characterize the global and SARS-CoV-2-specific immunity in the blood of individuals with clear LC and non-LC clinical trajectories, 8 months postinfection. We found that LC individuals exhibited systemic inflammation and immune dysregulation. This was evidenced by global differences in T cell subset distribution implying ongoing immune responses, as well as by sex-specific perturbations in cytolytic subsets. LC individuals displayed increased frequencies of CD4+ T cells poised to migrate to inflamed tissues and exhausted SARS-CoV-2-specific CD8+ T cells, higher levels of SARS-CoV-2 antibodies and a mis-coordination between their SARS-CoV-2-specific T and B cell responses. Our analysis suggested an improper crosstalk between the cellular and humoral adaptive immunity in LC, which can lead to immune dysregulation, inflammation and clinical symptoms associated with this debilitating condition.


Conflict of interest statement

M.J.P. reports consulting fees from Gilead Sciences and AstraZeneca, outside the submitted work. S.G.D. reports grants and/or personal fees from Gilead Sciences, Merck & Co., Viiv, AbbVie, Eli Lilly, ByroLogyx and Enochian Biosciences, outside the submitted work. T.J.H. receives grant support from Merck and consults for Roche. All other authors report no conflicts of interest.

Figures

Fig. 1
Fig. 1. CD4+ T cell phenotypes are perturbed in individuals with LC.
a, Strategy of biospecimen selection in individuals who resolved symptoms (R, n = 16) or who continuously experienced symptoms at month 4 (T1) and month 8 (T2) postinitial SARS-CoV-2 infection (LC, n = 27). The WHO definition for LC is persistent symptoms for 3 months or more after infection. All analyzed PBMCs, sera and plasma were from 8 months postinfection, a timepoint when none of the participants had been vaccinated nor re-infected. b,c, Expression of IFN-γ, TNF or IL-2 in CD4+ T cells (b) or IFN-γ, TNF or CCL4 in CD8+ T cells (c) stimulated (bottom) or not (top) with SARS-CoV-2 spike and T-scan peptides (Methods). d, Frequency of SARS-CoV-2-specific CD4+ or SARS-CoV-2-specific CD8+ T cells in LC and R individuals (two-sided Student’s t tests). e,f, Frequency of monofunctional or polyfunctional SARS-CoV-2-specific CD4+ (e) or SARS-CoV-2-specific CD8+ (f) T cells in LC versus R individuals. Polyfunctional cells co-express at least two of the cytokines IFN-γ, IL-2 and TNF (e) or IFN-γ, IL-2 and CCL4 (f). g, Frequencies of CD45RA+CD45ROCCR7+CD95 TN cells, CD45RA+CD45ROCCR7+CD95+ TSCM cells, CD45RACD45RO+CCR7+CD27+ TCM cells, CD45RACD45RO+CCR7CD27 TEM cells, CD45RACD45RO+CCR7CD27+ TTM cells, CD45RA+CD45ROCCR7 TEMRA cells, CD45RACD45RO+PD1+CXCR5+ peripheral pTFH cells, CD45RACD45RO+PD1highCXCR5high TFH cells and CD45RACD45RO+CD127CD25+ Treg cells among total CD4+ T cells from LC and R individuals. **P < 0.01, *P < 0.05 (two-sided Student’s t test). h, Frequencies of TN cells, TSCM cells, TCM cells, TEM cells, TTM cells, TEMRA cells, pTFH cells, TFH cells and Treg cells among SARS-CoV-2-specific CD4+ T cells from LC and R individuals. Horizontal bars indicate mean, error bars indicate s.d., and dots represent individuals, with n = 27 LC and n = 16 R (d, g and h). NS, not significant; WHO, World Health Organization.
Fig. 2
Fig. 2. SARS-CoV-2-specific CD4+ T cells from individuals with LC preferentially express homing receptors associated with migration to inflamed tissues.
a, t-SNE contour depiction of SARS-CoV-2-specific CD4+ T cells from LC and R individuals. b, Expression of CXCR4, CXCR5 and CCR6 in SARS-CoV-2-specific CD4+ T cells from LC and R individuals. MSI corresponds to the mean signal intensity of the indicated markers’ expression level, reported as arcsinh-transformed CyTOF data. c,d, Percentages of CXCR4+CXCR5+CD4+, CXCR5+CCR6+CD4+ and CXCR4+CCR6+CD4+ SARS-CoV-2-specific (c) and total (d) CD4+ T cells in LC and R individuals. *P < 0.05 (two-sided Student’s t test). e,f, Associations of percentages of total (e) or SARS-CoV-2-specific (f) CXCR4+CXCR5+CD4+ and CXCR5+CCR6+CD4+ T cells with percentages of pTFH cells in LC and R individuals. Data were analyzed by Pearson correlation coefficient and two-tailed unpaired t tests. Horizontal bars indicate mean, error bars indicate s.d. and dots represent individuals, with n = 27 LC and n = 16 R (c,d).
Fig. 3
Fig. 3. SARS-CoV-2-specific CD8+ T cells from individuals with LC preferentially express the exhaustion markers PD1 and CTLA4.
a, t-SNE contour depiction of SARS-CoV-2-specific CD8+ T cells from LC and R individuals. b, Expression of PD1, CTLA4 and TIGIT on SARS-CoV-2-specific CD8+ T cells from LC and R individuals. c,d, Percentages of PD1+CTLA4+CD8+, TIGIT+CTLA4+CD8+ and PD1+TIGIT+CD8+ SARS-CoV-2-specific (c) and total (d) CD8+ T cells in LC and R individuals. *P < 0.05 (two-sided Student’s t test). Horizontal bars indicate mean, error bars indicate s.d. and dots represent individuals, with n = 27 LC and n = 16 R (c,d).
Fig. 4
Fig. 4. Humoral and cellular immunity are discoordinated in individuals with LC.
a, Total SARS-CoV-2 RBD-specific antibody levels in LC and R individuals. *P < 0.05 (two-sided Student’s t test). Horizontal bars indicate mean, error bars indicate s.d. and dots represent individuals. LC (n = 26), R (n = 15). b, Plot depicting the percentage of PD1+CTLA4+ cells among SARS-CoV-2-specific CD8+ T cells and RBD antibody levels in LC and R individuals. Individuals with the highest humoral response are circled in green, and those with the highest percentages of PD1+CTLA4+ SARS-CoV-2-specific CD8+ T cells are circled in purple (left). c, Plot depicting the association between RBD antibody levels and the percentages of SARS-CoV-2-specific CD4+ T cells, SARS-CoV-2-specific CD4+ pTFH cells (middle) and SARS-CoV-2-specific CD8+ T cells (right) in LC and R individuals. Data were analyzed by Pearson correlation coefficient and two-tailed unpaired t tests.
Fig. 5
Fig. 5. Global changes in gene and gene product expression in the blood of individuals with LC.
a, Relative expression of OR7D2 and ALAS2 as determined by bulk RNA-seq analysis of whole blood from LC versus R individuals. *P < 0.05 (two-sided Wald test, Benjamini–Hochberg correction). Purple asterisks identify the female donors selected for scRNA-seq analyses. Horizontal bars indicate mean, error bars indicate s.d. and dots represent individuals. LC (n = 23) and R (n = 13). b, Heatmap of the top 50 DEGs in LC versus R individuals based on clustering analysis of bulk RNA-seq data. Genes are grouped into k clusters based on similarity. c, Network mapping of DEGs from bulk RNA-seq analysis. Each node corresponds to a gene; colors of nodes indicate the extent of change; red indicates upregulation and blue indicates downregulation in LC compared to R. Edges depict the functional relevance between pairs of genes, where thickness corresponds to confidence of evidence. d, UMAP of clusters of all LC and R PBMCs analyzed by scRNA-seq. LC (n = 8) and R (n = 4). e, Relative expression of THEMIS and NUDT2 in CD8+ T cell cluster 1 and PPIE in monocyte cluster 3 in LC versus R individuals as determined by scRNA-seq analysis. *P < 0.05 (two-sided empirical Bayes quasi-likelihood F tests, with Benjamini–Hochberg correction). Horizontal bars indicate mean, error bars indicate s.d. and dots represent individuals. LC (n = 8) and R (n = 4). f, Volcano plots depicting DEGs in LC versus R individuals in scRNA-seq-defined clusters. DEGs with P < 0.1 (two-sided empirical Bayes quasi-likelihood F tests, Benjamini–Hochberg correction) are labeled. The x axes represent the log2(fold change) of the mean expression of each gene between the comparison groups, and the y axes represent the raw −log10(P values). Dashed horizontal lines delineate thresholds corresponding to Benjamini–Hochberg adjusted P values of <0.1. g, Clustered heatmap of the top 25 differentially expressed proteins from Olink analysis performed on plasma of LC and R individuals with markers grouped into k-means clusters based on similarity. LC (n = 25) and R (n = 15). h, Network mapping of related differentially expressed proteins as detected by Olink. Graph representations as in c.
Extended Data Fig. 1
Extended Data Fig. 1. Cohort characteristics, study design, and subset identification.
ac, Number of sequelae symptoms at 4 (M4) and 8 (M8) months post-infection (n = 27 LC, n = 16 R) (a), and the numbers of individuals that were male or female (b) and that were hospitalized at the time of acute COVID-19 infection (c), in LC and R study participants. *p < 0.05 (two-sided paired sample t-test). d, The numbers of indicated co-morbidities in LC vs R study participants. e, BMI in LC vs R study participants. *p < 0.05 (two-sided student’s t-test). Horizontal bars indicate mean, error bars indicate SD, and dots represent individuals, with n = 27 LC and n = 16R. f. Schematic of experimental design and data analyses. Blood specimens from 27 LC and 16 R individuals were subjected to Olink, serology, CyTOF, and RNA-seq and scRNA-seq analysis. The indicated tools on the right were then used for analyses of the resulting high-dimensional datasets. g,h, Gating strategy to identify T cell populations. Intact, live, singlet cells from baseline (g) or SARS-CoV-2 peptide-treated (h) samples were gated for CD3+ T cells followed by sub-gating on CD4+ and CD8+ T cells as indicated. i,j, Gating strategy to define classical CD4+ (i) and CD8+ (j) T cell subsets.
Extended Data Fig. 2
Extended Data Fig. 2. Cytokine and effector molecule expression in SARS-CoV-2-specific T cells.
a,b CD4+ (a) or CD8+ (b) T cells from representative donor, stimulated (bottom) or not (top) with SARS-CoV-2 spike and T-scan peptides (Methods). Red boxes highlight the cytokines used to define the SARS-CoV-2-specific T cells. c,d The percentages of SARS-CoV-2-specific CD4+ (c) and CD8+ (d) T cells as defined by induction of IFN-γ, IL-2, CCL4, or TNF in response to SARS-CoV-2 peptide stimulations (two-sided student’s t-test). e,f, IL-6+ CD4+ T cells are observed in LC individuals. e, CD4+ T cells from representative donor, stimulated (right) or not (left) with SARS-CoV-2 spike and T-scan peptides (Methods). f, The percentages of SARS-CoV-2-specific CD4+ T cells inducing IL-6 in response to SARS-CoV-2 peptide stimulations. *p < 0.05 (two-sided Welch’s t-test). Horizontal bars indicate mean, error bars indicate SD, and dots represent individuals, with n = 27 LC and n = 16 R (c, d, f).
Extended Data Fig. 3
Extended Data Fig. 3. Subset distribution of total and SARS-CoV-2-specific CD8+ T cells among LC and R individuals.
a, Frequencies of TN cells, TSCM cells, TCM cells, TEM cells, TTM cells, and TEMRA cells among total CD8+ T cells from LC and R individuals (two-sided student’s t-test). b, Frequencies of TN cells, TSCM cells, TCM cells, TEM cells, TTM cells, and TEMRA cells among SARS-CoV-2-specific CD8+ T cells from LC and R individuals (two-sided student’s t-test).
Extended Data Fig. 4
Extended Data Fig. 4. MSI of CyTOF phenotyping markers among total CD4+ and CD8+ T cells from LC and R individuals.
Antigens are shown in the order listed in Supplementary Table 4. Results are gated on live, singlet CD4+ (a) or CD8+ (b) T cells. No significant differences were observed between LC and R individuals for any of the antigens (two-sided t-test with multiple correction by Sidak adjustment). Box plots represent the median (middle bar), 75% quartile (upper hinge) and 25% (lower hinge) with whiskers extending 1.5× interquartile range, dots represent individuals with n = 27 LC and n = 16 R.
Extended Data Fig. 5
Extended Data Fig. 5. MSI of CyTOF phenotyping markers among SARS-CoV-2-specific CD4+ and CD8+ T cells from LC and R individuals.
Results are similar to that shown in Extended Data Fig. 4, but gated on SARS-CoV-2-specific CD4+ (a) or CD8+ (b) T cells. No significant differences were observed between LC and R individuals for any of the antigens (two-sided t-test with multiple correction by Sidak adjustment). Box plots represent the median (middle bar), 75% quartile (upper hinge) and 25% (lower hinge) with whiskers extending 1.5× interquartile range, dots represent individuals with n = 27 LC and n = 16 R.
Extended Data Fig. 6
Extended Data Fig. 6. Activated T cells are not more abundant in individuals with LC.
The percentages of total CD4+ T cells (a), total CD8+ T cells (b), SARS-CoV-2-specific CD4+ T cells (c), and SARS-CoV-2-specific CD8+ T cells (d) expressing acute activation markers CD38, HLA-DR, and/or Ki67 in LC and R individuals (two-sided student’s t-tests). Horizontal bars indicate mean, error bars indicate SD, and dots represent individuals, with n = 27 LC and n = 16 R.
Extended Data Fig. 7
Extended Data Fig. 7. Sex-dimorphic T cell cluster distribution in individuals with LC.
a, Cluster distribution among total CD4+ T cells as depicted by UMAP. b, The distributions of CD4+ T cell clusters A1 and A4 in male and female individuals, with or without LC. Two-sided p-values were derived from a GLMM fit (see Methods). Individual points represent individuals, with n = 10 LC and n = 9 R in the male group and n = 17 LC and n = 7 R in the female group, and where the value corresponds to % of cells belonging to clusters A1 or A4. c, Expression levels of differentiation markers (CD45RA, CD45RO, CD27), activation markers (HLA-DR, OX40), tissue homing receptors (CD29, CXCR4), and lymph node homing receptors (CD62L, CCR7) on CD4+ T cell cluster A1 compared to total baseline CD4+ T cells. d, Expression levels of differentiation markers (CD45RA, CD45RO, CD27, CD57), cytolytic effectors (perforin, granzyme B), tissue homing receptors (CD29, CXCR4, CCR5), and lymph node homing receptors (CD62L, CCR7) on CD4+ T cell cluster A4 compared to total baseline CD4+ T cells. e, Cluster distribution among total CD8+ T cells as depicted by UMAP. f, The distributions of CD8+ T cell clusters B1 and B2 in male and female individuals, with or without LC. Two-sided p-values were derived from a GLMM fit (see Methods). Individual points represent individuals, with n = 10 LC and n = 9 R in the male group and n = 17 LC and n = 7 R in the female group, and where the value corresponds to % of cells belonging to clusters B1 or B2. g, Expression levels of differentiation markers (CD45RA, CD45RO, CD27), activation markers (HLA-DR, OX40), tissue homing receptors (CD29, CXCR4), and lymph node homing receptors (CD62L, CCR7) on CD8+ T cell cluster B1 compared to total baseline CD8+ T cells. h, Expression levels of differentiation markers (CD45RA, CD45RO, CD27, CD57), cytolytic effectors (perforin, granzyme B), tissue homing receptors (CD29, CXCR4, CCR5), and lymph node homing receptors (CD62L, CCR7) on CD8+ T cell cluster B2 compared to total baseline CD8+ T cells. ****p < 0.0001 (two-sided paired t-test, c,d,g,h). Horizontal bars indicate mean, error bars indicate SD, and dots represent individuals, with n = 27 LC and n = 16 R (bd,fh).
Extended Data Fig. 8
Extended Data Fig. 8. Flow cytometric validation and association analyses.
a, Association of flow cytometric (mean fluorescence intensity, MFI) vs CyTOF (MSI) expression levels of CXCR4, CXCR5, and CCR6. Data were analyzed by Pearson correlation coefficient and two-tailed unpaired t-tests. b, Flow cytometric gating strategy to identify memory CD4+ T cells expressing various combinations of CXCR4, CXCR5, and CCR6. c, The percentages of CXCR4+CXCR5+CD4+, CXCR5+CCR6+CD4+, and CXCR4+CCR6+CD4+ T cells in LC vs R individuals as determined by flow cytometry. *p < 0.05 (two-sided student’s t-test). d, The percentages of cells dually expressing PD1 and CTLA4 among SARS-CoV-2-specific CD8+ (left) or cells dually expressing IFN-γ and TNF among total CD8+ T cells (right), as determined by flow cytometry. *p < 0.05 (two-sided student’s t-test). Horizontal bars indicate mean, error bars indicate SD, and dots represent individuals, with n = 25 LC and n = 15 R (c,d). e, Associations of percentages of CXC4+CXCR5+CD4+ T cells or CXCR5+CCR6+CD4+ T cells with IL-4 levels in LC vs R individuals. Data were analyzed by Pearson correlation coefficient and two-tailed unpaired t-tests.
Extended Data Fig. 9
Extended Data Fig. 9. scRNAseq analysis reveals OR7D2 and ALAS2 expression in multiple subsets, validates tissue-homing chemokine receptor expression among LC CD4+ T cells, and identifies DEGs among subsets in LC individuals.
a,b, UMAP of cells analyzed by scRNA-seq among LC (n = 8) vs R (n = 4) individuals (a), and among the LC individuals classified as OR7D2high (n = 4) vs. ALAS2high (n = 4) (b). c, OR7D2 and ALAS2 expression in the OR7D2high LC, ALAS2high LC, and R individuals. **p < 0.01 (two-sided Welch two-sample t-test). Box plots represent the median (middle bar), 75% quartile (upper hinge) and 25% (lower hinge) with whiskers extending 1.5× interquartile range, dots represent individuals with n = 8 LC and n = 4R. d, UMAP depictions of cells expressing (blue) or not expressing (grey) OR7D2 or ALAS2 in individuals with LC. e, OR7D2 and ALAS2 expression in scRNA-seq-identified clusters labeled in Fig. 5d in individuals with LC, depicted as mean % of cells that were positive for OR7D2 or ALAS2 reads. f, Volcano plots showing LC vs R individuals for scRNA-seq-identified CD4+ T cell clusters 0 and 7, depicting CXCR4, CXCR5, and CCR6. g,h, Volcano plots depicting scRNA-seq-defined clusters 0, 1, 5, 7, and 8 for OR7D2high vs. R (g), or clusters 1, 5, 6, 7, and 8 for ALAS2high vs. R (h) individuals. DEGs with p < 0.05 (as determined empirical Bayes quasi-likelihood F-tests, with Benjamini-Hochberg correction) are labeled. Genes preferentially expressed in LC individuals are depicted on the right, and those preferentially expressed in R individuals on the left. The x-axes represent the log2(fold-change) of the mean expression of each gene between the comparison groups, and the y-axes represent the raw –log10(p-values). Dashed horizontal lines delineate the thresholds corresponding to Benjamini-Hochberg adjusted two-tailed p-values of <0.05 (Methods).
Extended Data Fig. 10
Extended Data Fig. 10. Validation of CyTOF antibodies.
a, CyTOF analysis of human lymphoid aggregate cultures generated from tonsils depicting CD3+ T cells on the top and CD3 B cells on the bottom as indicated, analogous to methods previously described. b, CyTOF analysis of PMA/ionomycin- or LPS-stimulated PBMCs, depicting CD3+ T cells on the top and CD3 cells on the bottom, similar to prior studies. c, Expression of Foxp3 among CD4+ Treg cells and CD4+ TN cells, as assessed by CyTOF. d, Expression of CD30 and Ki67 among CD3+ CD45RO+CD45RACD4+ T memory (TM) cells and CD4+ TN cells, as assessed by CyTOF. ****p < 0.0001 (two-sided paired t-test). e, Illustration of pTFH gate implemented on PBMC samples, and TFH gate implemented on tonsil samples. Cells were pre-gated on CD4+ TM cells.

Update of

References

    1. Davis HE, McCorkell L, Vogel JM, Topol EJ. Long COVID: major findings, mechanisms and recommendations. Nat. Rev. Microbiol. 2023;21:133–146. doi: 10.1038/s41579-022-00846-2. - DOI - PMC - PubMed
    1. Ma T, et al. Protracted yet coordinated differentiation of long-lived SARS-CoV-2-specific CD8+ T cells during convalescence. J. Immunol. 2021;207:1344–1356. doi: 10.4049/jimmunol.2100465. - DOI - PMC - PubMed
    1. Neidleman J, et al. SARS-CoV-2-specific T cells exhibit phenotypic features of helper function, lack of terminal differentiation, and high proliferation potential. Cell Rep. Med. 2020;1:100081. doi: 10.1016/j.xcrm.2020.100081. - DOI - PMC - PubMed
    1. Neidleman J, et al. Distinctive features of SARS-CoV-2-specific T cells predict recovery from severe COVID-19. Cell Rep. 2021;36:109414. doi: 10.1016/j.celrep.2021.109414. - DOI - PMC - PubMed
    1. Neidleman J, et al. mRNA vaccine-induced T cells respond identically to SARS-CoV-2 variants of concern but differ in longevity and homing properties depending on prior infection status. eLife. 2021;10:e72619. doi: 10.7554/eLife.72619. - DOI - PMC - PubMed

Substances