
Accelarated immune ageing is associated with COVID-19 disease severity

Janet M Lord et al. Immun Ageing. .

Abstract

Background: The striking increase in COVID-19 severity in older adults provides a clear example of immunesenescence, the age-related remodelling of the immune system. To better characterise the association between convalescent immunesenescence and acute disease severity, we determined the immune phenotype of COVID-19 survivors and non-infected controls.

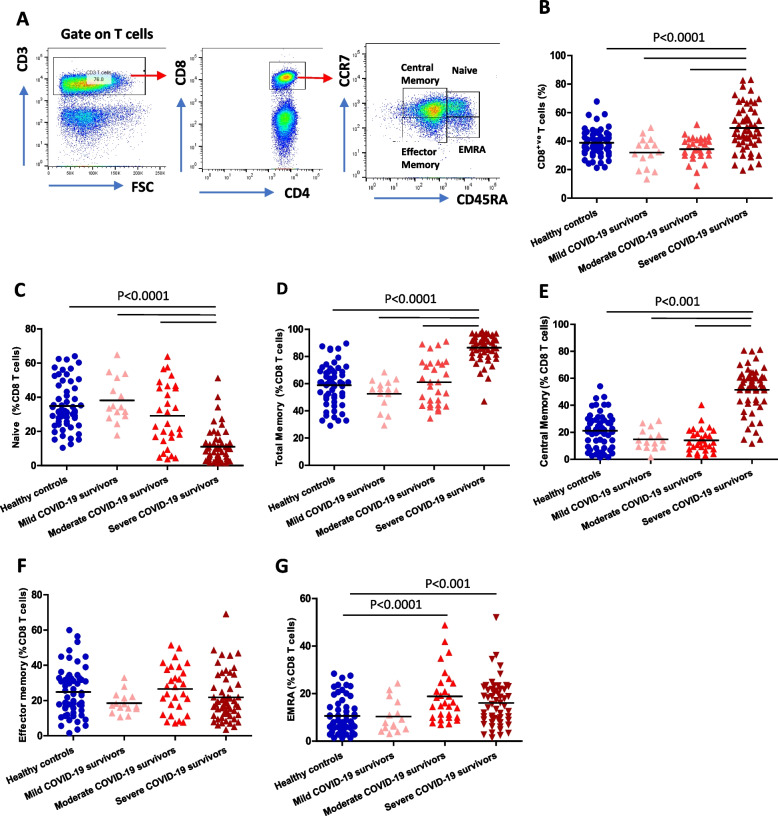
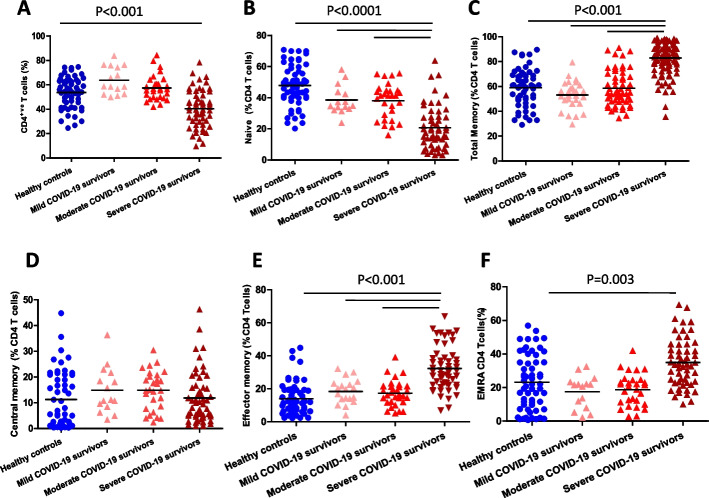
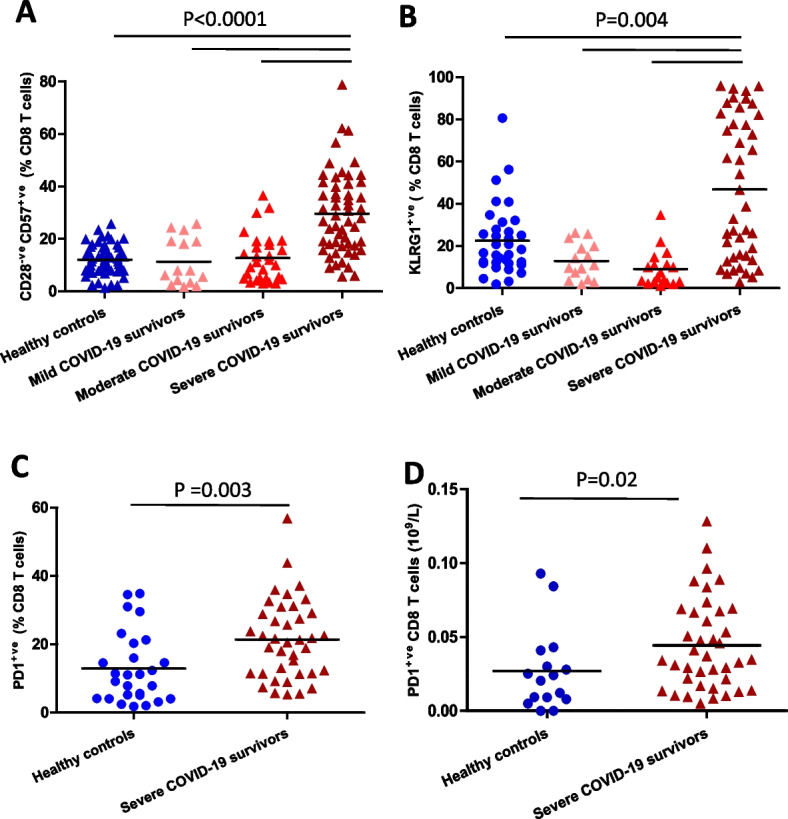
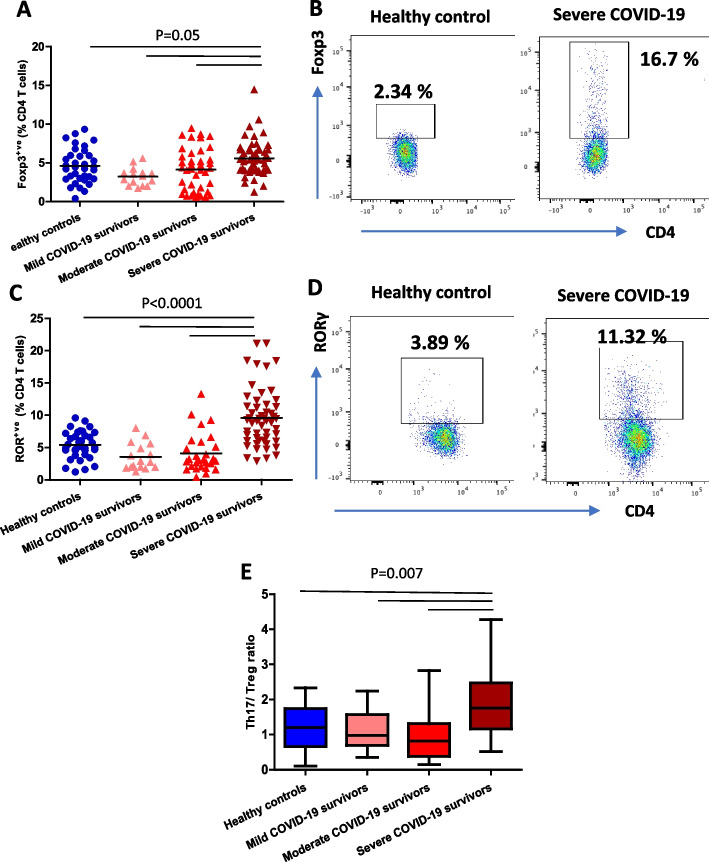
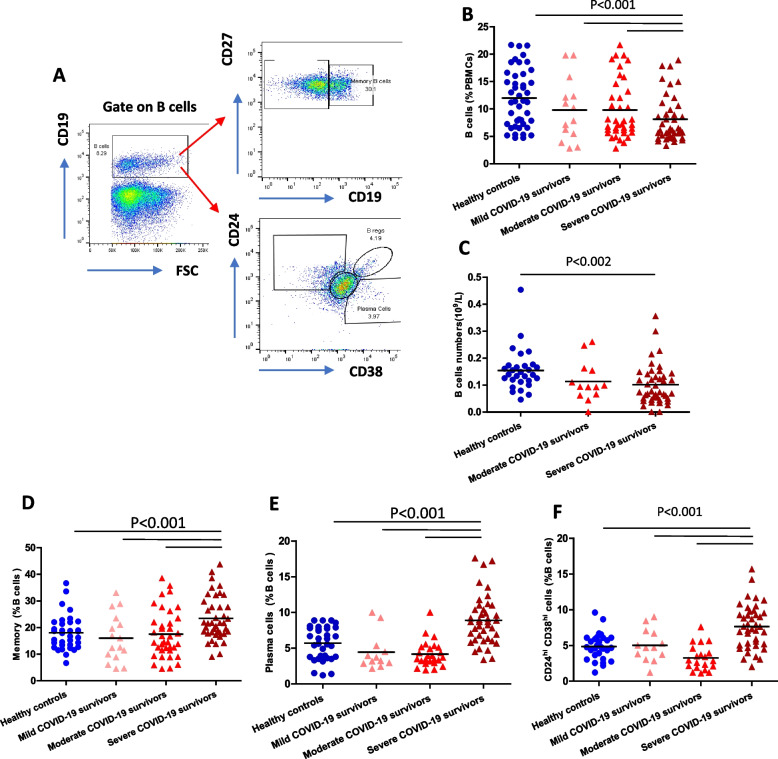
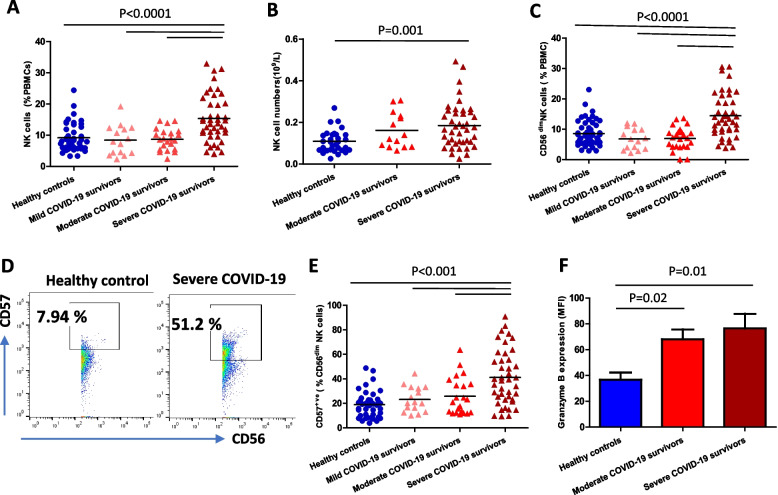
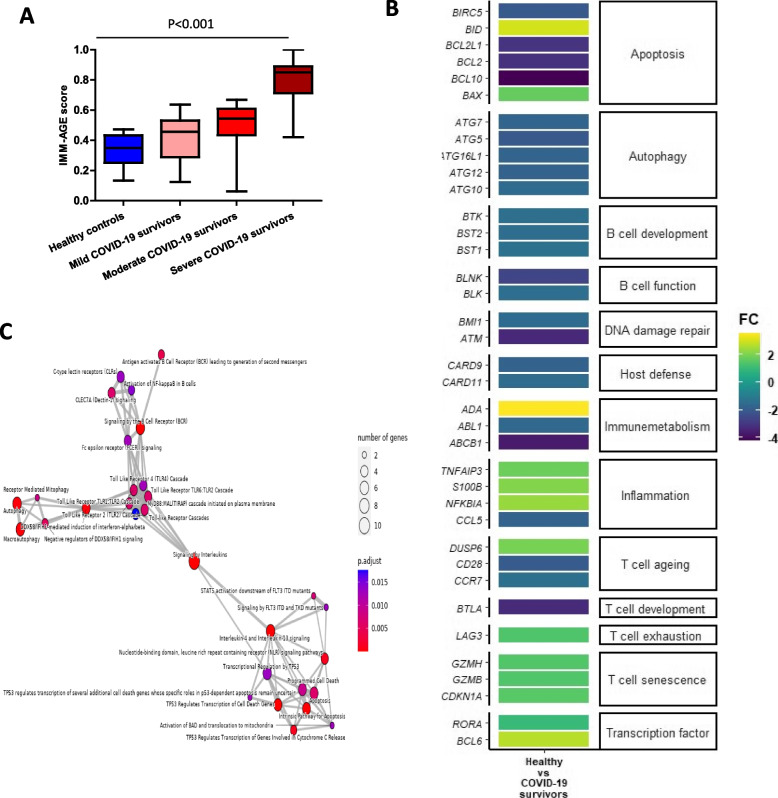
Results: We performed detailed immune phenotyping of peripheral blood mononuclear cells isolated from 103 COVID-19 survivors 3-5 months post recovery who were classified as having had severe (n = 56; age 53.12 ± 11.30 years), moderate (n = 32; age 52.28 ± 11.43 years) or mild (n = 15; age 49.67 ± 7.30 years) disease and compared with age and sex-matched healthy adults (n = 59; age 50.49 ± 10.68 years). We assessed a broad range of immune cell phenotypes to generate a composite score, IMM-AGE, to determine the degree of immune senescence. We found increased immunesenescence features in severe COVID-19 survivors compared to controls including: a reduced frequency and number of naïve CD4 and CD8 T cells (p < 0.0001); increased frequency of EMRA CD4 (p < 0.003) and CD8 T cells (p < 0.001); a higher frequency (p < 0.0001) and absolute numbers (p < 0.001) of CD28-ve CD57+ve senescent CD4 and CD8 T cells; higher frequency (p < 0.003) and absolute numbers (p < 0.02) of PD-1 expressing exhausted CD8 T cells; a two-fold increase in Th17 polarisation (p < 0.0001); higher frequency of memory B cells (p < 0.001) and increased frequency (p < 0.0001) and numbers (p < 0.001) of CD57+ve senescent NK cells. As a result, the IMM-AGE score was significantly higher in severe COVID-19 survivors than in controls (p < 0.001). Few differences were seen for those with moderate disease and none for mild disease. Regression analysis revealed the only pre-existing variable influencing the IMM-AGE score was South Asian ethnicity ([Formula: see text] = 0.174, p = 0.043), with a major influence being disease severity ([Formula: see text] = 0.188, p = 0.01).

Conclusions: Our analyses reveal a state of enhanced immune ageing in survivors of severe COVID-19 and suggest this could be related to SARS-Cov-2 infection. Our data support the rationale for trials of anti-immune ageing interventions for improving clinical outcomes in these patients with severe disease.


Conflict of interest statement

The authors declare no competing interests.

Figures

Fig. 1
Fig. 1
CD8 T cell subset distribution post-COVID-19 infection. A Gating strategy used to analyse markers subsets within CD4+ve and CD8+ve T cells; naïve (CCR7+veCD45RA+ve); central memory (CCR7+veCD45RA−ve), effector memory (CCR7−veCD45RA−ve) and terminal differentiated effector memory re-expressing RA, EMRA (CCR7−veCD45RA+ve) T cells. Comparison of the systemic percentage of: B CD8 T cells; C Naïve CD8 T cells; D Total memory CD8 T cells; E Central memory CD8 T cells; F Effector memory CD8 T cells G EMRA CD8 T cells. PBMCs were isolated from convalescent COVID-19 patients who had mild (n = 15), moderate (n = 29) and severe (n = 55) disease 3–5 months post-infection, and healthy age and sex-matched controls (n = 59). Data represent individual values, mean (centre bar). Statistical analysis by two-sided Mann–Whitney nonparametric test
Fig. 2
Fig. 2
CD4 T cell distribution post-COVID-19 infection. Comparison of the systemic percentage of (A) CD4 T cells; B Naïve CD4 T cells; C Total memory CD4 T cells; D Central memory CD4 T cells; E Effector memory CD4 T cells (F) EMRA CD4 T cells. PBMCs were isolated from convalescent COVID-19 patients who had mild (n = 15), moderate (n = 29) and severe (n = 55) disease 3–5 months post-infection, and healthy age and sex-matched controls (n = 59). Data represent individual values, mean (centre bar). Statistical analysis by two-sided Mann–Whitney nonparametric test
Fig. 3
Fig. 3
CD8 T cell senescence and exhaustion post-COVID-19 Comparison of systemic percentage of (A) CD28−ve CD57+ve senescent CD8 T cells in healthy age and sex-matched controls (n = 59) and mild (n = 15), moderate (n = 29) and severe (n = 55) COVID-19 survivors 3–5 months post-infection. B Frequency of KLRG1+ve senescent CD8 T cells in healthy age and sex-matched controls (n = 51) and mild (n = 15), moderate (n = 24) and severe (n = 46) COVID-19 survivors 3–5 months post-infection. C percentage and (D) absolute numbers of PD1+ve exhausted CD8 T cells in healthy age and sex-matched controls (n = 33) and severe (n = 38) COVID-19 survivors 3–5 months post-infection. Statistical analysis by two-sided Mann–Whitney non-parametric test. If not indicated p-valueue is not significant
Fig. 4
Fig. 4
The impact of COVID-19 on Regulatory T cells and Th17 cells. A Comparison of systemic percentage of Foxp3+ve CD4 T cells in healthy age and sex-matched controls (n = 59) and mild (n = 15), moderate (n = 29) and severe (n = 55) COVID-19 survivors 3 months post-infection. B Representative flow cytometry plot showing Foxp3+ve regulatory T cells in a healthy control and severe convalescent COVID-19 patients. C Comparison of systemic percentage of RORγt+ve CD4 T cells in healthy age and sex-matched controls (n = 59) and mild (n = 15), moderate (n = 29) and severe (n = 55) COVID-19 survivors 3–5 months post-infection. D Representative flow cytometry plot showing RORγt+ve Th17 cells in a healthy control and severe convalescent COVID-19 patient. E Th17/Treg ratio in healthy age and sex-matched controls (n = 59) and mild (n = 15), moderate (n = 29) and severe (n = 55) COVID-19 survivors 3–5 months post-infection. Statistical analysis by two-sided Mann–Whitney non-parametric test. If not indicated, p value is not significant
Fig. 5
Fig. 5
B cell subset distribution post-COVID-19. A Gating strategy used to analyse subsets within CD19+ve B cells; naïve (CD27−ve); memory (CD27+ve), regulatory B cells (CD38hiCD24hi) and plasma cells (CD24−veCD38+ve) B cells. B Comparison of systemic percentage of total B cells in healthy age and sex-matched controls (n = 59) and mild (n = 15), moderate (n = 29) and severe (n = 55) COVID-19 survivors 3–5 months post-infection. C Absolute numbers of B cells in healthy age and sex matched controls (n = 39), moderate (n = 14) and severe (n = 46) COVID-19 convalescent patients. Comparison of systemic percentage of (D) memory B cells, (E) Plasma cells, (F) regulatory B cells in healthy age and sex-matched controls (n = 59) and mild (n = 15), moderate (n = 29) and severe (n = 55) COVID-19 survivors 3–5 months post-infection. Statistical analysis by two-sided Mann–Whitney non-parametric test. If not indicated, p-value is not significant
Fig. 6
Fig. 6
NK cells in severe COVID-19 convalescent patients. A Comparison of the systemic percentage of total NK cells in healthy age and sex-matched controls (n = 59) and mild (n = 15), moderate (n = 29) and severe (n = 55) COVID-19 survivors 3–5 months post-infection. B Absolute numbers of NK cells in healthy age and sex matched controls (n = 39), moderate (n = 14) and severe (n = 46) COVID-19 convalescent patients. C Comparison of the systemic percentage of CD56dim cytotoxic NK cells in healthy age and sex-matched controls (n = 59) and mild (n = 15), moderate (n = 29) and severe (n = 55) COVID-19 survivors 3–5 months post-infection. D, E Comparison of the systemic percentage of senescent NK cells in CD56 dim NK cell pool healthy age and sex-matched controls (n = 59) and mild (n = 15), moderate (n = 29) and severe (n = 55) COVID-19 survivors 3–5 months post-infection (F) Granzyme B expression levels in NK cells in healthy age and sex-matched controls (n = 29) and severe (n = 31) COVID-19 convalescent patients. Statistical analysis by two-sided Mann–Whitney non-parametric test. If not indicated, p value is not significant
Fig. 7
Fig. 7
Immunological ageing score (IMM-AGE) and transcriptome signatures in severe COVID-19 convalescent patients. A IMM-AGE scores calculated by the pseudotime algorithm23 in healthy age and sex-matched controls (n = 39) and mild (n = 15), moderate (n = 33) and severe (n = 42) COVID-19 survivors 3–5 months post-infection. Statistical analysis by two-sided Mann–Whitney non-parametric test. If not indicated, p value is not significant. B (B) A heatmap showing the relative expression levels of a selection of significantly differentially expressed genes between the healthy control and severe COVID-19 groups. The gene IDs can be seen on the X axis. The figure legend colour corresponds to the relative expression levels of a given gene within a group. C An map plot showing the relationships between the pathways associated with the set of significantly differentially expressed genes between healthy control participants and survivors of severe covid-19 infection. Node size denotes the number of genes associated with a specific pathway, with increasing size reflecting a greater number, and colour reflects the adjust p-valuealue

References

    1. Long QX, Tang XJ, Shi QL, Li Q, Deng H-J, Yuan J, et al. Clinical and immunological assessment of asymptomatic SARS-CoV2 infections. Nat Med. 2020;26(8):1200–1204. doi: 10.1038/s41591-020-0965-6. - DOI - PubMed
    1. Starke KR, Reissig D, Petereit-Haack G, Schmauder S, Nienhaus A, Seidler A. The isolated effect of age on the risk of COVID-19 severe outcomes: a systematic review with meta-analysis. BMJ Glob Health. 2021;6(12):e006434. doi: 10.1136/bmjgh-2021-006434. - DOI - PMC - PubMed
    1. Fleming DM, Elliot AJ. The impact of Influenza on the health and health care utilisation of elderly people. Vaccine. 2005;23:S1–S9. doi: 10.1016/j.vaccine.2005.04.018. - DOI - PubMed
    1. The PHOSP-COVID Collaborative Group Clinical characteristics with inflammation profiling of Long-COVID and association with one-year recovery following hospitalisation in the UK: a prospective observational study. Lancet Resp Med. 2022;10(8):761–775. doi: 10.1016/s2213-2600(22)00127-8. - DOI - PMC - PubMed
    1. Richter AG, Shields AM, Karim A, Birch D, Faustini SE, Steadman L, et al. Establishing the prevalence of common tissue-specific autoantibodies following severe acute respiratory syndrome coronavirus 2 infection. Clin Exp Immunol. 2021;205(2):99–105. doi: 10.1111/cei.13623. - DOI - PMC - PubMed