

Specific-cytokine associations with outcomes in knee osteoarthritis subgroups: breaking down disease heterogeneity with phenotyping
- PMID: 38212829
- PMCID: PMC10782658
- DOI: 10.1186/s13075-023-03244-y
Specific-cytokine associations with outcomes in knee osteoarthritis subgroups: breaking down disease heterogeneity with phenotyping
Abstract
Background: Despite existing extensive literature, a comprehensive and clinically relevant classification system for osteoarthritis (OA) has yet to be established. In this study, we aimed to further characterize four knee OA (KOA) inflammatory phenotypes (KOIP) recently proposed by our group, by identifying the inflammatory factors associated with KOA severity and progression in a phenotype-specific manner.
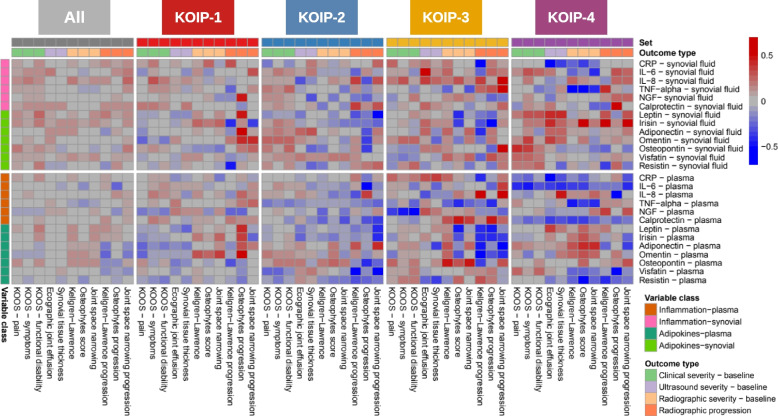
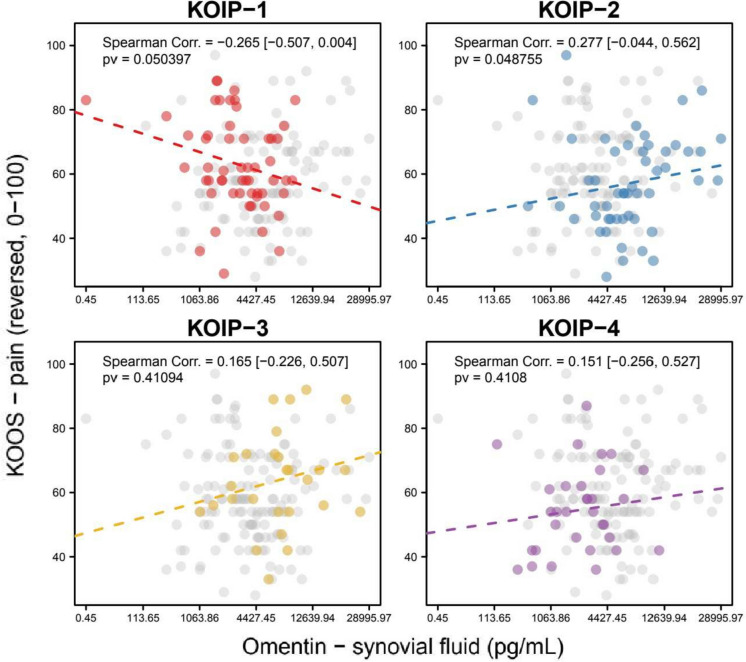
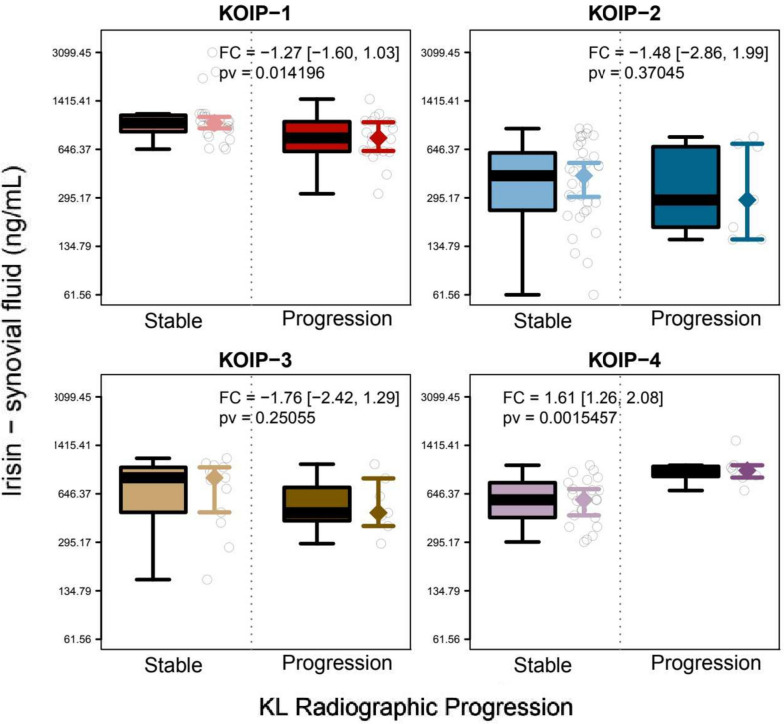
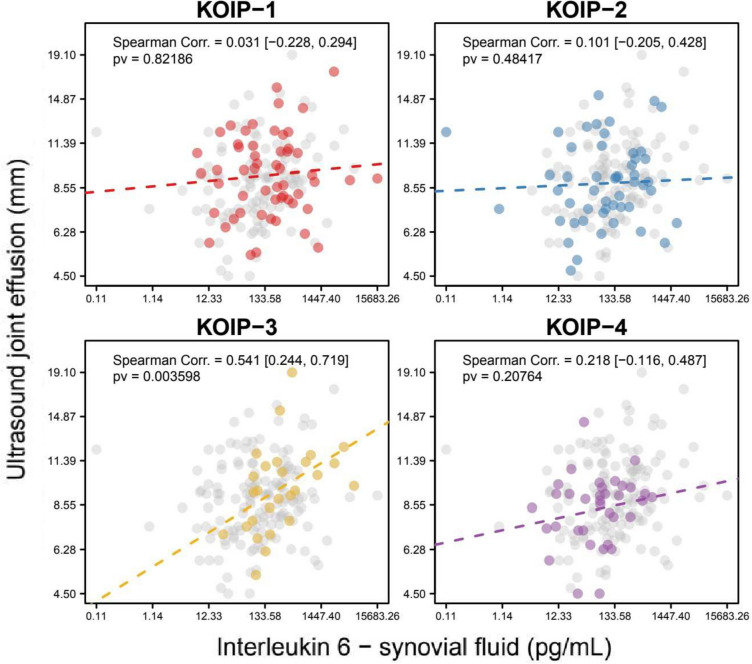
Methods: We performed an analysis within each of the previously defined four KOIP groups, to assess the association between KOA severity and progression and a panel of 13 cytokines evaluated in the plasma and synovial fluid of our cohort's patients. The cohort included 168 symptomatic female KOA patients with persistent joint effusion.
Results: Overall, our analyses showed that associations with KOA outcomes were of higher magnitude within the KOIP groups than for the overall patient series (all p-values < 1.30e-16) and that several of the cytokines showed a KOIP-specific behaviour regarding their associations with KOA outcomes.
Conclusion: Our study adds further evidence supporting KOA as a multifaceted syndrome composed of multiple phenotypes with differing pathophysiological pathways, providing an explanation for inconsistencies between previous studies focussed on the role of cytokines in OA and the lack of translational results to date. Our findings also highlight the potential clinical benefits of accurately phenotyping KOA patients, including improved patient stratification, tailored therapies, and the discovery of novel treatments.
Keywords: Clinical severity; Cytokines; Inflammation; Knee osteoarthritis; Machine learning; Phenotype; Radiographic progression.
© 2024. The Author(s).
Conflict of interest statement
The authors declare that they have no competing interests.
Figures
Similar articles
-
Metabolic and inflammatory profiles define phenotypes with clinical relevance in female knee osteoarthritis patients with joint effusion.Rheumatology (Oxford). 2023 Dec 1;62(12):3875-3885. doi: 10.1093/rheumatology/kead135. Rheumatology (Oxford). 2023. PMID: 36944271 Free PMC article.
-
Synovial fluid but not plasma interleukin-8 is associated with clinical severity and inflammatory markers in knee osteoarthritis women with joint effusion.Sci Rep. 2021 Mar 4;11(1):5258. doi: 10.1038/s41598-021-84582-2. Sci Rep. 2021. PMID: 33664374 Free PMC article.
-
Levels of neuropeptide Y in synovial fluid relate to pain in patients with knee osteoarthritis.BMC Musculoskelet Disord. 2014 Sep 27;15:319. doi: 10.1186/1471-2474-15-319. BMC Musculoskelet Disord. 2014. PMID: 25262001 Free PMC article.
-
Effects of exercise therapy on knee joint function and synovial fluid cytokine levels in patients with knee osteoarthritis.Mol Med Rep. 2013 Jan;7(1):183-6. doi: 10.3892/mmr.2012.1168. Epub 2012 Nov 7. Mol Med Rep. 2013. PMID: 23135204
-
Trabecular bone texture analysis of conventional radiographs in the assessment of knee osteoarthritis: review and viewpoint.Arthritis Res Ther. 2021 Aug 6;23(1):208. doi: 10.1186/s13075-021-02594-9. Arthritis Res Ther. 2021. PMID: 34362427 Free PMC article. Review.
Cited by
-
Effects of Blood-Flow Restricted Resistance Exercise Versus Neuromuscular Exercise on Mechanical Muscle Function in Adults With Chronic Knee Osteoarthritis-A Secondary Analysis From a Randomized Controlled Trial.Scand J Med Sci Sports. 2025 May;35(5):e70069. doi: 10.1111/sms.70069. Scand J Med Sci Sports. 2025. PMID: 40375440 Free PMC article. Clinical Trial.
-
Irisin in the modulation of bone and cartilage homeostasis: a review on osteoarthritis relief potential.Front Physiol. 2025 Apr 17;16:1570157. doi: 10.3389/fphys.2025.1570157. eCollection 2025. Front Physiol. 2025. PMID: 40313878 Free PMC article. Review.
-
Phenotypic Classification and Functional Assessment in Knee Osteoarthritis Patients.Curr Health Sci J. 2024 Apr-Jun;50(2):299-309. doi: 10.12865/CHSJ.50.02.16. Epub 2024 Jun 30. Curr Health Sci J. 2024. PMID: 39371052 Free PMC article.
-
The Mechanism by Which Estrogen Level Affects Knee Osteoarthritis Pain in Perimenopause and Non-Pharmacological Measures.Int J Mol Sci. 2025 Mar 7;26(6):2391. doi: 10.3390/ijms26062391. Int J Mol Sci. 2025. PMID: 40141035 Free PMC article. Review.
References
Publication types
MeSH terms
Grants and funding
LinkOut - more resources
Full Text Sources
