. 2024 Feb 7;32(2):440-456.
doi: 10.1016/j.ymthe.2024.01.006. Epub 2024 Jan 11.

Genetically modified ZIKA virus as a microRNA-sensitive oncolytic virus against central nervous system tumors

Affiliations

Genetically modified ZIKA virus as a microRNA-sensitive oncolytic virus against central nervous system tumors

Gabriela Machado Novaes et al. Mol Ther. .

Abstract

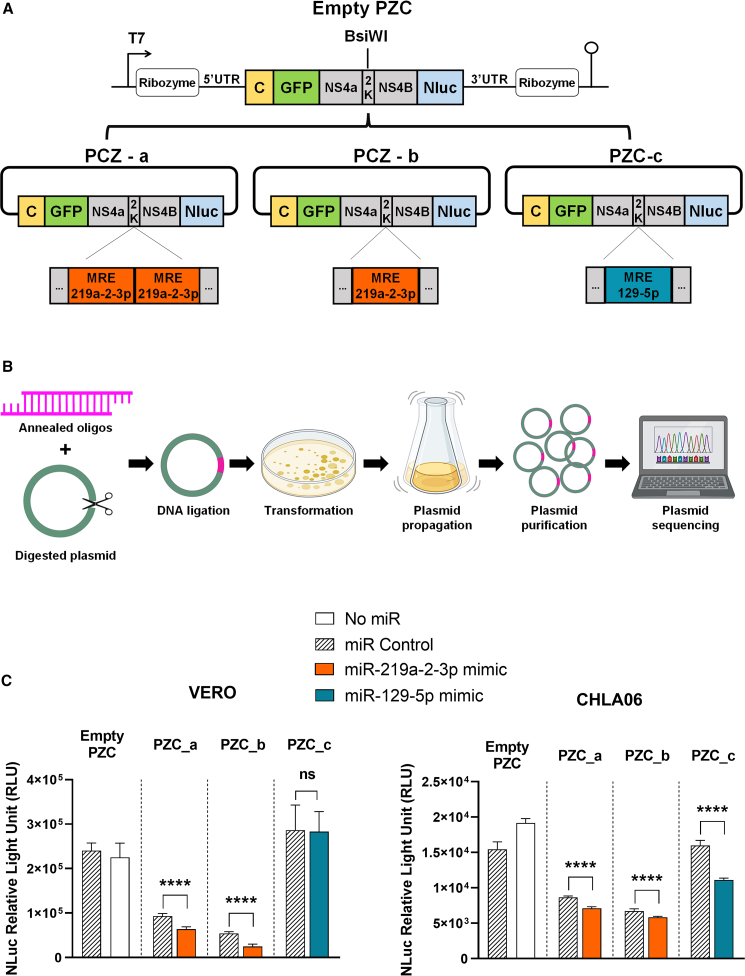
Here we introduce a first-in-class microRNA-sensitive oncolytic Zika virus (ZIKV) for virotherapy application against central nervous system (CNS) tumors. The described methodology produced two synthetic modified ZIKV strains that are safe in normal cells, including neural stem cells, while preserving brain tropism and oncolytic effects in tumor cells. The microRNA-sensitive ZIKV introduces genetic modifications in two different virus sites: first, in the established 3'UTR region, and secondly, in the ZIKV protein coding sequence, demonstrating for the first time that the miRNA inhibition systems can be functional outside the UTR RNA sites. The total tumor remission in mice bearing human CNS tumors, including metastatic tumor growth, after intraventricular and systemic modified ZIKV administration, confirms the promise of this virotherapy as a novel agent against brain tumors-highly deadly diseases in urgent need of effective advanced therapies.

Keywords: AT/RT; Zika virus; cancer stem cell; central nervous system tumors; glioblastoma; immunotherapy; medulloblastoma; miRNA-sensitive oncolytic virus; oncolytic therapy; virus genetic engineering.


Conflict of interest statement

Declaration of interests C.K. and O.K.O. are co-founders and equity holders of Vyro Bio Inc. From February 1, 2022, C.K. has been the Chief Scientific Officer of Vyro Bio Inc and inventor on patent applications filed by Vyro Bio Inc. related to the ZIKV genetic engineering. From February 1, 2022, O.K.O. has been a member of the Board of Directors of Vyro Bio Inc. From January 31, 2023, H.B. has been a member of the Scientific Advisory Boards of Vyro Bio Inc. From October 18, 2021, G.M.N. has been an employee of Vyro Bio Inc. From January 11, 2022, T.P.S. has been an employee of Vyro Bio Inc. From January 30, 2022, C.Longo has been an employee of Vyro Bio Inc. From February 22, 2022, P.H.M. has been an employee of Vyro Bio Inc. From March 21, 2022, C.Lima has been an employee of Vyro Bio Inc. From May 10, 2022, D.G.M. has been an employee of Vyro Bio Inc. From August 19, 2022, G.G.O.O. has been an employee of Vyro Bio Inc.

Figures

None
Graphical abstract
Figure 1
Figure 1
miRNAs expression profile (A) In silico analysis of miRs (miR-219a-2-3p, miR-219a-5p, miR129-5p, and miR4298) in tumoral vs. non-tumoral samples based on a Database of Differentially Expressed miRNAs in Human Cancers (dbDEMC). (B) miR expression in healthy tissues based on TissueAtlas- Human miRNA Patterns database. (C) RT-PCR quantification of miR expression normalized to SNORD48 in tumoral (glioblastoma, medulloblastoma, AT/RT, and non-CNS tumors) and non-tumoral (human mesenchymal, monkey kidney, microglia, cerebral microvessel, and neural progenitor cell line from lonza: NPC) cell lines. Cells indicated with ∗ were evaluated only for miRs miR-219a-2-3p and miR129-5p. Each dot represents one biological replicate, and horizontal lines indicate the mean of data in each group (n = 3). (D) RT-PCR quantification of miRs expression normalized to SNORD48 in neural progenitor cells derived from human iPS isolated from a patient with Congenital ZIKA Syndrome (763-1) and control (CH/C2) growing as neurosphere (NE) and 2D culture (ad). Each bar represents one biological replicate plotted with mean and standard deviation (n = 3). Significance determined by one-way ANOVA Tukey’s multiple-comparison test. ∗∗∗∗p < 0.0001, ∗p < 0.05.
Figure 2
Figure 2
PZC design and MRE validation at the protein level (A) Representative image of a non-replicative viral vector model (PZC) construct containing two ribozymes, ZIKV partial capsid sequence (yellow), GFP (green), non-structural ZIKV partial sequence (gray), Nluc (blue), and de MRE designed for miR-129-5p (blue) and miR-219a-2-3p (orange). (B) Schematic representation of MRE oligos cloning strategy detailed in the methods section. (C) Nluc quantification in PZC containing different MREs (PZC_a: miR-219a-2-3p with two MRE copies; PZC_b: miR-219a-2-3p with one copy of MRE; PZC_c: miR-129-5p) after corresponding miRNA overexpression in Vero (left) and CHLA-06-AT/RT (right) cell line. Each bar represents one biological replicate plotted with mean and standard deviation (n = 3). Significance determined by one-way ANOVA Tukey’s multiple-comparison test. ∗∗∗∗p < 0.0001.
Figure 3
Figure 3
miRNA-sensitive synthetic ZIKV generation (A) Representative image of the synthetic microRNA-sensitive oZIKV constructs (oZIKV_2k and oZIKV_3′) highlighting the insertion of MRE at 3′UTR and 2k. (B) Schematic representation of synthetic microRNA-sensitive oZIKV generation process. (C) Representative images of Vero cell after oZIKV_2k and oZIKV_3′ infection at 1, 3, and 6 days post-infection (dpi). Bar scale of 1,000 μm. (D) Virus titer of culture supernatant after oZIKV_2k and oZIKV_3′ active virus production and harvest. The viral RNA copy was quantified by RT-PCR (left). Each bar represents one biological replicate plotted with mean and standard deviation (n = 3). The active virus was quantified by PFU (right).
Figure 4
Figure 4
miRNA inhibition mechanism at oZIKV (A) Schematic representation of miRNA inhibition mechanism test in the modified oncolytic virus. Briefly, the corresponding miRNA was previously overexpressed in the cell line infected with miRNA-sensitive oZIKV, leading to virus RNA degradation after miRNA binding, consequently increasing cell viability. (B and C) Cell viability assay in CHLA06 (B) and Daoy (C) cell lines submitted to transient transfection with miR-129-5p or miRNA control. Twenty-four hours after transfection, the cells were infected with oZIKV_3′ at MOI 1 for CHLA06 and MOI 0.1 for Daoy. The cell viability was analyzed 5 days after infection. (D and E) Cell viability assay in CHLA06 (D) and Daoy (E) cell lines transiently transfected with miR-219a-2-3p or miRNA control. For (B), (C), (D), and (E), 24 h after transient transfection, the cells were infected with the corresponding miRNA-sensitive oZIKV (oZIKV_3′ for B and C; oZIKV_2k for D and E) at MOI 1 for CHLA and MOI 0.1 for Daoy. The cell viability was analyzed 5 days after infection. Each bar represents one biological replicate plotted with mean and standard deviation (n = 5). Significance determined by one-way ANOVA Tukey’s multiple-comparison test. ∗∗∗∗p < 0.0001, ∗∗∗p < 0.001, ∗∗p < 0.01, ∗p < 0.05.
Figure 5
Figure 5
In vitro cytotoxicity effect of oZIKV_2k and oZIKV_3′ In (A)–(C), we report the oncolytic effect of oZIKV_2k, oZIKV_3′, and wild-type ZIKV at MOIs 5 and 1.667 in embryonal CNS tumor (A), glioblastoma (B), and other tumoral (C) cell lines by cell viability assessed 3 days after oZIKV_2k, oZIKV_3′, and wild-type ZIKV infection. For (A)–(C), each bar represents one biological replicate plotted with mean and standard deviation (n = 5). Significant difference among means was determined by one-way ANOVA Tukey’s multiple-comparison test. a = p < 0.0001 when compared with the Mock and ∗∗∗∗p < 0.0001, ∗∗p < 0.01, and ∗p < 0.05 when all groups were compared with all groups.
Figure 6
Figure 6
In vitro safety of oZIKV_2k and oZIKV_3′ In (A), the viability at 3 DPI of non-tumoral cells hCMEC and HMC3 after oZIKV_2k, oZIKV_3′, and wild-type ZIKV infection. Each bar represents one biological replicate plotted with mean and standard deviation (n = 5). Significant difference among means was determined by one-way ANOVA Tukey’s multiple-comparison test. a = p < 0.0001 when compared with the Mock and ∗∗∗∗p < 0.0001, ∗∗p < 0.01, and ∗p < 0.05 when all groups were compared with all groups. In (B) and (C), viral RNA copy quantification by RT-PCR of non-tumoral culture supernatant 3 days after oZIKV_2k, oZIKV_3′ and wild-type ZIKV infection. Each bar represents one biological replicate plotted with mean and standard deviation (n = 3). In (D), representative images of NPC neurosphere formation 5 days after oZIKV_2k, oZIKV_3′, and wild-type ZIKV infection at MOI 0.01. NPCs were differentiated for human iPS isolated from a patient with Congenital ZIKA Syndrome. Scale bar, 1000 μm. In (E) and (F), the neurosphere perimeter and area were quantified using the ImageJ program. Each bar represents one biological replicate plotted with mean and standard deviation (n of spheres = 100). (G) Viral RNA copy quantification by RT-PCR of neurosphere culture supernatant 5 days after oZIKV_2k, oZIKV_3′, and wild-type ZIKV infection. Each bar represents one biological replicate plotted with mean and standard deviation (n = 3). In (H), endogenous expression of miR-219a-2-3p and miR129-5p in non-tumoral (microglia, cerebral microvessel, and NPC) cell lines. Expression was normalized to SNORD48. Each bar represents one biological replicate plotted with mean and standard deviation (n = 3). In (I), apoptosis and (J), necrosis at 3DPI MOI 0.01 of non-tumoral cells hCMEC and HMC3 and tumoral cell USP07 as positive control of death after oZIKV_2k, oZIKV_3′, and wild-type ZIKV infection. Each bar represents one biological replicate plotted with mean and standard deviation (n = 4). (K) The normalized expression (GAPDH) of IFNB1 in HMC3 cell line. Each bar represents one biological replicate plotted with mean and standard deviation (n = 3). For (A)–(F) and (H)–(K), significance was determined by one-way ANOVA Tukey’s multiple-comparison test. ∗∗∗∗p < 0.0001, ∗∗∗p < 0.001, ∗∗p < 0.01 ∗p < 0.05.
Figure 7
Figure 7
In vivo safety and tumor remission (A) Schematic representation of the in vivo experimental layout with a single intracerebroventricular virus administration at mice bearing intracranial human CNS tumor (USP7) used for (B), (C), and (D) data. (B) Representative bioluminescence-based images of tumor development in control (n = 5), wild-type ZIKV (n = 4), and oZIKV_2k (n = 6) treated mice. (C and F) Mice percentage presenting macrocephaly, ataxic, weight loss, lethargic and dead, during the time in days, after intracranial treatment (C) or systemic treatment (F) of control, wild-type ZIKV, and oZIKV_2k. (D and G), Overall survival rates of tumor-bearing mice after intracranial treatment (D) or systemic treatment (G). Significance determined by log rank Mantel–Cox test. ∗∗p < 0.01, ∗p < 0.05 ∗p < 0.05. (E) Schematic representation of the in vivo experimental layout with three systemic virus administrations on mice bearing intracranial human CNS tumor (USP7) used for (F) and (G) data.
Figure 8
Figure 8
Histological images of brain tumor tissue Brain histopathology of tumor-bearing mice after intracranial treatment (B, D–E, and K) or systemic treatment (C, G–J, and L). In (A), coronal view of mouse brain showing the location of the coronal cut sections bregma 0.50 mm. Atlas templates were adapted from Paxinos and Watson (1998). In (B) and (C), representative images of hematoxylin and eosin-stained xenograft tumors. The black arrows indicate tumors in the different brain regions of mice. Scale bar, 50 μm. In (D)–(J), tissues show immunofluorescence labeling for NS2-ZIKV (red) and nuclei DAPI (blue). Scale bar, 50 μm. (D), (G), and (H) are the control groups. In (H), non-tumoral tissue is delineated by a dotted white line, while the tumoral tissue, characterized by a high density of large nuclei, is demarcated by a dotted red line. (E'), (F'), (I'), and (J') show non-tumoral tissue zoom from the white dotted square of (E), (F), (I), and (J). (E''), (F''), (I''), and (J'') show the tumoral tissue zoom from the red dotted square of (E), (F), (I), and (J). Scale bar, 25 μm. In (K) and (L), cell death staining by TUNEL assay (green), and nuclei DAPI (blue). In (K), scale bar, 20 μm. In (L), scale bar, 40 μm.

References

    1. Russell S.J., Peng K.W., Bell J.C. Oncolytic virotherapy. Nat. Biotechnol. 2012;30:658–670. - PMC - PubMed
    1. Khatua S., Sadighi Z.S., Pearlman M.L., Bochare S., Vats T.S. Brain tumors in children--current therapies and newer directions. Indian J. Pediatr. 2012;79:922–927. - PubMed
    1. Todo T., Martuza R.L., Rabkin S.D., Johnson P.A. Oncolytic herpes simplex virus vector with enhanced MHC class I presentation and tumor cell killing. Proc. Natl. Acad. Sci. USA. 2001;98:6396–6401. - PMC - PubMed
    1. Shalhout S.Z., Miller D.M., Emerick K.S., Kaufman H.L. Therapy with oncolytic viruses: progress and challenges. Nat. Rev. Clin. Oncol. 2023;20:160–177. - PubMed
    1. Todo T., Ito H., Ino Y., Ohtsu H., Ota Y., Shibahara J., Tanaka M. Intratumoral oncolytic herpes virus G47Δ for residual or recurrent glioblastoma: a phase 2 trial. Nat. Med. 2022;28:1630–1639. - PMC - PubMed

LinkOut - more resources