. 2024 Mar 6;226(3):iyae005.
doi: 10.1093/genetics/iyae005.

Dynein directs prophase centrosome migration to control the stem cell division axis in the developing Caenorhabditis elegans epidermis

Affiliations

Dynein directs prophase centrosome migration to control the stem cell division axis in the developing Caenorhabditis elegans epidermis

Cátia Carvalho et al. Genetics. .

Abstract

The microtubule motor dynein is critical for the assembly and positioning of mitotic spindles. In Caenorhabditis elegans, these dynein functions have been extensively studied in the early embryo but remain poorly explored in other developmental contexts. Here, we use a hypomorphic dynein mutant to investigate the motor's contribution to asymmetric stem cell-like divisions in the larval epidermis. Live imaging of seam cell divisions that precede formation of the seam syncytium shows that mutant cells properly assemble but frequently misorient their spindle. Misoriented divisions misplace daughter cells from the seam cell row, generate anucleate compartments due to aberrant cytokinesis, and disrupt asymmetric cell fate inheritance. Consequently, the seam becomes disorganized and populated with extra cells that have lost seam identity, leading to fatal epidermal rupture. We show that dynein orients the spindle through the cortical GOA-1Gα-LIN-5NuMA pathway by directing the migration of prophase centrosomes along the anterior-posterior axis. Spindle misorientation in the dynein mutant can be partially rescued by elongating cells, implying that dynein-dependent force generation and cell shape jointly promote correct asymmetric division of epithelial stem cells.

Keywords: Caenorhabditis elegans; LIN-5; dynein; epidermis; spindle orientation; stem cells.


Conflict of interest statement

Conflicts of interest The authors declare no conflicts of interest.

Figures

Fig. 1.
Fig. 1.
An N-terminal deletion mutant of C. elegans dynein IC results in premature death by epidermal rupture. a) Schematic of the dyci-1 locus and N-terminal deletion mutants. b) Animal length, measured 48 h after release from L1 arrest. Data points correspond to measurements in individual animals. n denotes the number of animals examined. Bars show mean ± 95% CI. Statistical significance was determined by the Mann–Whitney test. ****P < 0.0001. c) Lifespan analysis after release from L1 arrest. n denotes the number of animals examined. d) Images of animals on a plate with bacteria, 120 h after release from L1 arrest. Arrows point to adults that died by spontaneous epidermal rupture. Scale bar, 0.2 mm.
Fig. 2.
Fig. 2.
The dyci-1(ΔN) mutation compromises epidermal seam integrity. a) Left: Schematic illustrating that the membrane-permeable dye Hoechst 33342 stains epidermal nuclei if the barrier function of the cuticle is compromised. Right: DIC and corresponding fluorescence images after Hoechst 33342 staining. Asterisk marks intestinal autofluorescence. Scale bar, 30 µm. b) Quantification of epidermal permeability using the assay shown in a). n denotes the number of animals examined. c) Lifespan analysis after release from L1 arrest. n denotes the number of animals examined. d) Top: Schematic showing apical junctions in the late L4 epidermis, which connect the syncytial hyp7 cell with the lateral seam syncytium. Bottom: Fluorescence images of late L4 animals expressing the apical junction marker DLG-1::GFP. e) Quantification of seam discontinuities based on images as shown in d). n denotes the number of animals examined.
Fig. 3.
Fig. 3.
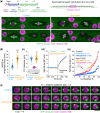
The dyci-1(ΔN) mutation results in spindle misorientation during asymmetric seam cell division. a) Top left: Schematic of the experimental procedure followed for live imaging experiments. Top right: Schematic showing the epidermal region imaged in subsequent experiments. Bottom: Selected images from time-lapse movies of dividing seam cells coexpressing GFP::TBB-2 (β-tubulin) and mCh::HIS-11 (histone H2B). Time is indicated in minutes. Scale bar, 5 µm. b)–e) Quantification of seam cell mitosis. Data points in b), c), and e) correspond to measurements in individual cells. Bars in b)–d) show the mean ± 95% CI. n denotes the total number of cells imaged in ≥20 animals. Statistical significance was determined by the Mann–Whitney test. ****P < 0.0001; ns = not significant, P > 0.05. f) Successive frames (1 min apart) from time-lapse movies of cells as in a). Two examples are shown for the dyci-1(ΔN) mutant. Scale bar, 5 µm.
Fig. 4.
Fig. 4.
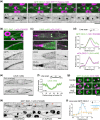
Dynein acts at the seam cell cortex downstream of LIN-5NuMA. a) Selected images from a time-lapse movie in a dividing seam cell coexpressing GFP::DHC-1 (dynein HC), mCh::PH(PLC1δ1), and mCh::HIS-11 (histone H2B). Time is indicated in minutes. Scale bar, 5 µm. b) Image of a cortical region in a prophase seam cell as in a). Scale bars, 5 µm (top) and 2 µm (magnified region). c) Image of a prophase seam cell coexpressing LIN-5::mNG and mCh::DHC-1. Scale bars, 5 µm (top) and 2 µm (magnified region). d) Line scan profiles across the seam cell cortex, as illustrated in the schematic (top), measured in images such as in b) and c). Data are plotted as mean ± SEM. n denotes the total number of cells examined in ≥5 animals. e) Single confocal z-section (z) images (0.5 µm apart) of the prophase seam cell in c). Scale bar, 5 µm. f) Line scan profile of LIN-5::mNG along the early prophase cell cortex, as indicated in the schematic (top), in cells such as in e). Data are plotted as mean ± SEM. n denotes the number of cells examined (1 cell per animal). g) Selected images from time-lapse movies of dividing seam cells coexpressing GFP::TBB-2 (β-tubulin) and mCh::HIS-11. Time is indicated in minutes. Scale bar, 5 µm. h) Images of metaphase seam cells coexpressing GFP::DHC-1, mCh::PH(PLC1δ1), and mCh::HIS-11. Arrows and arrowheads point to GFP::DHC-1 at the cortex and seam cell contacts, respectively. Scale bar, 5 µm. i) Line scan profiles across the seam cell cortex, as illustrated in the schematic (top), measured at metaphase in images such as in h). Dashed line indicates the peak of the mCh::PH(PLC1δ1) signal. Data are plotted as mean ± SEM with arbitrary units (A.U.) on the y-axis. n denotes the total number of cells examined in ≥10 animals. Statistical significance was determined by the Mann–Whitney test. ****P < 0.0001; ***P < 0.001, **P < 0.01.
Fig. 5.
Fig. 5.
GOA-1 is uniformly distributed on the seam cell cortex and is required for LIN-5NuMA recruitment, prophase centrosome separation, and spindle orientation. a) Image of adjacent seam cells in interphase (left) and prophase (right), coexpressing GOA-1 internally tagged with GFP, the plasma membrane marker mCh::PHPLC1δ1, and mCh::HIS-11 (histone H2B). The asterisk and arrowhead point to a neuronal cell body and neurite, respectively. Scale bar, 5 µm. b) Line scan profile of GOA-1::GFP along the early prophase cell cortex, as indicated in the schematic (top), in cells such as in a). Data are plotted as mean ± SEM. n denotes the number of cells examined (1 cell per animal). c) and e) Selected images from time-lapse movies of dividing seam cells expressing LIN-5::mNG (c) or coexpressing GFP::TBB-2 (β-tubulin) and mCh::HIS-11 (e). Time is indicated in minutes. The arrows in c) point to cortical LIN-5::mNG. Scale bars, 5 µm (c) and 2 µm (e). d) Line scan profiles across the seam cell cortex, as illustrated in the schematic (top), measured at metaphase in images such as in c). Data are plotted as mean ± SEM with A.U. on the y-axis. n denotes the total number of cells examined in ≥10 animals. Statistical significance was determined by the Mann–Whitney test. ****P < 0.0001; **P < 0.01. f) Quantification of centrosome–centrosome distance (mean ± 95% CI) at NEBD. Data points correspond to measurements in individual cells. n denotes the total number of cells imaged in ≥5 animals. Color scheme is the same as in e). Statistical significance was determined by the Mann–Whitney test. **P < 0.01. g) Quantification of seam cell spindle orientation, measured at metaphase. Data points correspond to measurements in individual cells. n denotes the total number of cells examined in ≥15 animals.
Fig. 6.
Fig. 6.
Misoriented divisions in the dyci-1(ΔN) seam result in misplaced daughter cells and anucleate membrane compartments. a) and d) Selected images from time-lapse movies of seam cells coexpressing GFP::PH(PLC1δ1) and GFP::HIS-11 (histone H2B). Projected confocal z-stacks (a) or single z-sections (1 µm apart) (d) are shown. The arrows in d) point to ingressing cleavage furrows. Time is indicated in minutes. Scale bar, 5 µm. b) Successive frames (30 s apart) from a time-lapse movie of cytokinesis in a seam cell coexpressing the cleavage furrow marker TagRFP::ANI-1Anillin, GFP::PH(PLC1δ1), and GFP::HIS-11. Single confocal z-sections (0.5 µm apart) of the cleavage furrow region are shown. Scale bar, 2 µm. c) Selected images from time-lapse movies of seam cells as in b). Arrows point to ingressing cleavage furrows. Time is indicated in minutes. Scale bar, 5 µm.
Fig. 7.
Fig. 7.
Misoriented divisions in the dyci-1(ΔN) seam result in incorrect APR-1APC inheritance and altered daughter cell fate. a) Schematic overview of asymmetric seam cell division at the L3/L4 molt and subsequent fate of anterior and posterior daughters. APR-1 is enriched on the anterior cortex. b) Selected images from time-lapse movies of seam cells coexpressing GFP::APR-1, mCh::PH(PLC1δ1), and mCh::HIS-11 (histone H2B). The arrow points to enrichment of GFP::APR-1 in the cleavage furrow. Time is indicated in minutes. Scale bar, 5 µm. c) Schematic describing the markers coexpressed in the cell fate reporter strain used in d) to f) and in Fig. 8. d) and e) Images of the L4 seam in the strain described in c). The arrow in d) points to a gap in the seam containing hypercondensed (apoptotic) chromatin. Asterisks in e) point to a seam-adjacent cell (mCh) that does not express the seam identity marker (GFP). Scale bars, 5 µm. f) Seam nuclei count in L4 animals using the markers described in c) and the criteria outlined in the schematics. n denotes the number of animals examined.
Fig. 8.
Fig. 8.
Elongating seam cells rescues spindle misorientation and extra nuclei number in the dyci-1(ΔN) seam. a) Schematic illustrating the effect of lon-1(e185) and dpy-11(e224) mutations on animal length. b) Quantification of the seam cell elongation factor at metaphase, calculated as shown in the schematic. Data points correspond to measurements in individual cells and bars show the mean ± 95% CI. n denotes the total number of cells examined in ≥10 animals. Statistical significance was determined by ordinary 1-way ANOVA followed by Šídák's multiple comparison test. ****P < 0.0001; *P < 0.05; ns = not significant, P > 0.05. c) and d) Quantification of seam cell spindle orientation, measured at metaphase. Data points correspond to measurements in individual cells. n denotes the total number of cells examined in ≥10 animals. e) Seam nuclei count in L4 animals using the markers described in Fig. 7c and the criteria outlined in the schematic. n denotes the number of animals examined.

Similar articles

References

    1. Arribere JA, Bell RT, Fu BXH, Artiles KL, Hartman PS, Fire AZ. 2014. Efficient marker-free recovery of custom genetic modifications with CRISPR/Cas9 in Caenorhabditis elegans. Genetics. 198(3):837–846. doi:10.1534/genetics.114.169730. - DOI - PMC - PubMed
    1. Barbosa DJ, Duro J, Prevo B, Cheerambathur DK, Carvalho AX, Gassmann R. 2017. Dynactin binding to tyrosinated microtubules promotes centrosome centration in C. elegans by enhancing dynein-mediated organelle transport. Plos Genet. 13(7):e1006941. doi:10.1371/journal.pgen.1006941. - DOI - PMC - PubMed
    1. Bergstralh DT, St Johnston D. 2014. Spindle orientation: what if it goes wrong? Semin Cell Dev Biol. 34:140–145. doi:10.1016/j.semcdb.2014.06.014. - DOI - PMC - PubMed
    1. Carter AP, Diamant AG, Urnavicius L. 2016. How dynein and dynactin transport cargos: a structural perspective. Curr Opin Struct Biol. 37:62–70. doi:10.1016/j.sbi.2015.12.003. - DOI - PubMed
    1. Celestino R, Henen MA, Gama JB, Carvalho C, McCabe M, Barbosa DJ, Born A, Nichols PJ, Carvalho AX, Gassmann R, et al. 2019. A transient helix in the disordered region of dynein light intermediate chain links the motor to structurally diverse adaptors for cargo transport. Plos Biol. 17(1):e3000100. doi:10.1371/journal.pbio.3000100. - DOI - PMC - PubMed

Publication types

LinkOut - more resources