. 2023 Dec 28:14:1297932.
doi: 10.3389/fimmu.2023.1297932. eCollection 2023.

Antigen presentation deficiency, mesenchymal differentiation, and resistance to immunotherapy in the murine syngeneic CT2A tumor model

Affiliations

Antigen presentation deficiency, mesenchymal differentiation, and resistance to immunotherapy in the murine syngeneic CT2A tumor model

J Bryan Iorgulescu et al. Front Immunol. .

Abstract

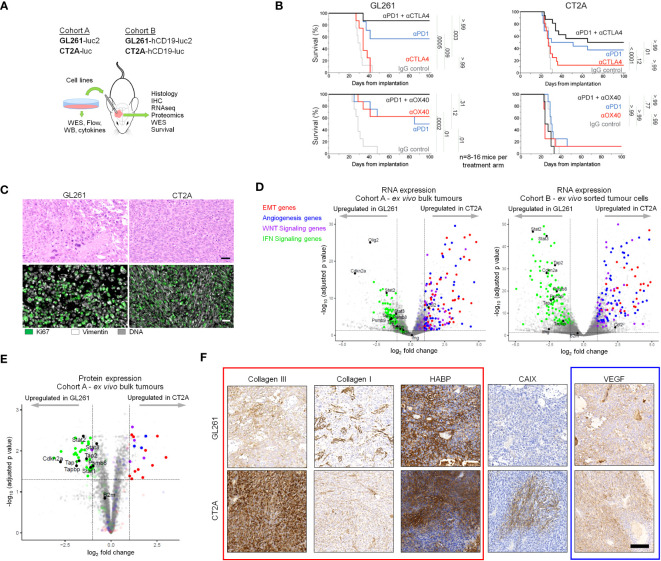
Background: The GL261 and CT2A syngeneic tumor lines are frequently used as immunocompetent orthotopic mouse models of human glioblastoma (huGBM) but demonstrate distinct differences in their responses to immunotherapy.

Methods: To decipher the cell-intrinsic mechanisms that drive immunotherapy resistance in CT2A-luc and to define the aspects of human cancer biology that these lines can best model, we systematically compared their characteristics using whole exome and transcriptome sequencing, and protein analysis through immunohistochemistry, Western blot, flow cytometry, immunopeptidomics, and phosphopeptidomics.

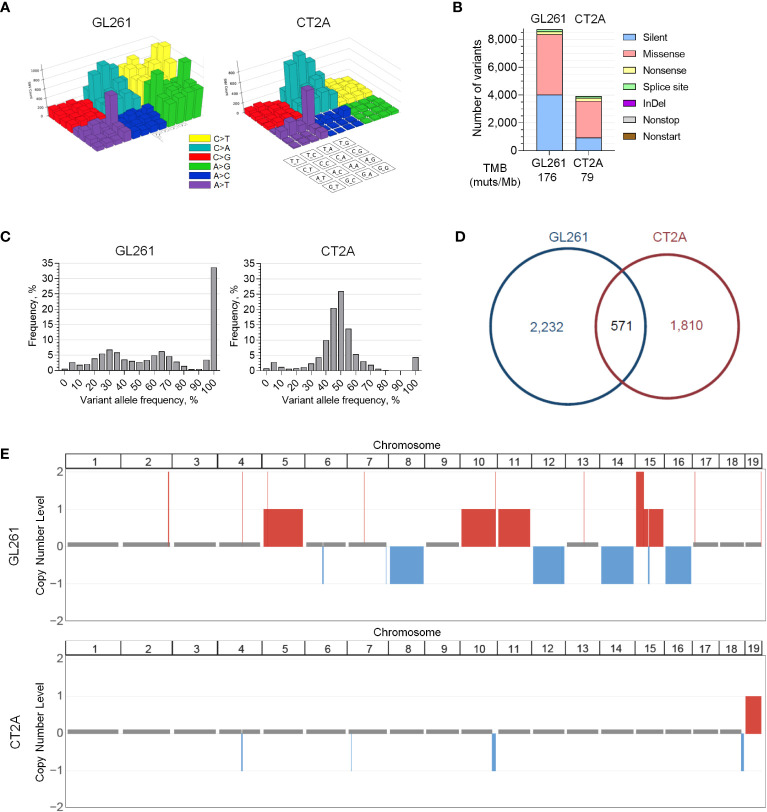
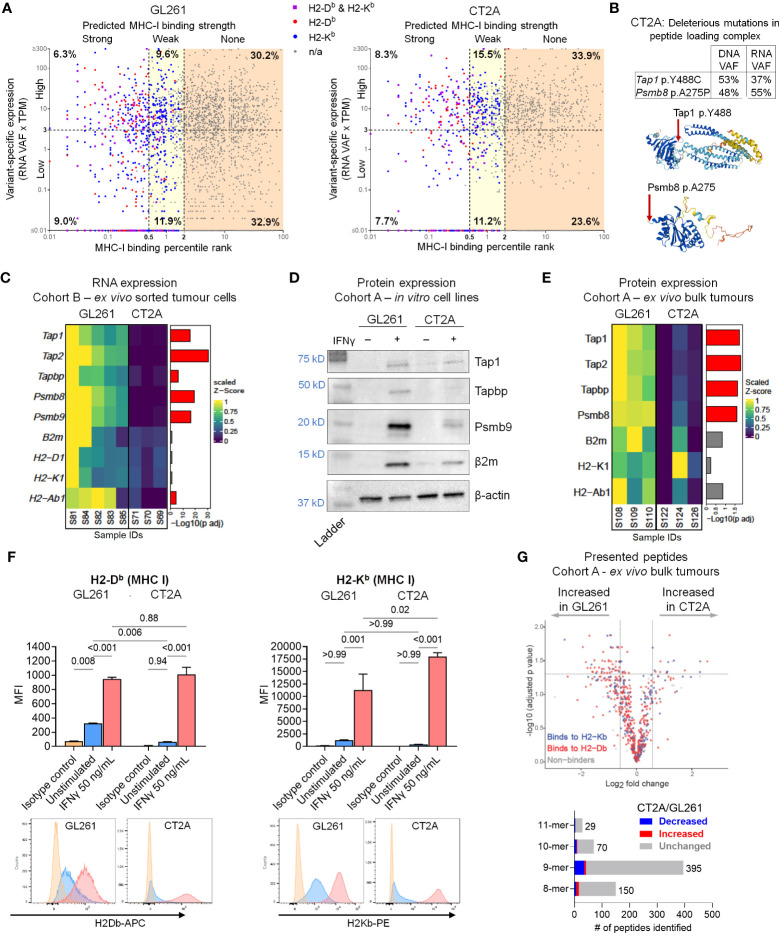
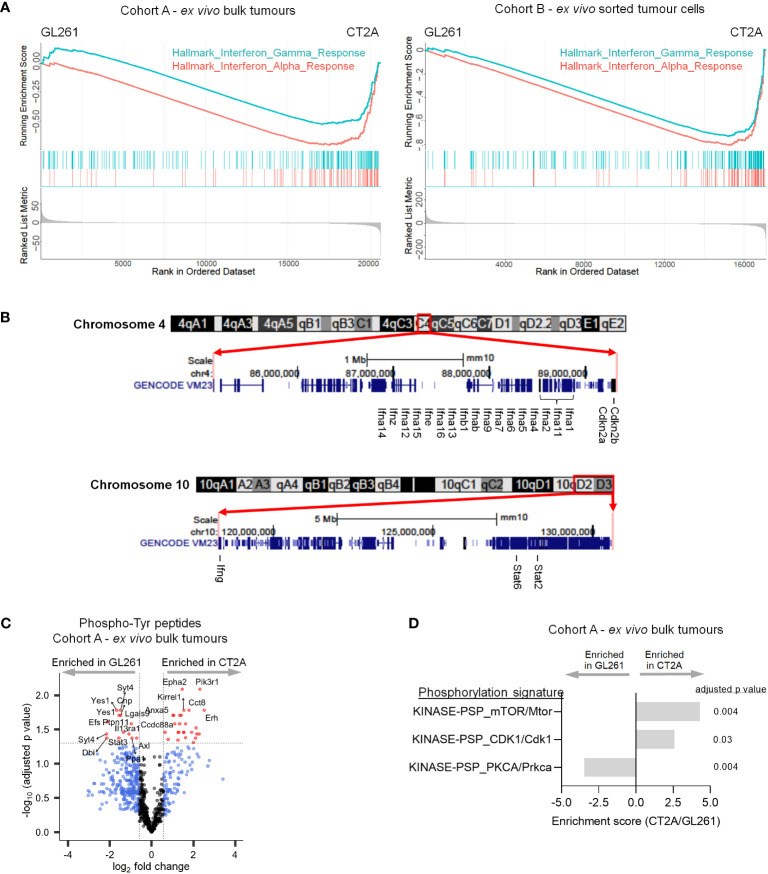
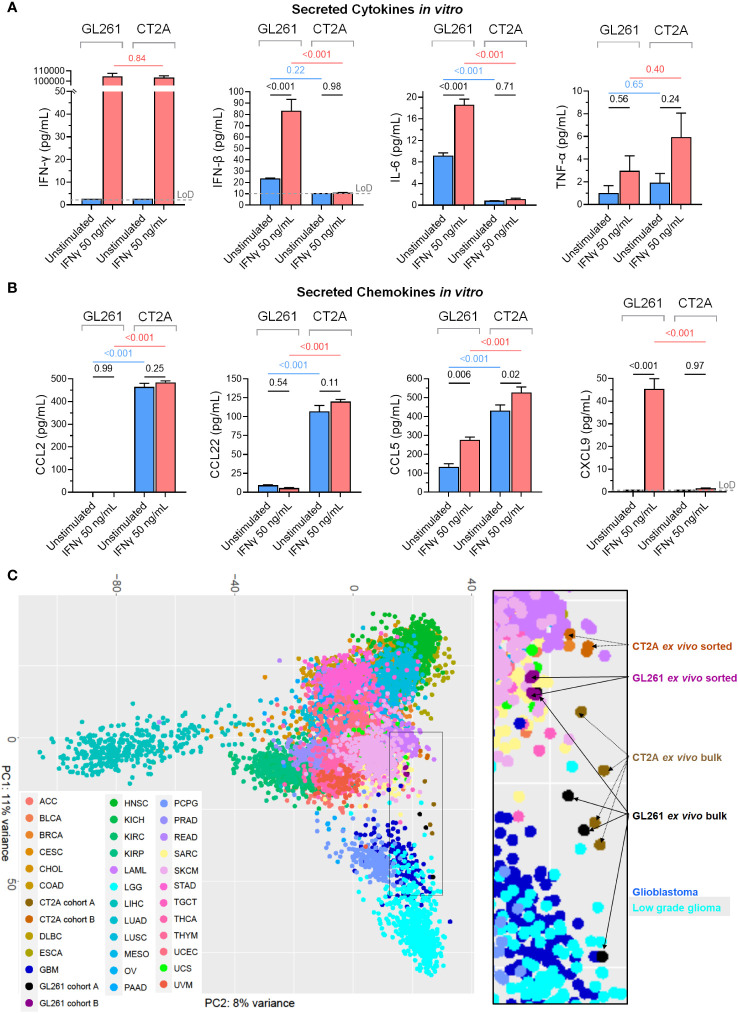
Results: The transcriptional profiles of GL261-luc2 and CT2A-luc tumors resembled those of some huGBMs, despite neither line sharing the essential genetic or histologic features of huGBM. Both models exhibited striking hypermutation, with clonal hotspot mutations in RAS genes (Kras p.G12C in GL261-luc2 and Nras p.Q61L in CT2A-luc). CT2A-luc distinctly displayed mesenchymal differentiation, upregulated angiogenesis, and multiple defects in antigen presentation machinery (e.g. Tap1 p.Y488C and Psmb8 p.A275P mutations) and interferon response pathways (e.g. copy number losses of loci including IFN genes and reduced phosphorylation of JAK/STAT pathway members). The defect in MHC class I expression could be overcome in CT2A-luc by interferon-γ treatment, which may underlie the modest efficacy of some immunotherapy combinations. Additionally, CT2A-luc demonstrated substantial baseline secretion of the CCL-2, CCL-5, and CCL-22 chemokines, which play important roles as myeloid chemoattractants.

Conclusion: Although the clinical contexts that can be modeled by GL261 and CT2A for huGBM are limited, CT2A may be an informative model of immunotherapy resistance due to its deficits in antigen presentation machinery and interferon response pathways.

Keywords: antigen presentation machinery; cancer; glioblastoma; immunotherapy; mesenchymal; mouse model; resistance.


Conflict of interest statement

MLS is equity holder, scientific co-founder, and advisory board member of Immunitas Therapeutics. EAC is an advisor to Amacathera, Bionaut Labs, Genenta, Inc., Insightec, Inc., DNAtrix Inc., Seneca Therapeutics, Synthetic Biologics. EAC has equity options in Bionaut Laboratories, DNAtrix, Immunomic Therapeutics, Seneca Therapeutics, Synthetic Biologics, Ternalys Therapeutics. EAC is co-founder and on the Board of Directors of Ternalys Therapeutics. EAC also is a named inventor on patents related to oncolytic HSV1 and noncoding RNAs. MCS has equity options and is a current employee of GSK. MN is a current employee of AbbVie. DN has stock ownership in Madrigal Pharmaceuticals. RJ received consultant fees from Cur, Elpis, Innocoll, SPARC, and SynDevRx,; owns equity in Accurius, Enlight, and SynDevRx; is on the Board of Trustees of Tekla Healthcare Investors, Tekla Life Sciences Investors, Tekla Healthcare Opportunities Fund, and Tekla World Healthcare Fund; and received a research grant from Boehringer Ingelheim. AS currently has funding from Quark, Merck, AbbVie, Moderna and Vertex unrelated to the submitted work. AS serves on advisory boards for Surface Oncology, SQZ Biotechnologies, Selecta, Elpiscience, Monopteros, Bicara, Fibrogen, and Alixis. AS also is on scientific advisory boards for the Massachusetts General Cancer Center, Program in Cellular and Molecular Medicine at Boston Children’s Hospital, the Human Oncology and Pathogenesis Program at Memorial Sloan Kettering Cancer Center, Glaxo Smith Kline and Janssen. AS is an academic editor for the Journal of Experimental Medicine. AS has patents/pending royalties on the PD-1 pathway from Roche and Novartis. GF has patents/pending royalties on the PD-L1/PD-1 pathway from Roche, Merck MSD, Bristol-Myers-Squibb, Merck KGA, Boehringer-Ingelheim, AstraZeneca, Dako, Leica, Mayo Clinic, Eli Lilly, and Novartis. GF has served on advisory boards for Roche, Bristol-Myers-Squibb, Origimed, Triursus, iTeos, NextPoint, IgM, Jubilant, Trillium, GV20, IOME, and Geode. GF has equity in Nextpoint, Triursus, Xios, iTeos, IgM, Trillium, Invaria, GV20, and Geode. CW is an equity holder of BioNTech, Inc. DR receives institutional support through Dana-Farber Cancer Institute from Acerta Phamaceuticals, Agenus, Bristol-Myers Squibb, Celldex, EMD Serono, Enterome, Epitopoietic Research Corporation, Incyte, Inovio, Insightec, Novartis, Omniox, and Tragara; and is an advisor/consultant for Abbvie, Advantagene, Agenus, Agios, Amgen, AnHeart Therapeutics, Avita Biomedical, Bayer, Boston Biomedical, Boehringer Ingelheim, Bristol-Myers Squibb, Celldex, Deciphera, Del Mar Pharma, DNAtrix, Ellipses Pharma, EMD Serono, Genenta, Genentech/Roche, Hoffman-LaRoche, Imvax, Inovio, Kintara, Kiyatec, Medicenna Biopharma, Merck, Merck KGaA, Monteris, Neuvogen, Novartis, Novocure, Oncorus, Oxigene, Regeneron, Stemline, Sumitono Dainippon Pharma, Pyramid, Taiho Oncology, Vivacitas Oncology, and Y-mabs Therapeutics. The remaining authors declare that the research was conducted in the absence of any commercial or financial relationships that could be construed as a potential conflict of interest.

Figures

Figure 1
Figure 1
GL261-luc2 and CT2A-luc exhibit distinct biologic behaviors, histologies, and transcriptional profiles. (A) Schematic of the experimental analyses. Cohort A consisted of in vitro and bulk ex vivo samples of GL261-luc2 and CT2A-luc. Cohort B consisted of GL261-hCD19-luc2 and CT2A-hCD19-luc, in which human CD19 expression permitted the ex vivo sorting of hCD19-positive tumor cells. WES, whole exome sequencing; WB, Western Blot; Flow, flow cytometry; IHC, immunohistochemistry. (B) Kaplan-Meier overall survival curves associated with checkpoint immunotherapy in intracranial GL261-luc2 (left) and CT2A-luc (right) tumor-bearing mice. Top: anti-PD-1 and/or anti-CTLA-4 treatment experiments. Bottom: anti-PD-1 and/or anti-OX40 treatment experiments. (n=8-16 mice per experimental arm). One mouse in the single-agent anti-PD-1 GL261-luc2 group from the anti-CTLA-4 experiment was excluded due to tumor-unrelated death (day 9) prior to completing treatment. Adjusted p values are displayed from pairwise logrank tests, using Bonferroni correction for the 5 comparisons in each experiment. A two-sided adjusted p<0.05 for each experiment was considered significant. Checkpoint immunotherapy and IgG control dosing are detailed in the Methods. (C) Representative hematoxylin & eosin histological (top) and immunofluorescent (bottom) staining of ex vivo GL261-luc2 and CT2A-luc tumors. Scale bars = 50 µm. (D) Left: Volcano plot displaying the genes that were differentially expressed in ex vivo CT2A-luc bulk tumors, as compared to GL261-luc2 (n=4 mice each). Right: Volcano plot displaying the genes that were differentially expressed in ex vivo CT2A-hCD19-luc sorted tumor cells, as compared to GL261-hCD19-luc2 (n=3-5 mice each). Cutoffs included |log2FoldChange| >1 and Benjamini-Hochberg FDR-adjusted p<0.05. (E) Volcano plot displaying the proteins that were differentially expressed in ex vivo CT2A-luc bulk tumors, as compared to GL261-luc2 (n=3 mice each). Cutoffs included |log2FoldChange| >1 and Benjamini-Hochberg FDR-adjusted p<0.05. (F) Representative immunohistochemical staining of collagen III, collagen I, hyaluronan-binding protein (HABP), vascular endothelial growth factor (VEGF), and carbonic anhydrase IX (CAIX) in ex vivo GL261-hCD19-luc2 (top) and CT2A-hCD19-luc (bottom) tumors. Scale bar = 100 µm.
Figure 2
Figure 2
Genomic profiles of GL261-luc2 and CT2A-luc. (A) Lego plots visualizing the patterns of all types of transversion and transition mutations detected in whole exome sequencing of in vitro GL261-luc2 and CT2A-luc cells. Both models exhibited the C>A/G>T and CAG>CTG/GTC>GAC mutations that have been associated with a methylcholanthrene-induced etiology. GL261-luc2 additionally showed high levels of A>G/T>C and C>T/G>A transitions. (B) Frequency of small somatic sequence variants (i.e., single nucleotide variants and small insertions/deletions [InDel]) by mutation type from whole exome sequencing of in vitro GL261-luc2 and CT2A-luc cells, with corresponding estimated tumor mutational burden (TMB). (C) Frequency of variants by variant allele fraction (VAF) from whole exome sequencing of in vitro GL261-luc2 and CT2A-luc cells. GL261-luc2 demonstrated an increased frequency of variants at 100% VAF (i.e., likely homozygous). (D) Pie chart depicting the overlap of genes that have sequence variants (VAF ≥ 20%) between in vitro GL261-luc2 and CT2A-luc cells. (E) Copy number analysis of in vitro GL261-luc2 (n=5) and CT2A-luc (n=2) samples displaying somatic chromosomal segments that were significantly gained (red) or lost (blue) as compared to diploid reference (GISTIC2.0 FDR-adjusted p<0.05).
Figure 3
Figure 3
Multifactorial defects in antigen processing and presentation machinery in CT2A-luc. (A) Scatter plot displaying the predicted MHC class I binding strength (binding percentile rank) by variant-specific RNA expression (RNA variant allele frequencies [VAF] x TPM of gene’s expression) for each variant detected in the whole exome sequencing of GL261-luc2 (left) and CT2A-luc (right) tumors, colored by which MHC class I allele(s) the variant was predicted to bind. Axes are in log10 scale. Variant-specific expression was dichotomized into high and low using a cutoff of 3 TPM. MHC class I binding strength was categorized as strong (percentile rank < 0.5), weak (0.5 ≤ percentile rank < 2.0), or none (percentile rank ≥ 2.0). The corresponding percent of total variants found in each cell is displayed. TPM = transcripts per million. (B) Top: The VAF of antigen presentation machinery gene mutations detected in the whole exome sequencing of in vitro CT2A-luc and RNA sequencing of CT2A-luc tumors. Bottom: The predicted 3-D structure of Tap1 (Y488 residue highlighted) and Psmb8 (A275 residue highlighted) from AlphaFold. (C) Heatmap depicting the differential RNA expression of antigen processing and presentation machinery genes in ex vivo sorted GL261-hCD19-luc2 (n=5 mice) and CT2A-hCD19-luc (n=3 mice) tumor cells, with the corresponding FDR-adjusted p value. Expression values were row normalized, Z-scored, bounded, and scaled. Red = FDR-adjusted p value<0.05. (D) Western blot displaying the antigen presentation and processing machinery protein expression in in vitro GL261-luc2 and CT2A-luc cell lines, with or without 50 ng/mL IFN-γ stimulation. β-actin was evaluated as a loading control. Displaying one representative of two replicate experiments (replicates shown in Supplementary File ). Corresponding band densitometry quantification is shown in Supplementary Figure 4B . (E) Heatmap depicting the differential protein expression of antigen processing and presentation machinery genes in ex vivo bulk GL261-luc2 and CT2A-luc tumors (n=3 mice each), with the corresponding FDR-adjusted p value. Expression values were row normalized, Z-scored, bounded, and scaled. Red = FDR-adjusted p value<0.05. (F) Top: MHC class I surface expression median fluorescence intensity (MFI) detected by flow cytometric analysis on in vitro GL261-luc2 and CT2A-luc cells that were either stimulated with 50 ng/mL IFN-γ or unstimulated for 24 hours, compared to isotype controls. Expression was analyzed using one-way ANOVA, with two-sided pairwise p values adjusted for multiple testing using the Holm-Šídák method. The experiment was conducted in triplicate, bars = mean ± standard error. Bottom: Representative histograms of MHC expression. (G) Top: Volcano plot displaying the differential presentation of peptides between ex vivo GL261-luc2 and CT2A-luc bulk tumors (n=3 mice each), colored by MHC class I allele. Bottom: the proportions of presented peptides that were significantly decreased (blue) or increased (red) in ex vivo CT2A-luc bulk tumors as compared to GL261-luc2.
Figure 4
Figure 4
CT2A-luc is deficient in interferon response and signaling. (A) Gene set enrichment plots derived from the differential expression analyses in Figure 1E , displaying hallmark interferon response gene sets that were significantly depleted in CT2A-luc as compared to GL261-luc2, for ex vivo bulk tumors (left) and sorted hCD19+ tumor cells (right). n=3-5 mice each. (B) Chromosomal ideograms with GENCODE VM23 tracks for the chromosomal segments involving 4qC4 (top) and 10qD2-10qD3 (bottom) that were lost in CT2A-luc tumors, from the UCSC Genome Browser (http://genome.ucsc.edu). Select genes are highlighted. (C) Volcano plot displaying differential phosphorylation of tyrosine residues between ex vivo GL261-luc2 and CT2A-luc bulk tumors (n=856 total phosphotyrosine [pTyr] peptides). Cutoffs included |log2FoldChange| > log2(1.5) and Benjamini-Hochberg FDR-adjusted p<0.05. n=3 mice each. (D) Post-translational modification Signature Enrichment Analysis (PTM-SEA) of the differentially expressed phosphoserine and phosphothreonine peptides between ex vivo GL261-luc2 and CT2A-luc bulk tumors. FDR-adjusted p<0.05. n=3 mice each.
Figure 5
Figure 5
The secreted immunomodulatory protein profiles and relationship to human cancers of GL261-luc2 and CT2A-luc models. (A, B) Secreted (A) cytokines (IFN-γ, IFN-β, IL-6, TNF-α) and (B) chemokines (CCL2, CCL22, CCL5, CXCL9) were profiled from the conditioned media of the in vitro GL261-luc2 and CT2A-luc cultures from the Figure 3F experiment, which had been cultured for 24 hours without (blue) or with (red) IFN-γ (50 ng/mL). The experiment was conducted in triplicate, with secreted peptide concentrations graphed as mean ± standard error and compared using one-way ANOVA. The assay’s limit of detection (LoD; grey dashed line) was displayed and analyzed for samples whose values were above the LoD. For assessment of IFN-γ secretion, the IFNγ-stimulated samples still contained the experimentally administered IFN-γ. P values were adjusted for multiple testing using the Holm-Šídák method. The cell lines were also evaluated for IL-23, IL-10, GM-CSF, IL-17A, IL-1α, IL-1β, IL-12p70, IL-27, CCL3, CCL4, CXCL10, CCL20, CXCL1, CCL11, CCL17, CXCL5, and CXCL13; displayed in Supplementary Figure 6 . (C) Unsupervised principal component analysis of whole transcriptome expression of the ex vivo bulk (Cohort A) and ex vivo tumor sorted (Cohort B) GL261-luc2 and CT2A-luc samples alongside RNA sequencing of all human cancer samples from TCGA. The 500 genes that were most differentially expressed between mouse and human tumor samples were excluded to help minimize species-level effects. Inset = higher magnification. OncoTree cancer type definitions were detailed previously (39). Supplementary Figure 7A shows the corresponding unsupervised principal component analysis without the exclusion of the 500 genes that were most differentially expressed between mouse and human tumor samples.

Similar articles

Cited by

References

    1. Ribas A, Wolchok JD. Cancer immunotherapy using checkpoint blockade. Science (2018) 359(6382):1350–5. doi: 10.1126/science.aar4060 - DOI - PMC - PubMed
    1. Ostrom QT, Shoaf ML, Cioffi G, Waite K, Kruchko C, Wen PY, et al. National-level overall survival patterns for molecularly-defined diffuse glioma types in the United States. Neuro-Oncol (2022), noac198.25(4):799–807. doi: 10.1093/neuonc/noac198 - DOI - PMC - PubMed
    1. Iorgulescu JB, Sun C, Neff C, Cioffi G, Gutierrez C, Kruchko C, et al. Molecular biomarker-defined brain tumors: epidemiology, validity, and completeness in the United States. Neuro-Oncol (2022) 24(11):1989–2000 noac113. doi: 10.1093/neuonc/noac113 - DOI - PMC - PubMed
    1. Lim M, Weller M, Idbaih A, Steinbach J, Finocchiaro G, Raval RR, et al. Phase 3 trial of chemoradiotherapy with temozolomide plus nivolumab or placebo for newly diagnosed glioblastoma with methylated MGMT promoter. Neuro-Oncol (2022) 24(11):1935–49. noac116. doi: 10.1093/neuonc/noac116 - DOI - PMC - PubMed
    1. Reardon DA, Brandes AA, Omuro A, Mulholland P, Lim M, Wick A, et al. Effect of nivolumab vs bevacizumab in patients with recurrent glioblastoma: the checkMate 143 phase 3 randomized clinical trial. JAMA Oncol (2020) 6(7):1003–10. doi: 10.1001/jamaoncol.2020.1024 - DOI - PMC - PubMed

Publication types