

Development of a cost-effective compact diode-laser-based photoacoustic sensing instrument for breast tissue diagnosis
- PMID: 38213472
- PMCID: PMC10783045
- DOI: 10.1117/1.JBO.29.1.017002
Development of a cost-effective compact diode-laser-based photoacoustic sensing instrument for breast tissue diagnosis
Abstract
Significance: The photoacoustic (PA) technique, a noninvasive pump-probe technique, has found interesting applications in biomedical tissue diagnosis over the last decade. To take it a step further to clinical applications, the PA technique needs to be designed as an instrument focusing on a compact design, reducing the cost, and quickly providing a quantitative diagnosis.
Aim: This work presents a design and characterization of a cost-effective, compact PA sensing instrument for biomedical tissue diagnosis.
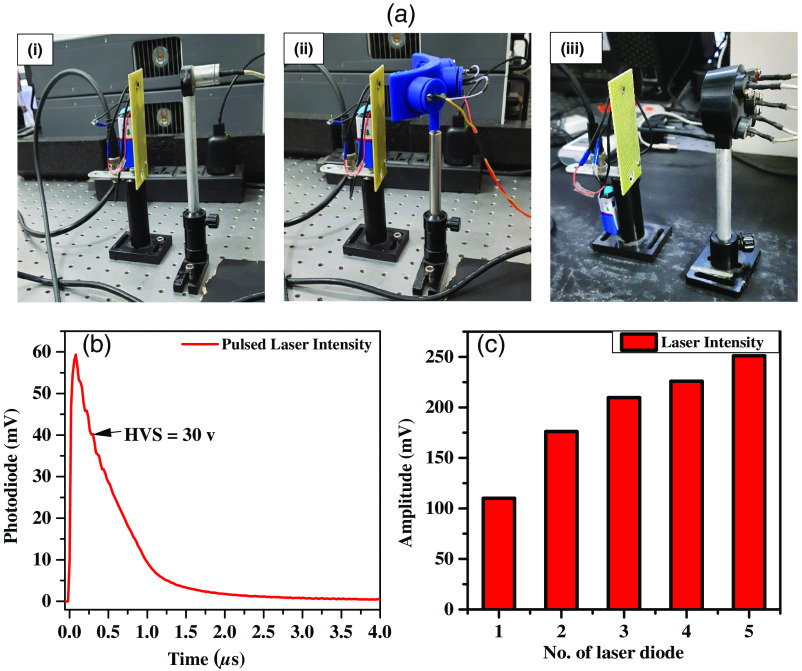
Approach: A compact laser diode case design is developed to house several laser diodes for PA excitation, and a pulsed current supply unit is also developed in-house to power the laser diodes to generate a 25 ns current pulse at a frequency of 20 kHz. After PA experimental data acquisition, the signal's frequency spectra were calculated to characterize the tissue quantitatively and correlated with their mechanobiological properties.
Results: The corresponding dominant frequency peak in the PA spectral response (PASR) study was low in the fibrofatty normal breast tissue , compared to the dominant frequency peak of in the fibrocystic disease tissue, which had increased glandular and stromal elements, thereby increased tissue density. The histopathological findings correlated with the PASR results, and the fibrocystic breast disease tissue exhibited a higher dominant frequency peak and energy compared to the normal breast tissue.
Conclusions: We experimented with an in vitro PASR study of fibrocystic human breast tissues and successfully differentiated different tissue types using quantitative spectral parameters peak frequency, mean frequency, and spectral energy. This gives the potential to take this technique further for cost-effective and quick clinical applications.
Keywords: breast tissue diagnosis; diode laser; optical casing; photoacoustic sensing; quantitative information; spectral response.
© 2024 The Authors.
Figures


References
-
- Ellis I., et al. , Pathology Reporting of Breast Disease in Surgical Excision Specimens Incorporating the Dataset for Histological Reporting of Breast Cancer, June 2016, The Royal College of Pathologists; (2019).
-
- Jayker S. S., et al. , “Spectrum of lesions in peritumoral area in association with carcinoma of breast,” J. Med. Sci. 5(3), 63–66 (2020).10.5005/jp-journals-10045-00130 - DOI
MeSH terms
LinkOut - more resources
Full Text Sources
Miscellaneous
