. 2023 Dec 2;27(1):108422.
doi: 10.1016/j.isci.2023.108422. eCollection 2024 Jan 19.

Prothymosin α accelerates dengue virus-induced thrombocytopenia

Affiliations

Prothymosin α accelerates dengue virus-induced thrombocytopenia

Mei-Lin Yang et al. iScience. .

Abstract

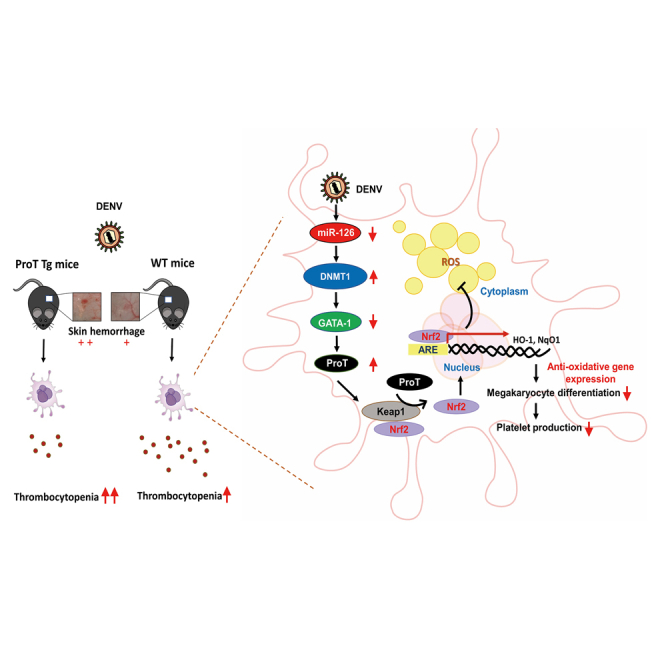
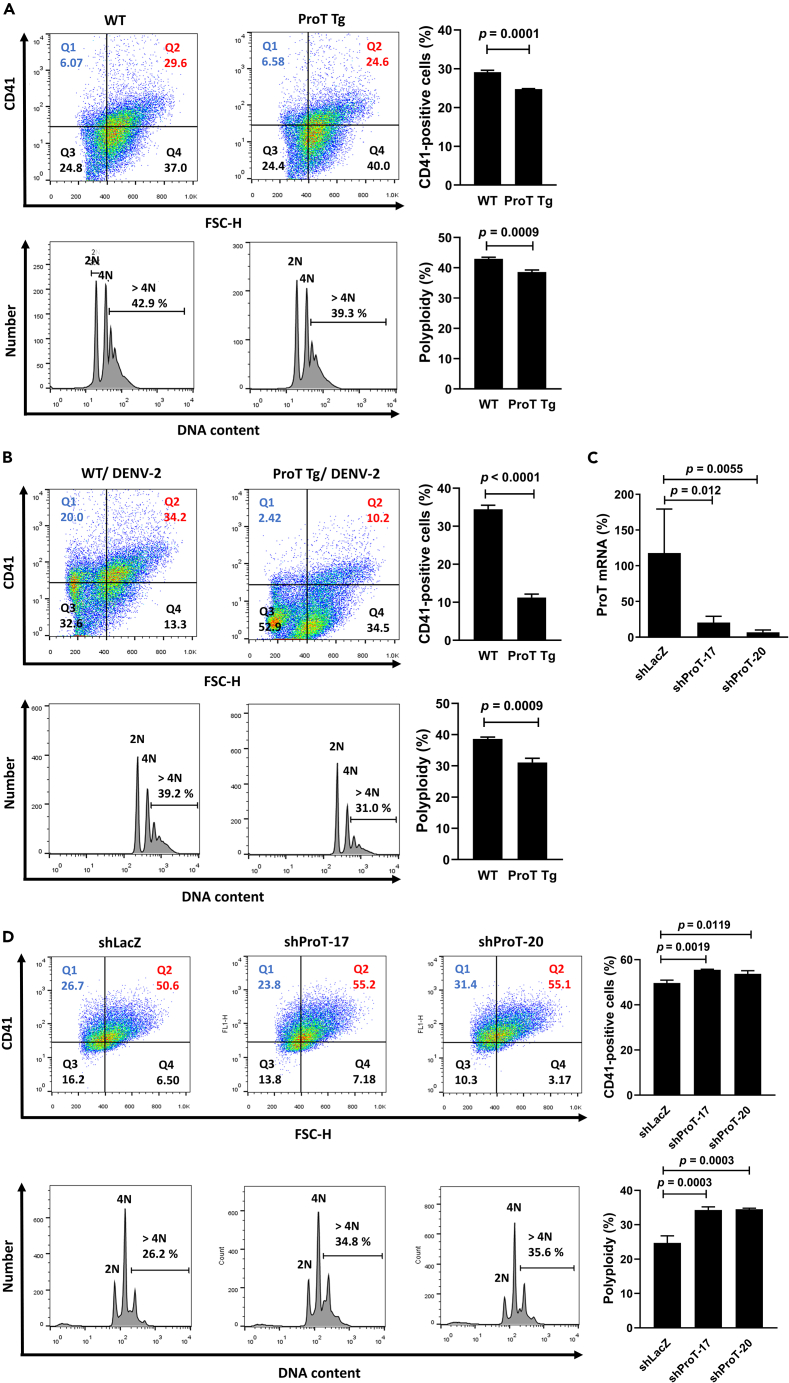
Thrombocytopenia is the hallmark finding in dengue virus (DENV) infection. Prothymosin α (ProT) has both intracellular and extracellular functions involved in cell cycle progression, cell differentiation, gene regulation, oxidative stress response, and immunomodulation. In this study, we found that ProT levels were elevated in dengue patient sera as well as DENV-infected megakaryoblasts and their culture supernatants. ProT transgenic mice had reduced platelet counts with prolonged bleeding times. Upon treatment with DENV plus anti-CD41 antibody, they exhibited severe skin hemorrhage. Furthermore, overexpression of ProT suppressed megakaryocyte differentiation. Infection with DENV inhibited miR-126 expression, upregulated DNA (cytosine-5)-methyltransferase 1 (DNMT1), downregulated GATA-1, and increased ProT expression. Upregulation of ProT led to Nrf2 activation and reduced reactive oxygen species production, thereby suppressing megakaryopoiesis. We report the pathophysiological role of ProT in DENV infection and propose an involvement of the miR-126-DNMT1-GATA-1-ProT-Nrf2 signaling axis in DENV-induced thrombocytopenia.

Keywords: Cell biology; Virology.


Conflict of interest statement

The authors declare that they have no competing interests.

Figures

None
Graphical abstract
Figure 1
Figure 1
Serum ProT levels are increased in dengue patients and DENV-infected Meg-01 cells and their culture supernatants (A) ProT levels in the sera of dengue patients grouped according to their PLT counts, including >150,000/mm3 (n = 35), 100,000–150,000/mm3 (n = 30), and <100,000/mm3 (n = 36), as well as healthy controls (n = 27) quantified by ELISA. Values are means ± SD (one-way ANOVA). (B) Pearson correlation analysis for the correlation of ProT levels and PLT counts showing the best-fit linear trend line. (C–F) Determination of DENV RNA (C), ProT mRNA (D), as well as protein levels of ProT and NS3 (E) in Meg-01 cells infected with DENV-2 at an MOI of 1 for different time points by RT-qPCR (C, D) and immunoblotting (E). The ratio of mock infected cells was arbitrarily set to 100 (D). Expression of GAPDH served as the loading control (E). Values shown below the blots are ratios between the intensity of the bands corresponding to ProT or NS3 and those corresponding to GAPDH analyzed by densitometry, where the ratio of mock infected cells was set to 1. The ProT content in the supernatant of DENV-infected Meg-01 cells was also quantified by ELISA (F). Values are means ± SD (n = 3, one-way ANOVA).
Figure 2
Figure 2
Overexpression of ProT causes reduction in PLT counts and accelerates DENV-induced thrombocytopenia in mice (A–C) Serum ProT levels (A), PLT counts (B), and tail bleeding times (C) of 8-week-old ProT Tg and WT C57BL/6 mice. (D and E) WT mice were subcutaneously injected with or without DENV-2 (107 PFU), followed 24 h later by treatment with or without anti-PLT CD41 antibody (1 mg/kg). ProT was detected in bone marrow cells (D) and sera (E) of the mice at day 4 pi by immunoblotting and ELISA, respectively. Representative immunoblot images of ProT with each lane representing a sample from an individual mouse (D, left) and quantification of relative ProT levels normalized to β-actin (D, right. saline, n = 6; DENV-2, n = 3; anti-CD41, n = 3; DENV-2 + anti-CD41, n = 6). Values shown below the blots are ratios between the intensity of the bands corresponding to ProT and those corresponding to β-actin analyzed by densitometry. (F and G) PLT counts of WT mice treated with either saline, DENV-2, anti-CD41, or DENV-2 + anti-CD41 at day 2 pi (F). Pearson correlation analysis for the correlation of ProT levels and PLT counts showing the best-fit linear trend line (G). (H–J) PLT counts of ProT Tg and WT mice treated with either saline or DENV-2 + anti-CD41 at day 2 pi (H), as well as images (I) and scores (J) of skin hemorrhage at day 3 pi. Values are means ± SD (one-way ANOVA or Student’s t test).
Figure 3
Figure 3
Overexpression of ProT suppresses megakaryocyte differentiation (A and B) Percentages (upper panels) and DNA contents (lower panels) of CD41-positive megakaryocytes from ProT Tg and WT mice. Bone marrow cells collected from the mice were treated with mouse TPO (50 ng/mL) and mouse IL-3 (10 ng/mL) for 6 days alone (A) or in combination with DENV-2 (MOI = 1) infection from day 3 onwards (B). They were then stained with CD41 and propidium iodide and analyzed by flow cytometry. (C and D) Meg-01 cells were transduced with shRNAs specific to ProT (shProT-17 and shProT-20) or the control shLacZ for knockdown of ProT, treated with PMA (10−6 M) for inducing differentiation, stained with CD41 and propidium iodide, and analyzed by flow cytometry. Validation of ProT levels by RT-qPCR (C) and percentages (upper panels) and DNA contents (lower panels) of CD41-positive cells (D) in ProT knockdown and control cells. (A–D) The Q2 region represents CD41-positive cells (FSC >400 and CD41 > 101–102). Quantitative data were analyzed using bar charts (right panels). Values are mean ± SD (n = 3, Student’s t test or one-way ANOVA).
Figure 4
Figure 4
DENV infection reduces miR-126-3p, increases DNMT1, and reduces GATA-1 expression in Meg-01 cells (A and B) Detection and quantification of miR-126-3p (A) as well as DNMT1, viral NS3, and GATA-1 proteins in Meg-01 cells infected with DENV-2 at an MOI of 1 at different time points by RT-qPCR (A) and immunoblotting (B). Values are means ± SD (n = 4, one-way ANOVA). The ratio of mock infected cells was arbitrarily set to 100 (A). Expression of GAPDH served as the loading control (B). Values shown below the blots are ratios between the intensity of the bands corresponding to DNMT1 or GATA-1 and those corresponding to GAPDH analyzed by densitometry, where the ratio of mock infected cells was set to 1. (C) Immunohistochemical detection (original magnification ×200; scale bar = 100 μm) (left) and quantitation of DNMT1-positive cells (right) in the bone marrow of WT mice treated with either saline or DENV-2 + anti-CD41 at day 4 pi. Values shown are mean ± SD (n = 3, Student’s t test). (D–G) Detection and quantification of miR-126-3p (D), DNMT1 (E), GATA-1 (F), and ProT (G) in Meg-01 cells transduced with LV.miR-126 or LV.miR-Ctrl by RT-qPCR. The ratio of LV.miR-Ctrl-transduced control cells was arbitrarily set to 100. Values shown are mean ± SD (n = 4, Student’s t test).
Figure 5
Figure 5
DNMT1 negatively regulates GATA-1 expression, and GATA-1 also negatively regulates ProT expression (A) Detection (left) and quantification (right) of GATA-1 and viral NS3 in DENV-infected Meg-01 cells treated with 1, 2, or 5 μM of the DNMT1 inhibitor 5-AZA-2′-deoxycytidine (5′-Aza-dc) for 72 h. Expression of β-actin served as the loading control. The immunoblot is from one representative experiment of three (left). Values shown are ratios between the intensity of the bands corresponding to GATA-1 and those corresponding to β-actin analyzed by densitometry, where the ratio of mock infected cells was set to 1 (right). Values shown are mean ± SD (n = 3, one-way ANOVA). (B) ChIP assay showing a 2.5-fold increase in the binding of DNMT1 to the GATA-1 promoter region in Meg-01 cells after infection with DENV-2 at an MOI of 1 for 3 days. Cross-linked chromatin was immunoprecipitated with anti-DNMT-1 or anti-IgG antibody combined with protein G agarose beads, followed by PCR amplification of the GATA-1 promoter. The ratio shown below the images is normalized to the amount of the input. (C) The PTMA promoter activity assessed in 293T cells 48 h after cotransfection with 1 μg of pGL3-pProT-Luc and various doses of pSin4-EF1a-GATA-1-IRES-Puro (upper panel). The total amount of plasmid DNA for transfection was kept constant by the addition of a control plasmid. Validation of GATA-1 expression in a dose-dependent manner by immunoblotting (lower panel). Expression of β-actin served as the loading control. Values shown are means ± SD (n = 3, one-way ANOVA). (D) Expression of ProT (upper panel) and validation of knockdown of GATA-1 expression (lower panel) in GATA-1 knockdown Meg-01 and control cells. Meg-01 cells were transduced with lentiviral vectors encoding shRNAs specific to GATA-1 (shGATA-1-358 and shGATA-1-359) or LacZ (control). Expression of β-actin or GAPDH served as the loading control. Values shown below the blots are ratios between the intensity of the bands corresponding to ProT or GATA-1 and those corresponding to β-actin or GAPDH analyzed by densitometry, where the ratio of mock infected cells was set to 1.
Figure 6
Figure 6
Overexpression of ProT promotes Nrf2 nuclear translocation and decreases ROS production, leading to reduced PLT production (A) Detection of Nrf2 and viral NS3 in Meg-01 cells infected with DENV-2 at an MOI of 1 at different time points by immunoblotting. Expression of GAPDH served as the loading control. Values shown at the bottom are ratios between the intensity of the bands corresponding to Nrf2 and those corresponding to GAPDH. (B) Nuclear translocation of Nrf2 in ProT-overexpressing cells. Meg-01 cells were transfected with pLAS2w.hProT-HA (ProT-HA), pLAs2w.hProT-Venus (ProT-Venus), or pLAS2w.Ppuro (Vector). After 48 h, nuclear and cytosolic extracts were harvested for immunoblot analysis. Lamin A/C and α-tubulin served as the nuclear and cytoplasmic markers, respectively. Values shown at the bottom are ratios between the intensity of the bands corresponding to Nrf2 and those corresponding to α-tubulin or Lamin A/C. (C and D) Quantification of HO-1 (left) and NQO1 (middle) by RT-qPCR and measurement of ROS production (right) in Meg-01 cells transduced with lentiviral vectors encoding ProT (LV.ProT) or no transgenes (LV.Null) (C) and shRNA specific to ProT (LV.shProT-17 and -20) or LacZ (LV.shLacZ) (D). ROS production in ProT overexpression (C) and knockdown (D) Meg-01 cells or control cells were measured by flow cytometry after stimulation with PMA (10−6 M) for 7 days and staining with DCFDA. Values shown are means ± SD (n = 3, Student’s t test or one-way ANOVA). (E) Overexpression of miR-126 reduces Nrf2 levels and antioxidant gene expression. Detection and quantification of Nrf2, HO-1, and NQO1 in Meg-01 cells transduced with LV.miR-126 or LV.miR-Ctrl by RT-qPCR. Values shown are mean ± SD (n = 4, Student’s t test). (F) Quantification of GP9 and TUBB1, which are involved in PLT release, in ProT knockdown (shProT-20) or control (shLacZ) Meg-01 cells by RT-qPCR. Values shown are means ± SD (n = 3, Student’s t test). (G) Detection of the PLT activation marker CD42b in ProT knockdown (shProT-20) or control (shLacZ) Meg-01 cells by flow cytometry. Values shown are means ± SD (n = 3, Student’s t test or one-way ANOVA).
Figure 7
Figure 7
Overexpression of miR-126 improves megakaryocyte differentiation in the bone marrow cells of ProT Tg mice (A) Quantification of ProT mRNA levels in bone marrow cells treated with mouse TPO (50 ng/mL) and mouse IL-3 (10 ng/mL) to induce megakaryocyte differentiation from C57BL/6 mice at different time points by RT-qPCR. Values shown are mean ± SD (n = 4, one-way ANOVA). (B) Detection and quantification of miR-126-3p in ProT-overexpressing bone marrow cells transduced with LV.miR-Ctrl or LV.miR-126 in the presence of mouse TPO (50 ng/mL) and mouse IL-3 (10 ng/mL) by RT-qPCR. The relative mRNA level of the control cells was set to 1. Values shown are mean ± SD (n = 3, Student’s t test). (C) Morphology of megakaryocytes from ProT-overexpressing bone marrow cells transduced with LV.miR-Ctrl or LV.miR-126 in the presence of mouse TPO (50 ng/mL) and mouse IL-3 (10 ng/mL) (original magnification ×200, bar = 100 μm). (D) Percentages (upper panels) and DNA contents (lower panels) of CD41-positive megakaryocytes from ProT-overexpressing bone marrow cells transduced with LV.miR-Ctrl or LV.miR-126 in the presence of mouse TPO (50 ng/mL) and mouse IL-3 (10 ng/mL) mice. The Q2 region represents CD41-positive cells (FSC >300 and CD41 > 101–102). Quantitative data were analyzed using bar charts (right panels). Values are mean ± SD (n = 3, Student’s t test).

Similar articles

Cited by

References

    1. de Azeredo E.L., Monteiro R.Q., de-Oliveira Pinto L.M. Thrombocytopenia in dengue: interrelationship between virus and the imbalance between coagulation and fibrinolysis and inflammatory mediators. Mediat. Inflamm. 2015;2015 - PMC - PubMed
    1. Wang S., He R., Patarapotikul J., Innis B.L., Anderson R. Antibody-enhanced binding of dengue-2 virus to human platelets. Virology. 1995;213:254–257. - PubMed
    1. Saito M., Oishi K., Inoue S., Dimaano E.M., Alera M.T.P., Robles A.M.P., Estrella B.D., Jr., Kumatori A., Moji K., Alonzo M.T., et al. Association of increased platelet-associated immunoglobulins with thrombocytopenia and the severity of disease in secondary dengue virus infections. Clin. Exp. Immunol. 2004;138:299–303. - PMC - PubMed
    1. Ojha A., Nandi D., Batra H., Singhal R., Annarapu G.K., Bhattacharyya S., Seth T., Dar L., Medigeshi G.R., Vrati S., et al. Platelet activation determines the severity of thrombocytopenia in dengue infection. Sci. Rep. 2017;7 - PMC - PubMed
    1. Nelson E.R., Bierman H.R., Chulajata R. Hematologic findings in the 1960 hemorrhagic fever epidemic (dengue) in Thailand. Am. J. Trop. Med. Hyg. 1964;13:642–649. - PubMed

LinkOut - more resources