. 2023 Dec 7;27(1):108679.
doi: 10.1016/j.isci.2023.108679. eCollection 2024 Jan 19.

Pre- and postsynaptic nanostructures increase in size and complexity after induction of long-term potentiation

Affiliations

Pre- and postsynaptic nanostructures increase in size and complexity after induction of long-term potentiation

Valérie Clavet-Fournier et al. iScience. .

Abstract

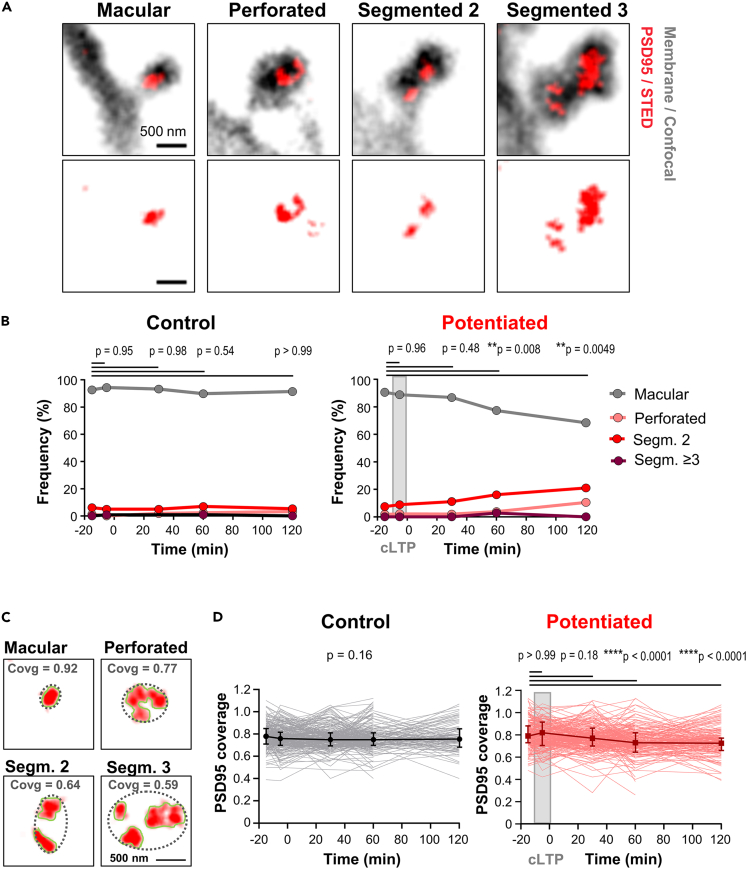
Synapses, specialized contact sites between neurons, are the fundamental elements of neuronal information transfer. Synaptic plasticity involves changes in synaptic morphology and the number of neurotransmitter receptors, and is thought to underlie learning and memory. However, it is not clear how these structural and functional changes are connected. We utilized time-lapse super-resolution STED microscopy of organotypic hippocampal brain slices and cultured neurons to visualize structural changes of the synaptic nano-organization of the postsynaptic scaffolding protein PSD95, the presynaptic scaffolding protein Bassoon, and the GluA2 subunit of AMPA receptors by chemically induced long-term potentiation (cLTP) at the level of single synapses. We found that the nano-organization of all three proteins increased in complexity and size after cLTP induction. The increase was largely synchronous, peaking at ∼60 min after stimulation. Therefore, both the size and complexity of individual pre- and post-synaptic nanostructures serve as substrates for tuning and determining synaptic strength.

Keywords: Neuroscience; Sensory neuroscience.


Conflict of interest statement

The authors declare no competing interests.

Figures

None
Graphical abstract
Figure 1
Figure 1
Super-resolution microscopy of endogenous PSD95 in hippocampal organotypic slices (A and B) Dual-label schema by sequential readout: The FPs Citrine and rsEGFP2 are excited with blue light (Exc) and detected between 510 and 560 nm (Det); stimulated emission depletion (STED) is performed on demand at 595 nm (A). The reversibly switchable FP rsEGFP2 is switched to the on state with UV light at 405 nm and to the off state with blue light at 488 nm. (C) Hippocampal neurons express a myristoylation tag (myr) and a dendrite targeting sequence (LDLR) fused to rsEGFP2 to label the dendritic membrane and an antibody-like tag (PSD95.FingR) fused to Citrine to label endogenous PSD95. Super-resolution STED microscopy of PSD95 (red) and confocal imaging of the neuronal membrane (gray). (D) Time-lapse imaging of PSD95 and spine morphology over >2 h. (E) Magnification of boxed area in (D); encircling of the PSD95 assembly and spine head for size analysis. Images are smoothed and maximum intensity projection (C, D).
Figure 2
Figure 2
Increase in synaptic strength, spine head and PSD95 assembly size after cLTP induction (A) Time-line of the experiment. Chemical LTP (cLTP) is induced by ACSF containing zero Mg2+, 200 μM glycine, 20 μM bicuculline. (B–D) Whole cell voltage-clamp recording of mEPSC in organotypic hippocampal slices. (B) Representative mEPSC traces (top) of CA1 pyramidal neurons before (−15 min) and after (+65 min) cLTP induction and averaged normalized current ±SEM (bottom); control without cLTP (black) and with cLTP induction (red) (unpaired t-test; ∗p < 0.05; ∗∗p < 0.01; ∗∗∗p < 0.001, ∗∗∗∗p < 0.0001). (C) Frequency distribution of mEPSC amplitude and cumulative frequency before (open circle, −15 min) and after cLTP induction (closed circle, 65 min) ±SEM (paired t-test, before: after). (D) Normalized frequencies of mEPSC after 65 min compared to before cLTP induction (left), rise time (middle) and decay times (right) for 20–80% of mEPSC. Bars represent average ±SEM with (red) and without (black) induction of cLTP; no significant difference between cLTP and control (unpaired t-test) (E) Representative images of potentiated and unpotentiated spines before and after cLTP induction. (F) Median and interquartile range (IQR; 25% and 75% percentile) of changes in spine head area of potentiated and unpotentiated spines after cLTP relative to control. Control conditions were continuously kept in ACSF (control) or spines at blocked activity measured in ACSF containing APV (APV). Changes were compared to control for each time-point (Data did not pass D'Agostino-Pearson normality test; Kruskal-Wallis with Dunn’s multiple comparisons test; −5 min: Pot vs. Ctr, p < 0.0001; Unpot vs. Ctr, p = 0.02; APV vs. Ctr, p > 0.99; 30 min: Pot vs. Ctr, p < 0.0001; Unpot vs. Ctr, p = 0.27; APV vs. Ctr, p = 0.84; 60 min: Pot vs. Ctr, p < 0.0001; Unpot vs. Ctr, p = 0.13; APV vs. Ctr, p > 0.99; 120 min: Pot vs. Ctr, p < 0.0001; Unpot vs. Ctr, p > 0.99; APV vs. Ctr, p > 0.99). (G) Median and IQR for PSD95 area of the spines analyzed in (F) (Data did not pass D'Agostino-Pearson normality test; Kruskal-Wallis with Dunn’s multiple comparisons test; −5 min: Pot vs. Ctr, p = 0.32; Unpot vs. Ctr, p > 0.99; APV vs. Ctr, p = 0.18; 30 min: Pot vs. Ctr, p = 0.02; Unpot vs. Ctr, p > 0.99; APV vs. Ctr, p = 0.17; 60 min: Pot vs. Ctr, p < 0.0001; Unpot vs. Ctr, p = 0.14; APV vs. Ctr, p > 0.99; 120 min: Pot vs. Ctr, p = 0.74; Unpot vs. Ctr, p > 0.99; APV vs. Ctr, p > 0.99). (B–D) Number of recorded cells: cLTP: 9; control: 5. (F, G) Number of analyzed spine changes at −5, 30, 60, 120 min: Control: 121, 221, 220, 100; APV:, 153, 227, 198, 82; unpotentiated: 66, 202, 196, 130; potentiated: 46, 106, 110, 63. Number of analyzed PSD95 assembly changes at the same time points: Control: 119, 220, 212, 92; APV: 153, 222, 167, 70; unpotentiated: 68, 201, 195, 123; potentiated: 45, 101, 108, 59. Number of hippocampal slices, one dendrite/neuron per slice: Control: 10; APV: 13; unpotentiated: 19; potentiated: 19. Source data: Table S1.
Figure 3
Figure 3
Reorganization of the PSD95 nano-pattern after cLTP induction (A) STED images of PSD95 (red) and confocal images of the spine membrane (gray) depicting representative examples of macular or perforated PSD95 assemblies and such consisting of 2 or 3 segments. (B) Percentage of macular, perforated, segmented 2, and segmented ≥3 PSD95 assemblies per spine for up to 120 min after cLTP induction (right) or control without stimulation (left) (Mixed-effects analysis with Dunett’s multiple comparisons test). Source data: Table S2. (C) The PSD95 coverage (covg) ratio was calculated by dividing the area covered with PSD95 (red) by the greatest extent of the synapse (dashed black ellipse). (D) PSD95 coverage ratio for control and cLTP potentiated spines over a 120 min time course; single spine traces in light colors overlaid with median (error bars represent IQR; mixed-effects analysis with Dunett’s multiple comparisons test; overall p value (control) and p value after multiple comparisons test (potentiated)). Source data: Table S3. (B, D) Number of analyzed PSD95 assemblies at −15, −5, 30, 60, 120 min: control: 227, 120, 221, 213, 92; potentiated: 109, 45, 102, 109, 60.
Figure 4
Figure 4
AMPAr nanocluster containing the GluA2 subunit and PSD95 nanostructures increase similarly in size after cLTP induction (A) Two-color STED image of PSD95 and GluA2 (immunolabelling), and confocal image of F-actin (labeled with phalloidin) in hippocampal neuronal cell culture at 17 DIV. (B) Time series of hippocampal neuronal cultures fixed at 0, 30 min, 60 min, and 120 min after cLTP induction (right) or without stimulation (control, left). Scale bar: 500 nm. (C) Median of PSD95 area per spine head; box and whisker plot with 25%–75% percentiles (box) and 5%–95% percentiles (whisker) (Mann-Whitney test). (D) Median and box and whisker plot of total GluA2 area per synapse following cLTP induction and of control (Mann-Whitney test). (E) Median and box and whisker plot of the area of single synaptic GluA2 nanocluster with and without cLTP induction (Mann-Whitney test). (F) Correlation between the size of the PSD95 and synaptic GluA2 area at different time points after cLTP induction or control samples fixed at the same time points; line shows linear regression. Pearson’s correlation coefficient r for control/cLTP: 0 min: 0.47/0.68; 30 min: 0.60/0.64; 60 min: 0.61/0.57; 120 min: 0.61/0.68. No significant difference in slope (p value displayed). (C–F) Data did not pass D'Agostino-Pearson normality test. Number of analyzed spines: Control: 0 min: 188, 30 min: 199, 60 min: 222, 120 min: 188; cLTP: 0 min: 207, 30 min: 181, 60 min: 220, 120 min: 213. Spines were analyzed per condition from at least 7 fields of view from 3 independent experiments. Source data: Table S4.
Figure 5
Figure 5
Coordinated increase of PSD95 and Bassoon assembly size after cLTP induction (A) Two-color STED microscopy of PSD95 and Bassoon (immunohistochemistry labeling), and confocal image of F-actin (phalloidin labeling) in a hippocampal neuronal culture at 17 DIV. (B) Time series of neurons fixed at 0, 30 min, 60 min, and 120 min after cLTP induction (right) or control samples fixed at the same time points without stimulation (left). Scale bar: 500 nm. (C) PSD95 assembly area per spine at 0, 30 min, 60 min, and 120 min after cLTP induction compared to control (median, box and whisker plot; Mann-Whitney test). (D) Same as (C), but for Bassoon area facing PSD95 (Mann-Whitney test). (E) Correlation between PSD95 and Bassoon assembly area per spine at 0, 30 min, 60 min, and 120 min following cLTP compared to control; line shows linear regression. Pearson’s correlation coefficient r for control/cLTP: 0 min: 0.75/0.58; 30 min: 0.83/0.79; 60 min: 0.74/0.67; 120 min: 0.68/0.71. (C–E) Data did not pass D'Agostino-Pearson normality test. Number of analyzed spines: Control: 0 min: 359, 30 min: 381, 60 min: 421, 120 min: 466; cLTP: 0 min: 340, 30 min: 310, 60 min: 424, 120 min: 370. Spines were analyzed per condition from at least 7 fields of view from 3 independent experiments. Source data: Table S5.
Figure 6
Figure 6
Similar nanoarchitecture across the synaptic scaffolds and AMPA receptors (A) Categorization of PSD95 nano-organization (red) and GluA2 containing AMPAr nanocluster (blue). PSD95 structures are categorized into macular, perforated, or assemblies which consist of 2 or 3 separated segments; GluA2 categorized in number of nanoclusters located on PSD95 per spine. For an overview image refer to Figure S7A. Scale bar: 500 nm. (B) Frequency of the number of AMPA receptor clusters as function of PSD95 morphologies; all time points and with and without cLTP induction pooled. Source data: Table S4. (C) Examples of the different PSD95 morphologies and presynaptic Bassoon nanostructures. Scale bar: 500 nm. (D) Frequency of Bassoon morphologies on different PSD95 nano-organizations. Source data: Table S5. Number of analyzed spines (B) are the same as in Figure 4 and for (D) the same as in Figure 5; cLTP, control and all time points were pooled.

Similar articles

Cited by

References

    1. Calverley R.K., Jones D.G. A serial-section study of perforated synapses in rat neocortex. Cell Tissue Res. 1987;247:565–572. - PubMed
    1. Sun Y., Smirnov M., Kamasawa N., Yasuda R. Rapid Ultrastructural Changes in the PSD and Surrounding Membrane after Induction of Structural LTP in Single Dendritic Spines. J. Neurosci. 2021;41:7003–7014. - PMC - PubMed
    1. Nair D., Hosy E., Petersen J.D., Constals A., Giannone G., Choquet D., Sibarita J.-B. Super-resolution imaging reveals that AMPA receptors inside synapses are dynamically organized in nanodomains regulated by PSD95. J. Neurosci. 2013;33:13204–13224. - PMC - PubMed
    1. Broadhead M.J., Horrocks M.H., Zhu F., Muresan L., Benavides-Piccione R., DeFelipe J., Fricker D., Kopanitsa M.V., Duncan R.R., Klenerman D., et al. PSD95 nanoclusters are postsynaptic building blocks in hippocampus circuits. Sci. Rep. 2016;6:24626. - PMC - PubMed
    1. Wegner W., Mott A.C., Grant S.G.N., Steffens H., Willig K.I. In vivo STED microscopy visualizes PSD95 sub-structures and morphological changes over several hours in the mouse visual cortex. Sci. Rep. 2018;8:219. - PMC - PubMed

LinkOut - more resources