Review
. 2023 Jan 16:21:940-955.
doi: 10.1016/j.csbj.2023.01.016. eCollection 2023.

A guidebook of spatial transcriptomic technologies, data resources and analysis approaches

Affiliations
Review

A guidebook of spatial transcriptomic technologies, data resources and analysis approaches

Liangchen Yue et al. Comput Struct Biotechnol J. .

Abstract

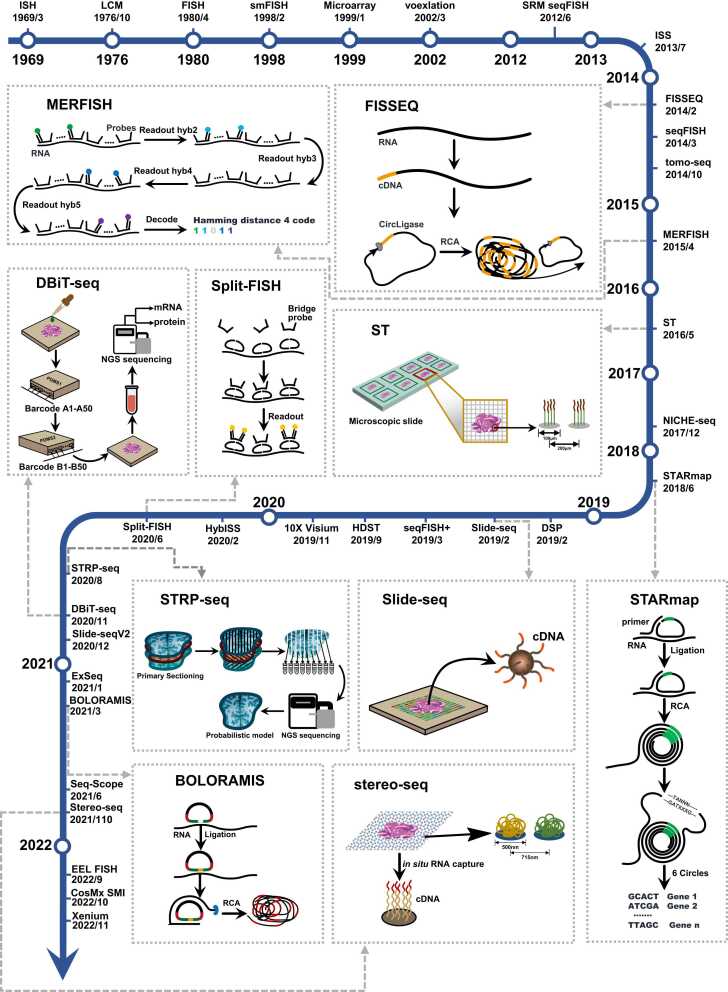
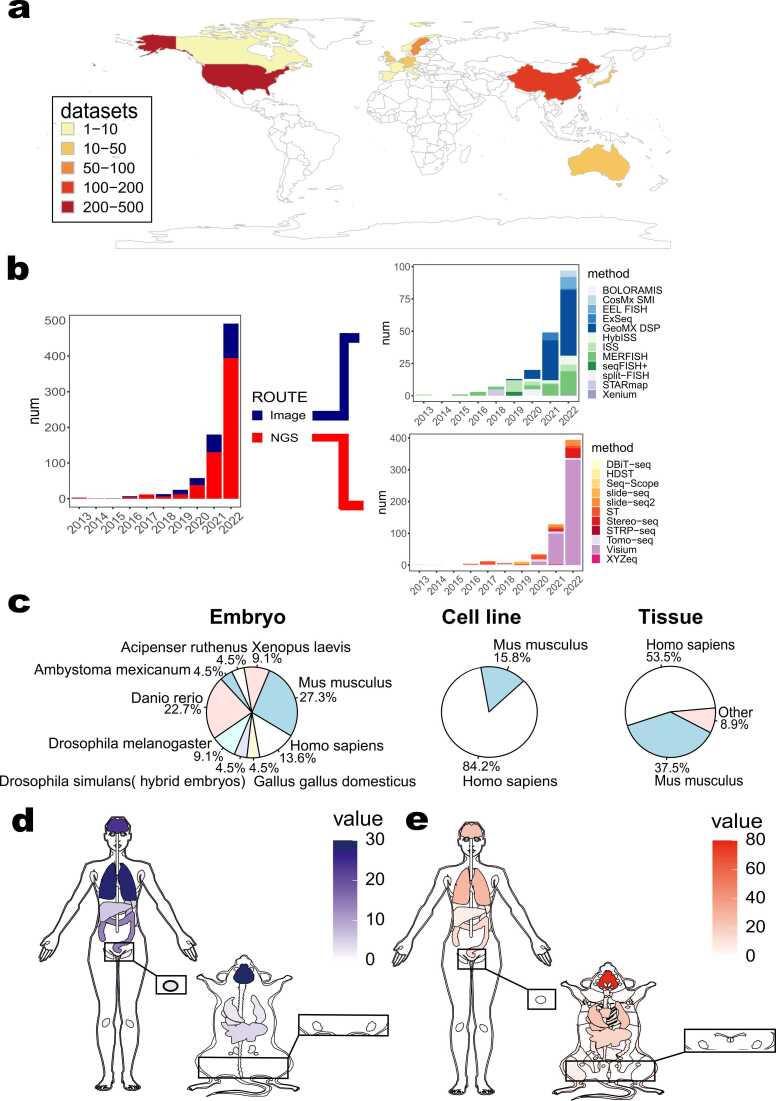
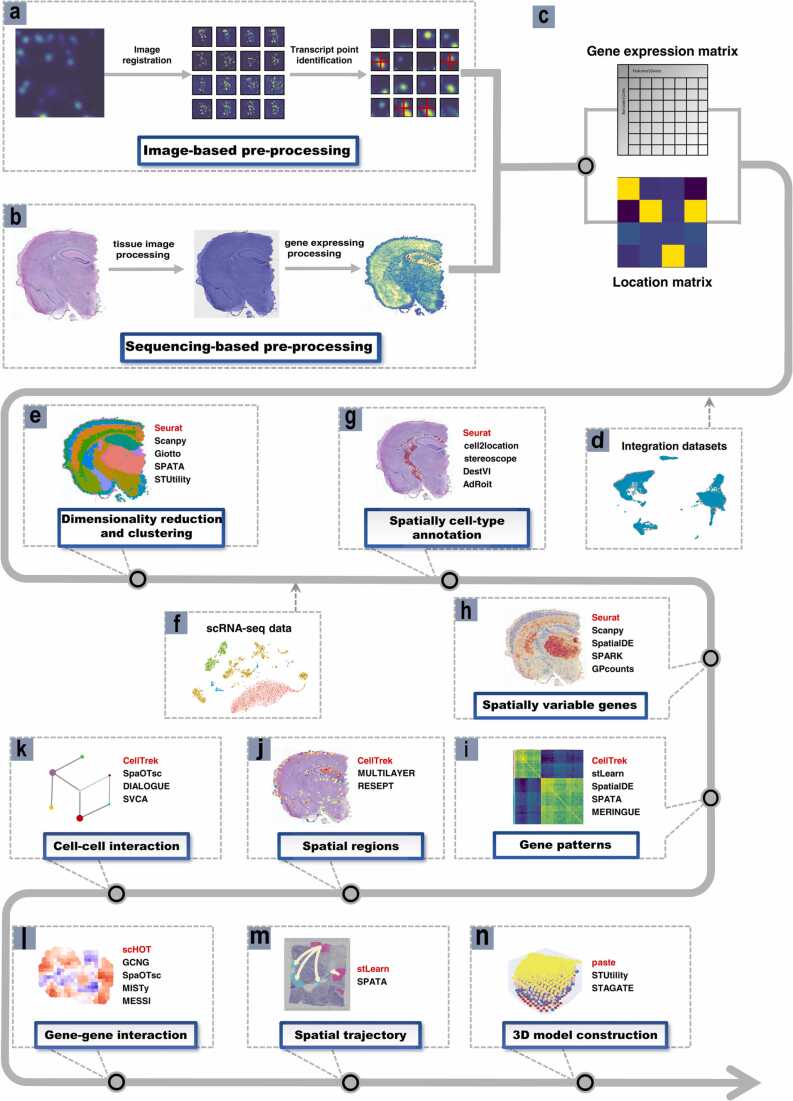
Advances in transcriptomic technologies have deepened our understanding of the cellular gene expression programs of multicellular organisms and provided a theoretical basis for disease diagnosis and therapy. However, both bulk and single-cell RNA sequencing approaches lose the spatial context of cells within the tissue microenvironment, and the development of spatial transcriptomics has made overall bias-free access to both transcriptional information and spatial information possible. Here, we elaborate development of spatial transcriptomic technologies to help researchers select the best-suited technology for their goals and integrate the vast amounts of data to facilitate data accessibility and availability. Then, we marshal various computational approaches to analyze spatial transcriptomic data for various purposes and describe the spatial multimodal omics and its potential for application in tumor tissue. Finally, we provide a detailed discussion and outlook of the spatial transcriptomic technologies, data resources and analysis approaches to guide current and future research on spatial transcriptomics.

Keywords: Spatial transcriptomic technologies.


Conflict of interest statement

The authors declare that they have no known competing financial interests or personal relationships that could have appeared to influence the work reported in this paper.

Figures

Fig. 1
Fig. 1
Map of spatial transcriptomics and related technological developments. The dates marked are referenced to the date of acceptance of the paper, whereas preprint articles are referenced to the date of online publication. Visium is referenced to the press release on the official 10X Geonomics website. The ten technologies selected are representative of the development of spatial transcriptomic technologies, and together with the explanations in the text, they provide an accurate picture of the evolution of spatial transcriptomes.
Fig. 2
Fig. 2
Statistics of spatial transcriptomic datasets. a, Differences in the distribution of papers in the database across countries. b, Trend graphs of the number of articles issued in both technical lines. Data are available until 31 December, 2022. c, Categories of experimental material used in spatial transcriptomic experiments. d, Percentage of human and mouse organs or tissues used in imaging-based technologies. e, Percentage of human and mouse organs or tissues used in sequencing-based technologies.
Fig. 3
Fig. 3
Workflow of data analysis. a, Pre-processing processes of imaging-based technologies. b, Pre-processing processes based on NGS based data, using Visium data as an example. c, The gene location matrix and the gene expression matrix are gotten after pre-processing. d, Combination of different data sources and batch effect correction. e, The data is dimensioned down to reduce the number of metrics to be analyzed while retaining as much information as possible. Spots with similar expression patterns are then clustered, and the clustering results are visualized by non-linear dimensionality reduction (t-SNE or UMAP). f, Prediction of cell types by combining spatial transcriptomic data with single-cell sequencing data from the same sample. g, Prediction of cell types from spatial transcriptomic data by deconvolution or integration in combination with annotated homologous single-cell data. h, Calculation of spatially variable genes using spatial dimensional information. i, Co-expression analysis of gene expression information is performed to mine the correlation patterns of different gene expression. j, Defining spatial regions and recognizing possible tissue sub-regions by combining gene expression patterns with a cell type annotation. k, Analysis of intercellular interactions through spatial dimensional information of spatial transcriptomic data. l, Analysis of gene interactions using spatial information from gene expression. m, Reshaping the trajectory of cells in space over time and inferring the evolution and differentiation processes between cells using spatial dimensional information. n, Aligning and integrating spatial transcriptomic data and visualizing 3D models using gene expression similarities and spatial distances between loci in sequential or paired slices.

References

    1. Tang F., et al. mRNA-Seq whole-transcriptome analysis of a single cell. Nat Methods. 2009;6(5):377–382. - PubMed
    1. Haque A., et al. A practical guide to single-cell RNA-sequencing for biomedical research and clinical applications. Genome Med. 2017;9(1):75. - PMC - PubMed
    1. Maynard K.R., et al. Transcriptome-scale spatial gene expression in the human dorsolateral prefrontal cortex. Nat Neurosci. 2021;24(3):425–436. - PMC - PubMed
    1. Lacar B., et al. Nuclear RNA-seq of single neurons reveals molecular signatures of activation. Nat Commun. 2016;7:11022. - PMC - PubMed
    1. Marx V. Method of the year: spatially resolved transcriptomics. Nat Methods. 2021;18(1):9–14. - PubMed

LinkOut - more resources