. 2024 Mar 21;52(5):2372-2388.
doi: 10.1093/nar/gkad1257.

Aberrant DNA repair reveals a vulnerability in histone H3.3-mutant brain tumors

Affiliations

Aberrant DNA repair reveals a vulnerability in histone H3.3-mutant brain tumors

Giulia Giacomini et al. Nucleic Acids Res. .

Abstract

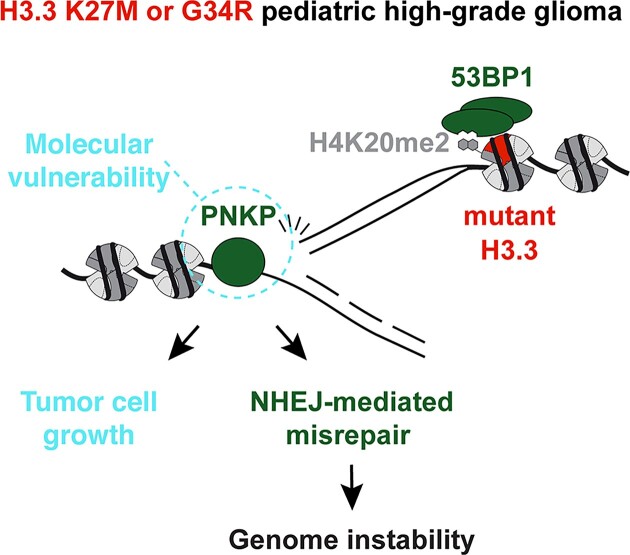
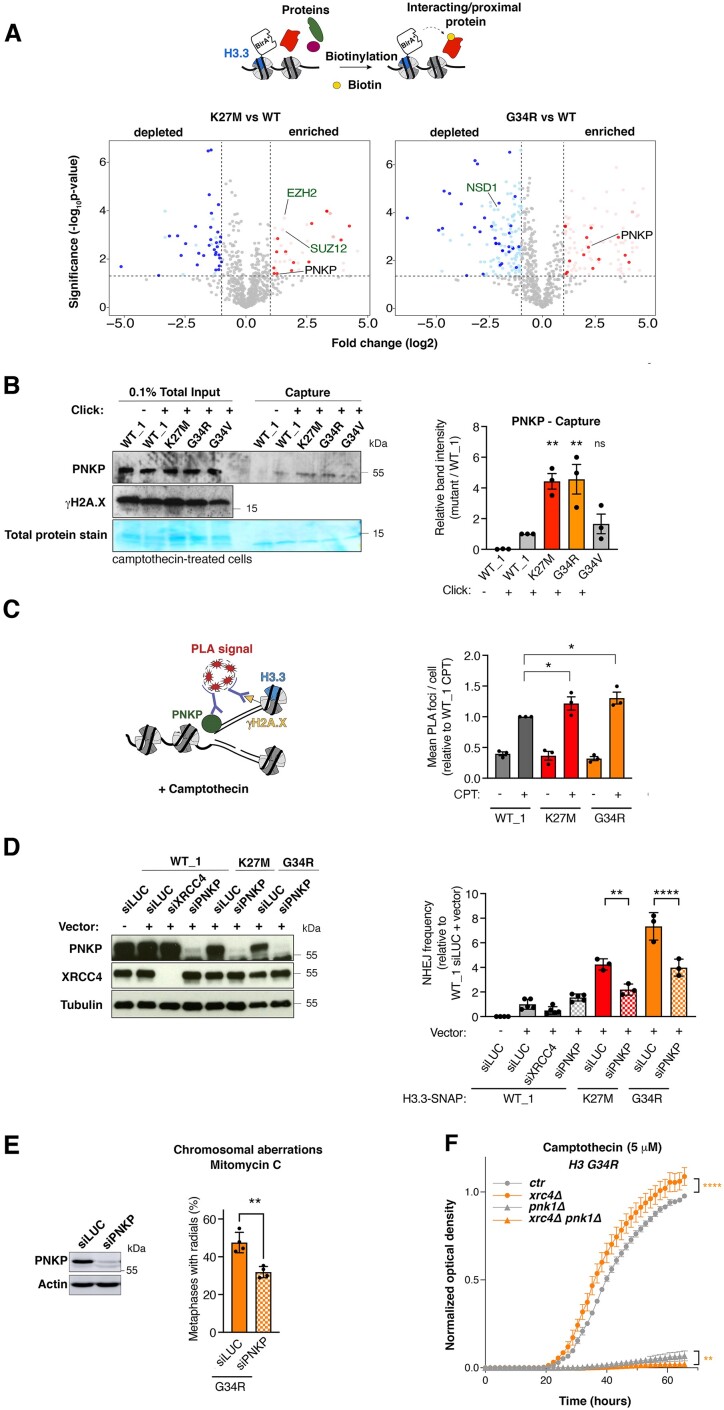
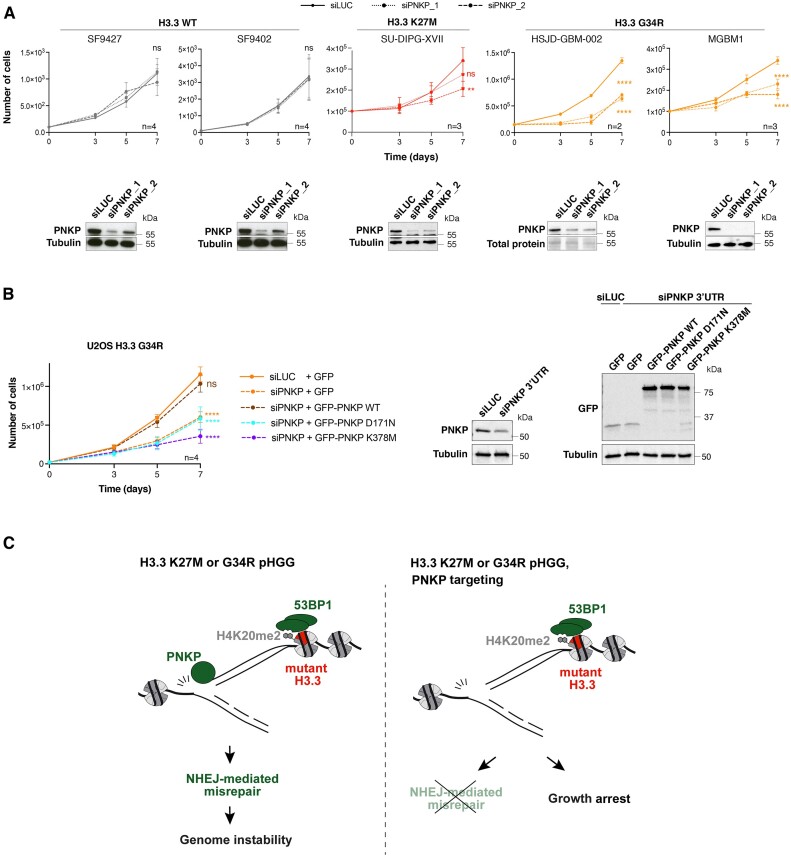
Pediatric high-grade gliomas (pHGG) are devastating and incurable brain tumors with recurrent mutations in histone H3.3. These mutations promote oncogenesis by dysregulating gene expression through alterations of histone modifications. We identify aberrant DNA repair as an independent mechanism, which fosters genome instability in H3.3 mutant pHGG, and opens new therapeutic options. The two most frequent H3.3 mutations in pHGG, K27M and G34R, drive aberrant repair of replication-associated damage by non-homologous end joining (NHEJ). Aberrant NHEJ is mediated by the DNA repair enzyme polynucleotide kinase 3'-phosphatase (PNKP), which shows increased association with mutant H3.3 at damaged replication forks. PNKP sustains the proliferation of cells bearing H3.3 mutations, thus conferring a molecular vulnerability, specific to mutant cells, with potential for therapeutic targeting.


Figures

Graphical Abstract
Graphical Abstract
Figure 1.
Figure 1.
H3.3 K27M and G34R pHGG mutations hijack DNA repair in S phase and harbor genomic instability features of aberrant NHEJ. (A, B) Analysis of RAD51 (A) and 53BP1 (B) repair foci by immunofluorescence in U2OS cells stably expressing wild-type H3.3 (WT_1) or the indicated mutants and treated with camptothecin (3 h, 0.1 μM). Representative images of repair foci in EdU+ cells are shown. Bar graphs depict the percentage of EdU+ and EdU cells harboring more than 5 (RAD51) or 10 (53BP1) foci. Mean ± SEM from two to three independent experiments, with n > 117 per sample for each experiment. (C) Analysis of NHEJ activity by random plasmid integration assay in U2OS cells stably expressing wild-type (WT_1) or mutant H3.3. Vector –, negative untransfected control. (D) Serial dilution analyses and proliferation curves of S. pombe strains expressing wild-type or mutant H3, depleted for the core NHEJ factor Xrc4 (xrc4Δ) and grown in standard growth medium (control) or in the presence of camptothecin (10 μM). Mean ± SEM from three independent experiments. (E) Scoring of radials in metaphase spreads of U2OS cells stably expressing wildtype (WT_1) or mutant H3.3 and treated with Mitomycin C (48 h, 25 ng/ml). Cells transfected with siRNA against FANCD2 (siFANCD2) and the core NHEJ factor XRCC4 (siXRCC4) are used as positive and negative controls (siLUC, siLuciferase, control). A representative example of a radial chromosome is shown in the inset. The western blots show siRNA efficiency (Tubulin, Actin, loading controls). Mean ± SEM from three to four independent experiments, with n > 24 per sample for each experiment. (F) Oncoprint representation of DNA repair-driven mutational signatures (ID8, indels 8; SBS3, single-base substitutions 3) in whole-genome sequences of pre-treatment, TP53-mutated, primary pHGG samples harboring wild-type H3.3 (WT), H3.3 K27M or G34R. Statistical significance is calculated by two-way ANOVA (A, B), one-way ANOVA (C, E), non-linear regression analysis with a sigmoidal dose-response model (D) or the non-parametric Kruskal–Wallis test (F). *P< 0.05; **P< 0.01; ***P< 0.001; ns: P> 0.05. Scale bars, 10 μm.
Figure 2.
Figure 2.
pHGG H3.3 mutants hinder DNA repair through a gain-of-function mechanism independently of hypomethylation at lysines 27 and 36 of histone H3. (A) Analysis of RAD51 and 53BP1 foci by immunofluorescence in U2OS cells transfected with siRNAs against Luciferase (siLUC, control) or H3.3 (siH3.3) and treated with camptothecin (3 h, 0.1 μM). The western blot shows siRNA efficiency (Tubulin, loading control). Representative images of RAD51 and 53BP1 foci in EdU+ cells are shown. Bar graphs depict the percentage of EdU+ and EdU cells harboring more than 5 (RAD51) or 10 (53BP1) foci. Mean ± SEM from two independent experiments, with n > 113 per sample for each experiment. (B) Analysis of RAD51 and 53BP1 foci by immunofluorescence in HeLa cells treated with DMSO or the EZH2 inhibitor GSK126 (EZH2i, 72 h, 1 μM) and damaged with camptothecin (3 h, 0.1 μM). The western blot shows the efficiency of EZH2 inhibition by analyzing H3K27me3 levels. Bar graphs depict the number of RAD51 or 53BP1 foci per cell in EdU+ and EdU cell populations. Mean ± SEM from three independent experiments, with n > 125 per sample for each experiment. (C) Analysis of RAD51 and 53BP1 foci by immunofluorescence in U2OS cells transfected with the indicated siRNAs (siLUC, negative control; siRNF168, positive control known to inhibit both RAD51 and 53BP1 foci formation) and treated with camptothecin (3 h, 0.1 μM). siRNA efficiencies and H3K36me3 levels are analyzed by western blot (Tubulin, loading control). Bar graphs depict the mean number of RAD51 or 53BP1 foci per cell relative to siLUC. Mean ± SEM from two and three independent experiments, with n > 131 for each experiment. Statistical significance is calculated by two-way ANOVA (A, B) or one-way ANOVA (C). *P< 0.05; **P< 0.01; ***P< 0.001; ns: P> 0.05. Scale bars, 10 μm.
Figure 3.
Figure 3.
H3.3 K27M and G34R pHGG mutants are de novo deposited and associated with increased H4K20me2 at damaged replication forks. (A) Scheme of the assay to monitor de novo deposition of wild-type H3.3-SNAP at the LacR-occupied LacO array fork barrier in U2OS LacO cells stably expressing SNAP-tagged H3.3 and transfected with mCherry-LacR. Images of a representative cell and 2.5× zoom on the LacO array. Quantification of new H3.3-SNAP accumulation (% cells presenting an enrichment) at LacR-occupied LacO array in EdU+ and EdU cells. Mean ± SEM from five independent experiments, with n > 20 per sample for each experiment. The H3.3 enrichment detected in EdU-negative cells likely reflects cells that were in S phase when the mCherry-LacR was already expressed and bound to the LacO array but before EdU addition since cells were transfected 24h before harvesting. (B) Schematic representation of the SNAP-PLA assay to visualize the colocalization of γH2A.X with newly synthesized SNAP-tagged H3.3 (labeled with biotin) at RFs damaged with camptothecin (3 h, 0.1 μM). Representative images and quantification of SNAP-PLA colocalization foci between new H3.3 and γH2A.X in EdU+ U2OS cells stably expressing wild-type (WT_1) or mutant H3.3-SNAP, or SNAP tag only as a control (empty). Mean ± SEM from three to seven independent experiments, with n > 130 per sample for each experiment. (C) Western blot analysis of input and capture samples from iPOND experiments performed in U2OS cells expressing wild-type (WT_1) or mutant H3.3-SNAP, synchronized in S phase and damaged with camptothecin (1 h, 1 μM). Click -, negative control (no biotin). Total protein stain shows the position of the streptavidin monomer, detectable at similar levels in all capture samples. Bar graphs depict H3.3-SNAP band intensity in capture samples relative to WT_1. Mean ± SEM from four independent experiments. (D) Immunofluorescence analysis of H4K20me2 levels at γH2A.X foci in EdU-positive U2OS cells stably expressing wild-type (WT_1) or mutant H3.3 and treated with camptothecin (3 h, 0.1 μM). Quantification of H4K20me2 intensity relative to WT_1. Mean ± SD from three independent experiments, with n > 17 per sample for each experiment. (E) Western blot analysis of input and capture samples from iPOND experiments performed in U2OS cells expressing SNAP-tagged wild-type (WT_1) or mutant H3.3, synchronized in S phase and damaged with camptothecin (1 h, 1 μM). Click -, negative control (no biotin). Bar graphs depict H4K20me2 band intensity in capture samples relative to WT_1. Mean ± SEM from three independent experiments. Statistical significance is calculated by paired t-test (A), one-way ANOVA (B–E). *P< 0.05; **P< 0.01; ***P< 0.001; ns: p> 0.05. Scale bars, 10 μm.
Figure 4.
Figure 4.
PNKP mediates aberrant NHEJ in H3.3 K27M and G34R mutant cells. (A) Identification of proteins associated with wild-type (WT) and mutant H3.3 (K27M, G34R) by proximity-dependent biotinylation (BioID) in HEK293 cells expressing BirA*-tagged H3.3 proteins. Volcano plots show interactors enriched (red) or depleted (blue) in H3.3 K27M (left) or G34R (right) samples compared to WT H3.3 sample, with each dot representing an interactor. Significant interactors whose log2 fold change is >1 and whose P-value is <0.05 (–log10P-value > 1.30) are highlighted in colors and common interactors between H3.3 K27M and G34R are shown in dark colors. Positive controls are depicted in green. (B) Western blot analysis of input and capture samples from iPOND experiments performed in U2OS cells expressing wild-type (WT_1) or mutant H3.3-SNAP, synchronized in S phase and damaged with camptothecin (1 h, 1 μM). Click –, negative control (no biotin). Total protein stain shows the position of the streptavidin monomer, detectable at similar levels in all capture samples. Bar graphs depict PNKP band intensity in capture samples relative to WT_1. Mean ± SEM from three independent experiments. The representative experiment shown is the same as in Figure 3C. (C) PNKP association with CPT-damaged replication forks analyzed by PLA between PNKP and γH2A.X in EdU-positive cells. A scheme of the experiment is shown on the left. Mean ± SEM from three independent experiments. (D) Analysis of NHEJ activity by random plasmid integration assay in U2OS cells stably expressing wild-type (WT_1) or mutant H3.3 and transfected with siRNAs against Luciferase (siLUC, control) or PNKP (siPNKP). Samples siLUC–, siLUC+ and siXRCC4+ are the same shown in Figure S2I graph. Western blot analysis shows siRNA efficiency (Tubulin, loading control). Vector –, negative untransfected control. (E) Scoring of radials in metaphase spreads of U2OS H3.3 G34R cells transfected with siRNA against Luciferase (siLUC, control) or PNKP (siPNKP) and treated with Mitomycin C (48 h, 25 ng/ml). The western blot shows siRNA efficiency (Actin, loading control). Mean ± SEM from four independent experiments, with n > 24 per sample for each experiment. (F) Proliferation curves of S. pombe strains expressing H3G34R, depleted for the core NHEJ factor Xrc4 (xrc4Δ) and for Pnk1 (pnk1Δ) and grown in the presence of camptothecin (5 μM). Statistical significance is calculated by one-way ANOVA (B–D), by non-linear regression analysis with a sigmoidal dose-response model (D). *P< 0.05; **P< 0.01; ***P< 0.001; ns: P> 0.05.
Figure 5.
Figure 5.
PNKP represents a therapeutic target in pediatric pHGG. (A) Proliferation assays in patient-derived pHGG cell lines harboring wild-type or mutant H3.3 and transfected with siRNAs against Luciferase (siLUC, control) or PNKP (siPNKP_1 and siPNKP_2). Mean ± SEM from n independent experiments. The western blots show siRNA efficiencies (Tubulin or total protein stain, loading control). (B) Proliferation assays in U2OS H3.3 G34R transfected with an siRNA against PNKP 3′UTR (siLUC, control) and expressing the indicated GFP-tagged constructs. Mean ± SEM from n independent experiments. The western blots show PNKP knock-down efficiency and the expression levels of each construct (Tubulin, loading control). (C) Current model depicting PNKP-mediated misrepair of S phase DNA damage in H3.3 K27M and G34R mutant cells (left) and the consequences of PNKP targeting in these cells (right). Statistical significance is calculated by a polynomial quadratic model (A, B). *P< 0.05; **P< 0.01; ***P< 0.001; ns: P> 0.05.

References

    1. Pinto L., Baidarjad H., Entz-Werlé N., Van Dyck E. Impact of chromatin dynamics and DNA repair on genomic stability and treatment resistance in pediatric high-grade gliomas. Cancers (Basel). 2021; 13:5678. - PMC - PubMed
    1. Lin K., Gueble S.E., Sundaram R.K., Huseman E.D., Bindra R.S., Herzon S.B. Mechanism-based design of agents that selectively target drug-resistant glioma. Science. 2022; 377:502–511. - PMC - PubMed
    1. Deshmukh S., Ptack A., Krug B., Jabado N. Oncohistones: a roadmap to stalled development. FEBS J. 2021; 289:1315–1328. - PMC - PubMed
    1. Schwartzentruber J., Korshunov A., Liu X.-Y., Jones D.T.W., Pfaff E., Jacob K., Sturm D., Fontebasso A.M., Quang D.-A.K., Tönjes M. et al. . Driver mutations in histone H3.3 and chromatin remodelling genes in paediatric glioblastoma. Nature. 2012; 482:226–231. - PubMed
    1. Wu G., Broniscer A., McEachron T.A., Lu C., Paugh B.S., Becksfort J., Qu C., Ding L., Huether R., Parker M. et al. . Somatic histone H3 alterations in pediatric diffuse intrinsic pontine gliomas and non-brainstem glioblastomas. Nat. Genet. 2012; 44:251–253. - PMC - PubMed

LinkOut - more resources