

Acute Coronary Syndrome Subphenotypes Based on Repeated Biomarker Measurements in Relation to Long-Term Mortality Risk
- PMID: 38214281
- PMCID: PMC10926784
- DOI: 10.1161/JAHA.123.031646
Acute Coronary Syndrome Subphenotypes Based on Repeated Biomarker Measurements in Relation to Long-Term Mortality Risk
Abstract
Background: We aimed to identify patients with subphenotypes of postacute coronary syndrome (ACS) using repeated measurements of high-sensitivity cardiac troponin T, N-terminal pro-B-type natriuretic peptide, high-sensitivity C-reactive protein, and growth differentiation factor 15 in the year after the index admission, and to investigate their association with long-term mortality risk.
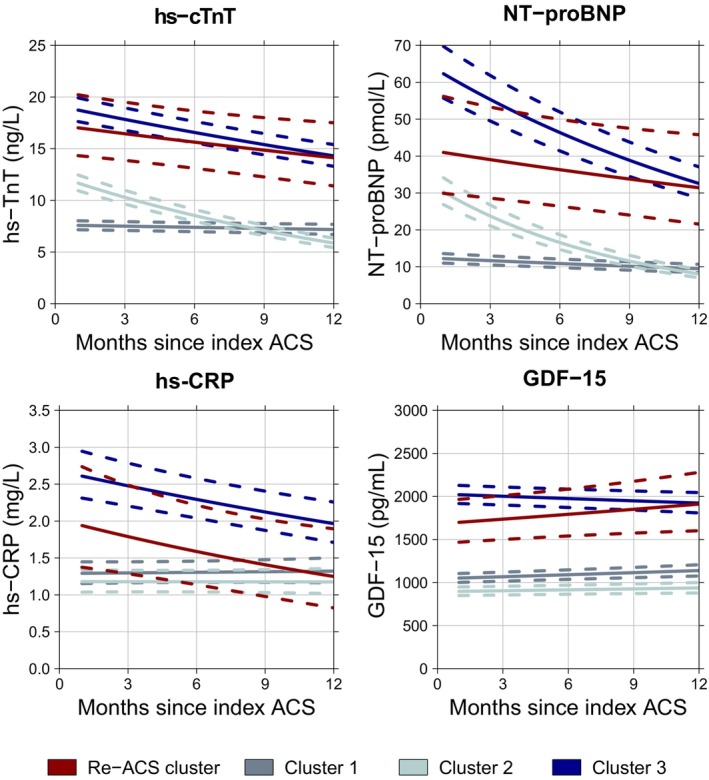
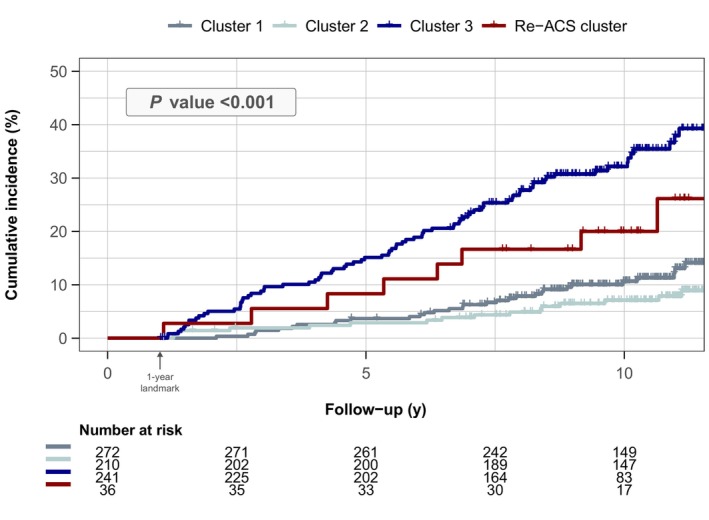
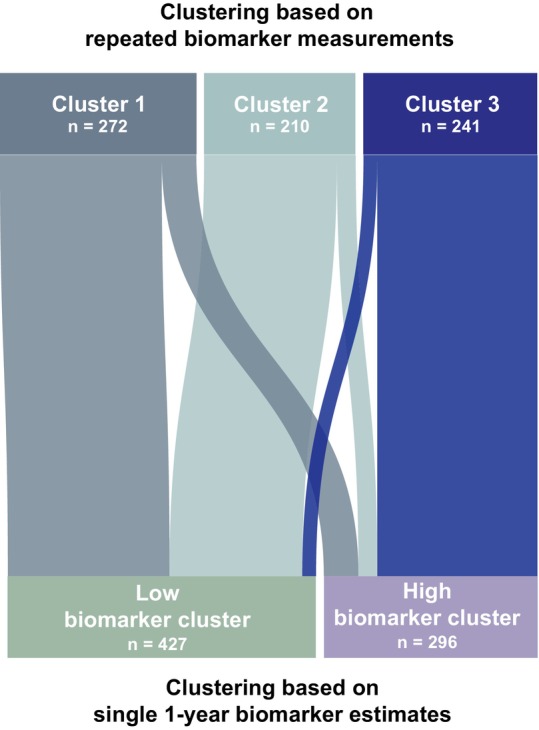
Methods and results: BIOMArCS (BIOMarker Study to Identify the Acute Risk of a Coronary Syndrome) was an observational study of patients with ACS, who underwent high-frequency blood sampling for 1 year. Biomarkers were measured in a median of 16 repeated samples per individual. Cluster analysis was performed to identify biomarker-based subphenotypes in 723 patients without a repeat ACS in the first year. Patients with a repeat ACS (N=36) were considered a separate cluster. Differences in all-cause death were evaluated using accelerated failure time models (median follow-up, 9.1 years; 141 deaths). Three biomarker-based clusters were identified: cluster 1 showed low and stable biomarker concentrations, cluster 2 had elevated concentrations that subsequently decreased, and cluster 3 showed persistently elevated concentrations. The temporal biomarker patterns of patients in cluster 3 were similar to those with a repeat ACS during the first year. Clusters 1 and 2 had a similar and favorable long-term mortality risk. Cluster 3 had the highest mortality risk. The adjusted survival time ratio was 0.64 (95% CI, 0.44-0.93; P=0.018) compared with cluster 1, and 0.71 (95% CI, 0.39-1.32; P=0.281) compared with patients with a repeat ACS.
Conclusions: Patients with subphenotypes of post-ACS with different all-cause mortality risks during long-term follow-up can be identified on the basis of repeatedly measured cardiovascular biomarkers. Patients with persistently elevated biomarkers have the worst outcomes, regardless of whether they experienced a repeat ACS in the first year.
Keywords: acute coronary syndrome; cardiovascular biomarkers; death; phenotypes; repeated measurements.
Figures
References
-
- Knuuti J, Wijns W, Saraste A, Capodanno D, Barbato E, Funck‐Brentano C, Prescott E, Storey RF, Deaton C, Cuisset T, et al. 2019 ESC Guidelines for the diagnosis and management of chronic coronary syndromes: the Task Force for the diagnosis and management of chronic coronary syndromes of the European Society of Cardiology (ESC). Eur Heart J. 2019;41:407–477. doi: 10.1093/eurheartj/ehz425 - DOI - PubMed
-
- Lindholm D, Lindbäck J, Armstrong PW, Budaj A, Cannon CP, Granger CB, Hagström E, Held C, Koenig W, Östlund O, et al. Biomarker‐based risk model to predict cardiovascular mortality in patients with stable coronary disease. J Am Coll Cardiol. 2017;70:813–826. doi: 10.1016/j.jacc.2017.06.030 - DOI - PubMed
-
- Lyngbæk S, Winkel P, Gøtze JP, Kastrup J, Gluud C, Kolmos HJ, Kjøller E, Jensen GB, Hansen JF, Hildebrandt P, et al. Risk stratification in stable coronary artery disease is possible at cardiac troponin levels below conventional detection and is improved by use of N‐terminal pro‐B‐type natriuretic peptide. Eur J Prev Cardiol. 2014;21:1275–1284. doi: 10.1177/2047487313492099 - DOI - PubMed
-
- Oemrawsingh RM, Akkerhuis KM, de Mulder M, Umans VA, Kietselaer B, Schotborgh C, Ronner E, Lenderink T, Liem A, Haitsma D, et al. High‐frequency biomarker measurements of troponin, NT‐proBNP, and C‐reactive protein for prediction of new coronary events after acute coronary syndrome. Circulation. 2019;139:134–136. doi: 10.1161/CIRCULATIONAHA.118.036349 - DOI - PubMed
Publication types
MeSH terms
Substances
LinkOut - more resources
Full Text Sources
Research Materials
