

The replication-competent HIV reservoir is a genetically restricted, younger subset of the overall pool of HIV proviruses persisting during therapy, which is highly genetically stable over time
- PMID: 38214547
- PMCID: PMC10878278
- DOI: 10.1128/jvi.01655-23
The replication-competent HIV reservoir is a genetically restricted, younger subset of the overall pool of HIV proviruses persisting during therapy, which is highly genetically stable over time
Abstract
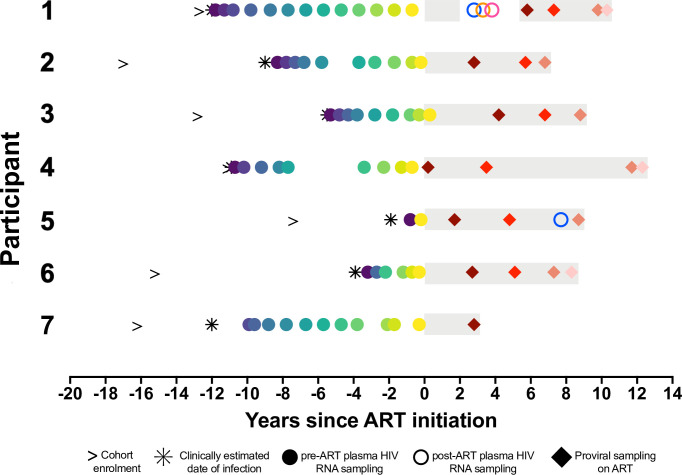
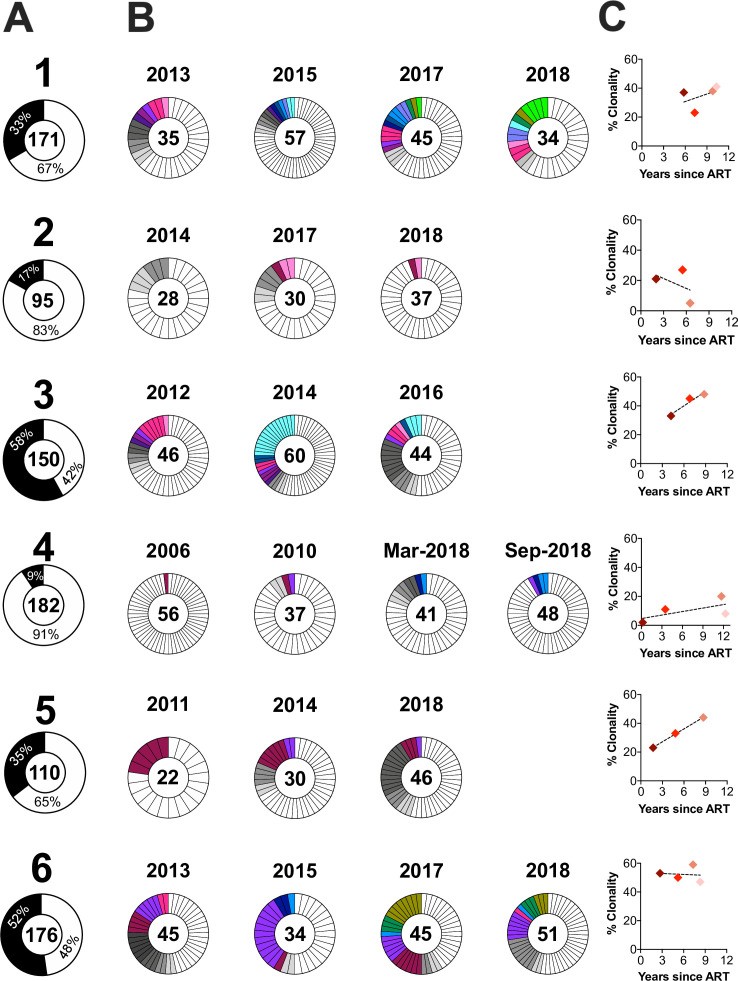
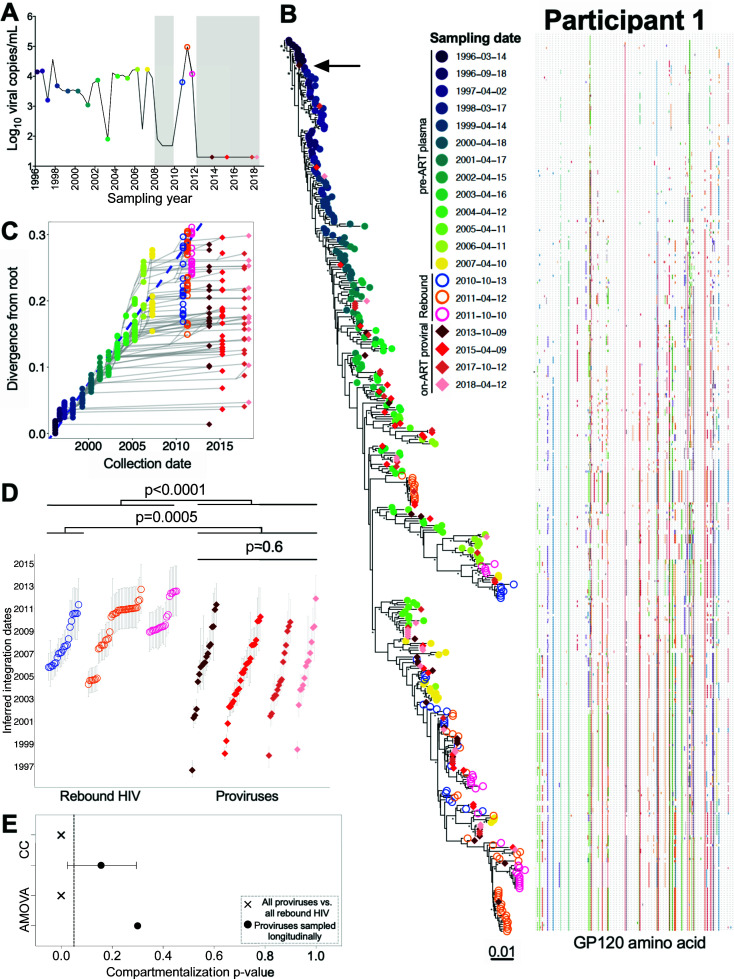
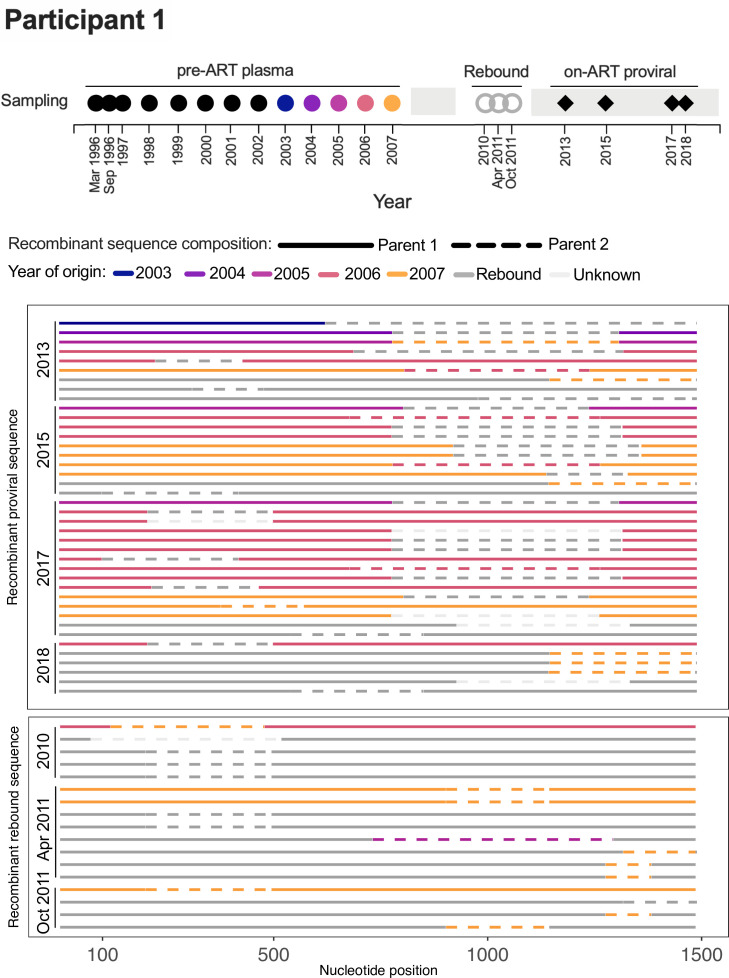
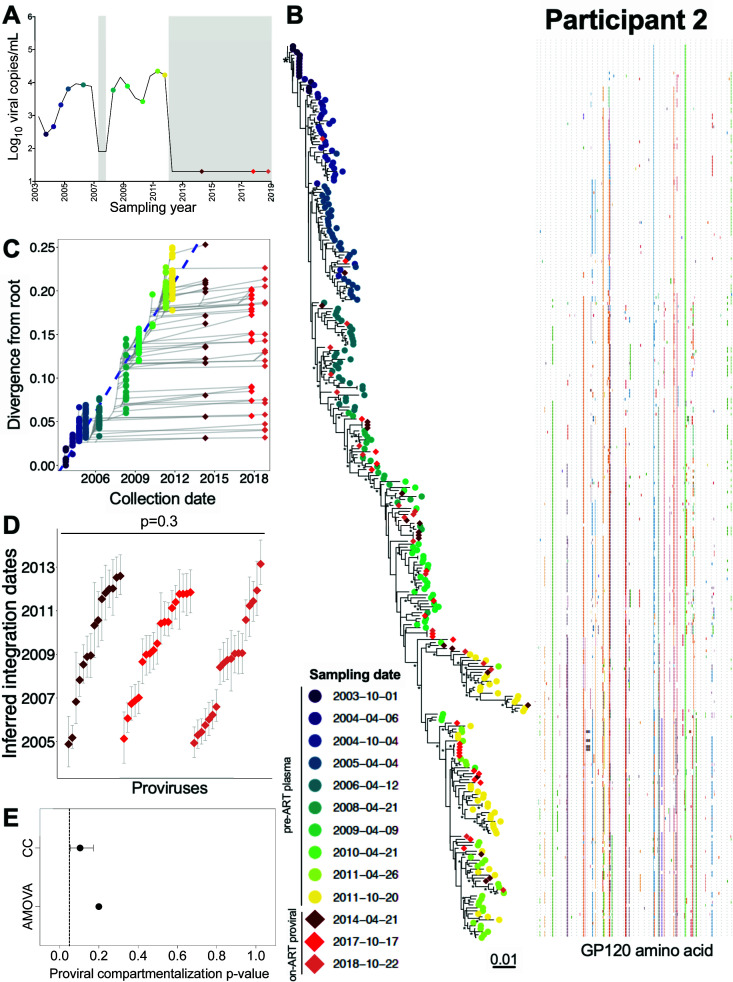
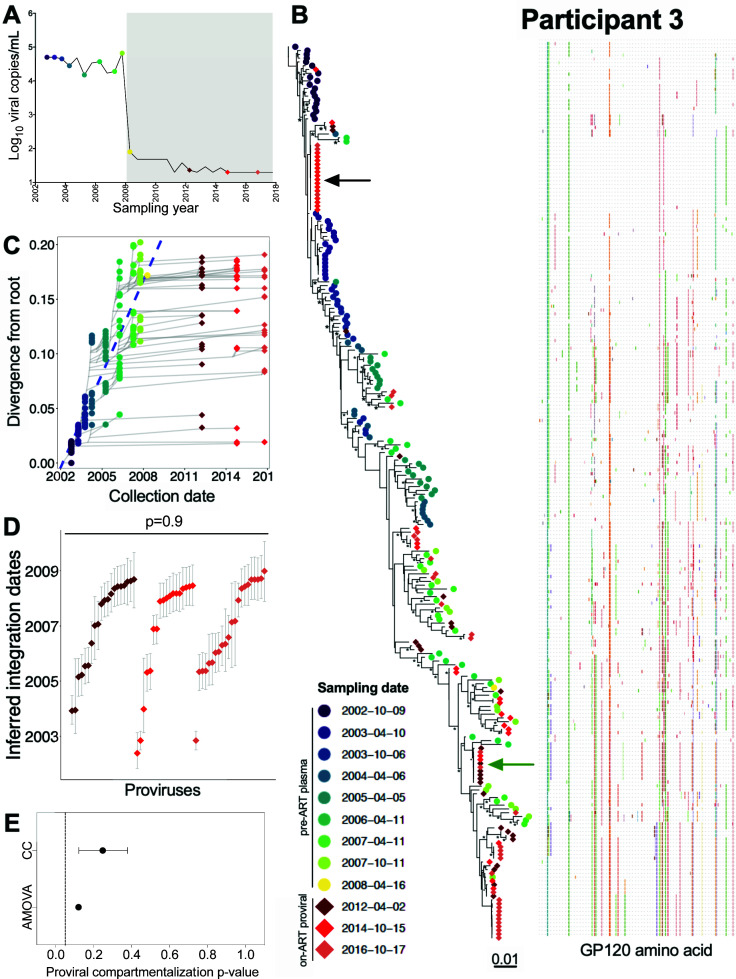
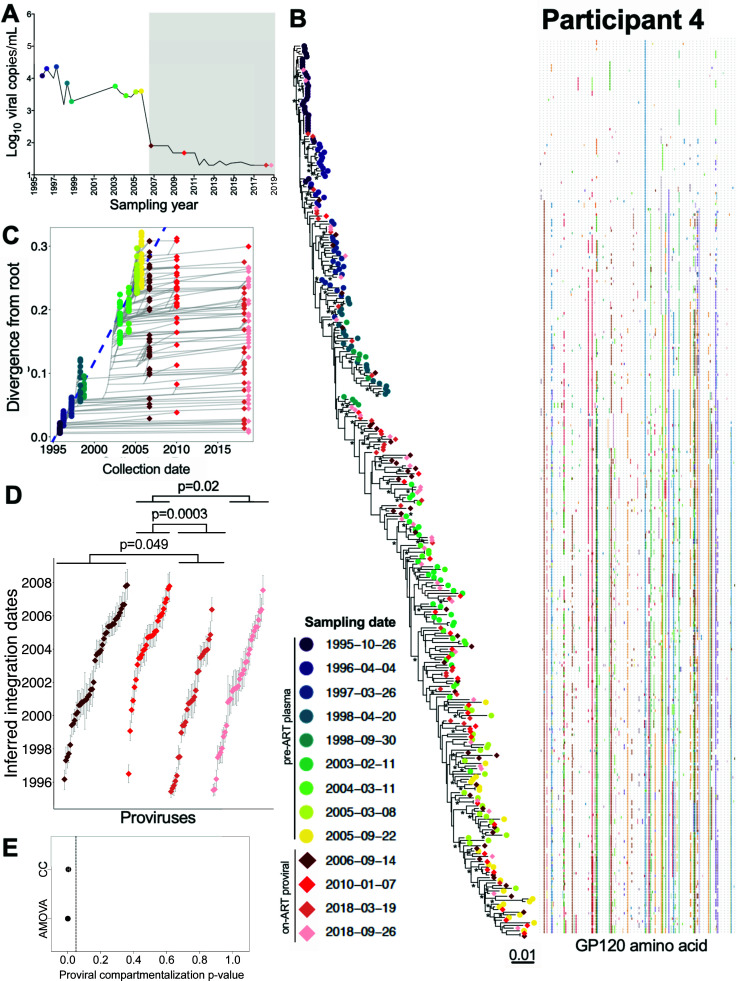
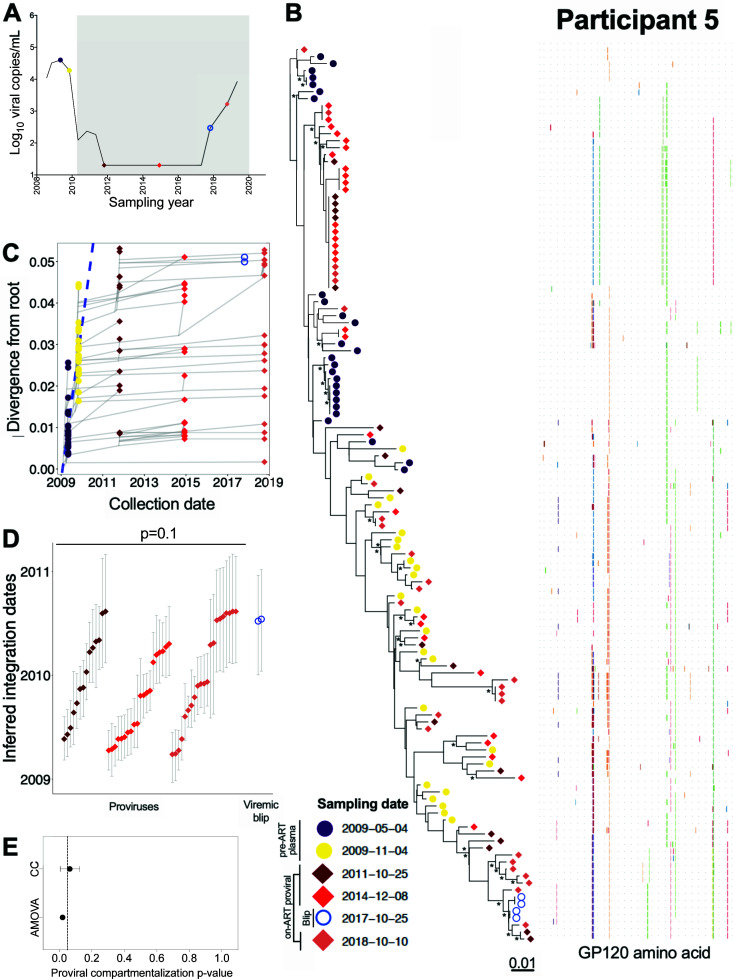
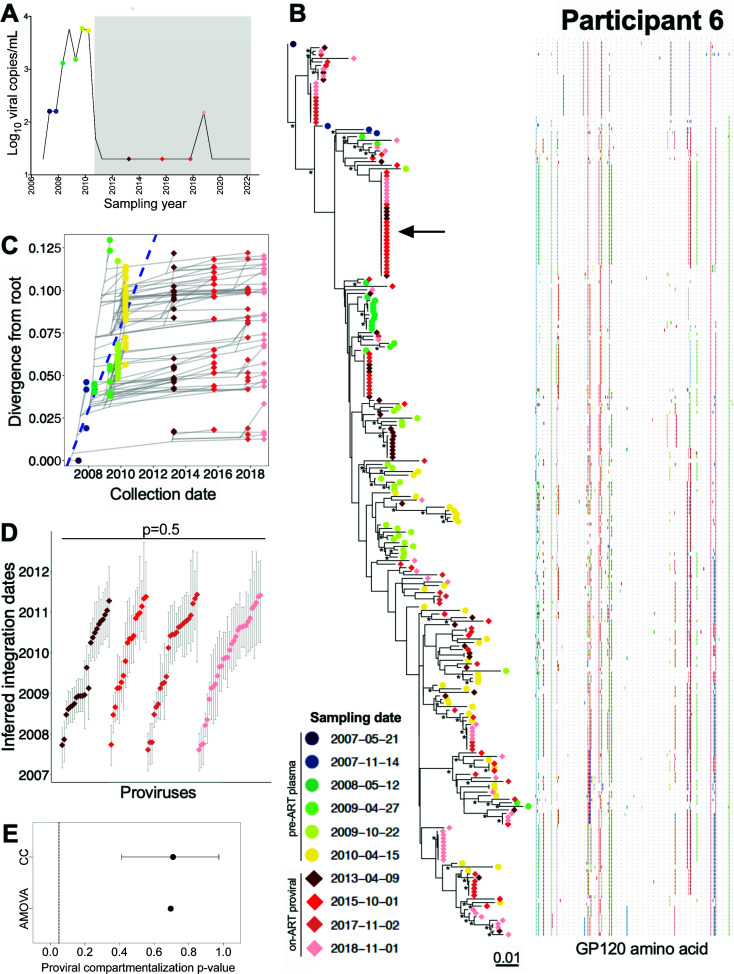
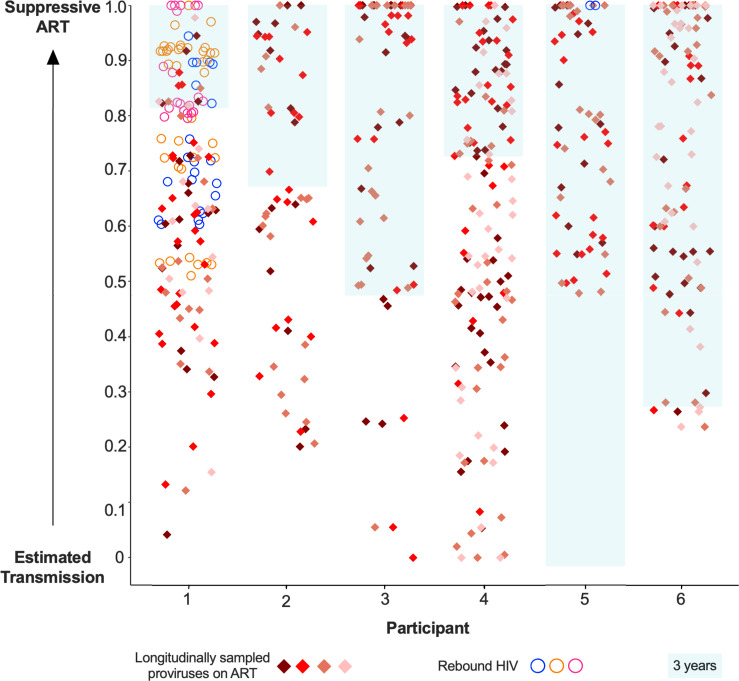
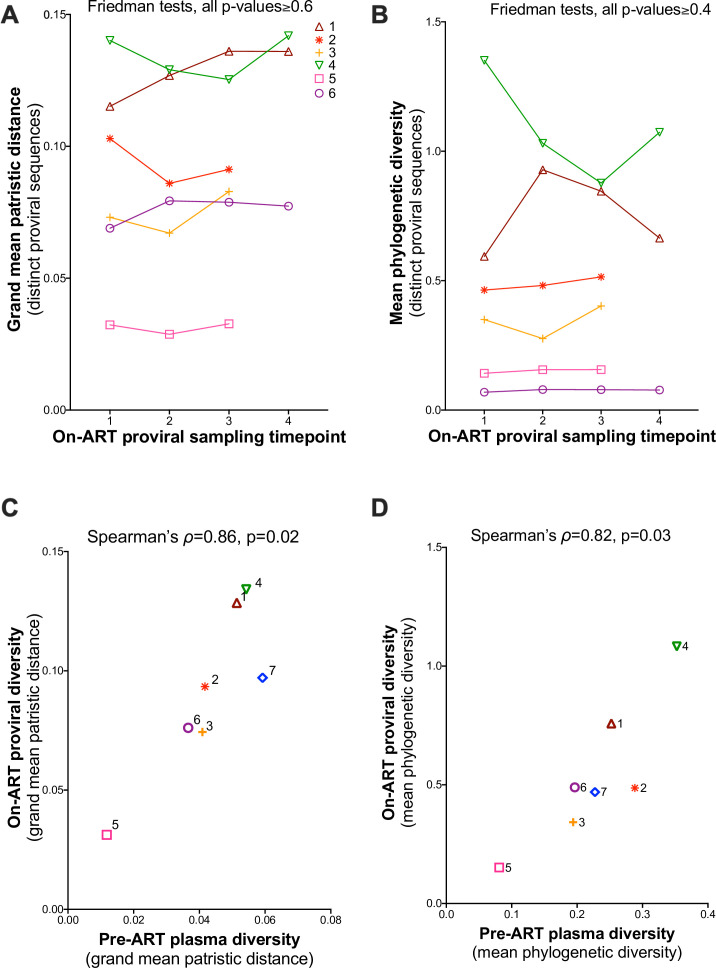
Within-host HIV populations continually diversify during untreated infection, and this diversity persists within infected cell reservoirs during antiretroviral therapy (ART). Achieving a better understanding of on-ART proviral evolutionary dynamics, and a better appreciation of how the overall persisting pool of (largely genetically defective) proviruses differs from the much smaller replication-competent HIV reservoir, is critical to HIV cure efforts. We reconstructed within-host HIV evolutionary histories in blood from seven participants of the Women's Interagency HIV Study who experienced HIV seroconversion, and used these data to characterize the diversity, lineage origins, and ages of proviral env-gp120 sequences sampled longitudinally up to 12 years on ART. We also studied HIV sequences emerging from the reservoir in two participants. We observed that proviral clonality generally increased over time on ART, with clones frequently persisting long term. While on-ART proviral integration dates generally spanned the duration of untreated infection, HIV emerging in plasma was exclusively younger (i.e., dated to the years immediately pre-ART). The genetic and age distributions of distinct proviral sequences remained stable during ART in all but one participant, in whom there was evidence that younger proviruses had been preferentially eliminated after 12 years on ART. Analysis of the gag region in three participants corroborated our env-gp120-based observations, indicating that our observations are not influenced by the HIV region studied. Our results underscore the remarkable genetic stability of the distinct proviral sequences that persist in blood during ART. Our results also suggest that the replication-competent HIV reservoir is a genetically restricted, younger subset of this overall proviral pool.IMPORTANCECharacterizing the genetically diverse HIV sequences that persist in the reservoir despite antiretroviral therapy (ART) is critical to cure efforts. Our observations confirm that proviruses persisting in blood on ART, which are largely genetically defective, broadly reflect the extent of within-host HIV evolution pre-ART. Moreover, on-ART clonal expansion is not appreciably accompanied by the loss of distinct proviral lineages. In fact, on-ART proviral genetic composition remained stable in all but one participant, in whom, after 12 years on ART, proviruses dating to around near ART initiation had been preferentially eliminated. We also identified recombinant proviruses between parental sequence fragments of different ages. Though rare, such sequences suggest that reservoir cells can be superinfected with HIV from another infection era. Overall, our finding that the replication-competent reservoir in blood is a genetically restricted, younger subset of all persisting proviruses suggests that HIV cure strategies will need to eliminate a reservoir that differs in key respects from the overall proviral pool.
Keywords: HIV; genetic stability; molecular dating; persistence; phylogenetics; rebound.
Conflict of interest statement
The authors declare no conflict of interest.
Figures
Update of
-
The replication-competent HIV reservoir is a genetically restricted, younger subset of the overall pool of HIV proviruses persisting during therapy, which is highly genetically stable over time.Res Sq [Preprint]. 2023 Aug 16:rs.3.rs-3259040. doi: 10.21203/rs.3.rs-3259040/v1. Res Sq. 2023. Update in: J Virol. 2024 Feb 20;98(2):e0165523. doi: 10.1128/jvi.01655-23. PMID: 37645749 Free PMC article. Updated. Preprint.
References
-
- Finzi D, Blankson J, Siliciano JD, Margolick JB, Chadwick K, Pierson T, Smith K, Lisziewicz J, Lori F, Flexner C, Quinn TC, Chaisson RE, Rosenberg E, Walker B, Gange S, Gallant J, Siliciano RF. 1999. Latent infection of CD4+ T cells provides a mechanism for lifelong persistence of HIV-1, even in patients on effective combination therapy. Nat Med 5:512–517. doi:10.1038/8394 - DOI - PubMed
-
- Finzi D, Hermankova M, Pierson T, Carruth LM, Buck C, Chaisson RE, Quinn TC, Chadwick K, Margolick J, Brookmeyer R, Gallant J, Markowitz M, Ho DD, Richman DD, Siliciano RF. 1997. Identification of a reservoir for HIV-1 in patients on highly active antiretroviral therapy. Science 278:1295–1300. doi:10.1126/science.278.5341.1295 - DOI - PubMed
-
- Gantner P, Buranapraditkun S, Pagliuzza A, Dufour C, Pardons M, Mitchell JL, Kroon E, Sacdalan C, Tulmethakaan N, Pinyakorn S, Robb ML, Phanuphak N, Ananworanich J, Hsu D, Vasan S, Trautmann L, Fromentin R, Chomont N. 2023. HIV rapidly targets a diverse pool of CD4+ T cells to establish productive and latent infections. Immunity 56:653–668. doi:10.1016/j.immuni.2023.01.030 - DOI - PMC - PubMed
Publication types
MeSH terms
Grants and funding
- UM1 AI164565/AI/NIAID NIH HHS/United States
- U01 HL146245/HL/NHLBI NIH HHS/United States
- U01 HL146208/HL/NHLBI NIH HHS/United States
- UL1 TR001409/TR/NCATS NIH HHS/United States
- KL2 TR001432/TR/NCATS NIH HHS/United States
- U01 HL146192/HL/NHLBI NIH HHS/United States
- U01 HL146242/HL/NHLBI NIH HHS/United States
- TL1 TR001431/TR/NCATS NIH HHS/United States
- U01 HL146193/HL/NHLBI NIH HHS/United States
- P30 AI124414/AI/NIAID NIH HHS/United States
- U01 HL146194/HL/NHLBI NIH HHS/United States
- U01 HL146241/HL/NHLBI NIH HHS/United States
- P30 AI027767/AI/NIAID NIH HHS/United States
- P30 AI050409/AI/NIAID NIH HHS/United States
- U01 HL146333/HL/NHLBI NIH HHS/United States
- U01 HL146205/HL/NHLBI NIH HHS/United States
- P30 MH116867/MH/NIMH NIH HHS/United States
- P30 AI073961/AI/NIAID NIH HHS/United States
- U01 HL146201/HL/NHLBI NIH HHS/United States
- U01 HL146204/HL/NHLBI NIH HHS/United States
- U01 HL146202/HL/NHLBI NIH HHS/United States
- UL1 TR001881/TR/NCATS NIH HHS/United States
- UL1 TR000004/TR/NCATS NIH HHS/United States
- U01 HL146240/HL/NHLBI NIH HHS/United States
- U01 HL146203/HL/NHLBI NIH HHS/United States
- UL1 TR003098/TR/NCATS NIH HHS/United States
- P30 AI050410/AI/NIAID NIH HHS/United States
- CIHR/Canada
LinkOut - more resources
Full Text Sources
Medical
