. 2024 Jan 12;81(1):33.
doi: 10.1007/s00018-023-05046-6.

G-quadruplex structural dynamics at MAPK12 promoter dictates transcriptional switch to determine stemness in breast cancer

Affiliations

G-quadruplex structural dynamics at MAPK12 promoter dictates transcriptional switch to determine stemness in breast cancer

Pallabi Sengupta et al. Cell Mol Life Sci. .

Abstract

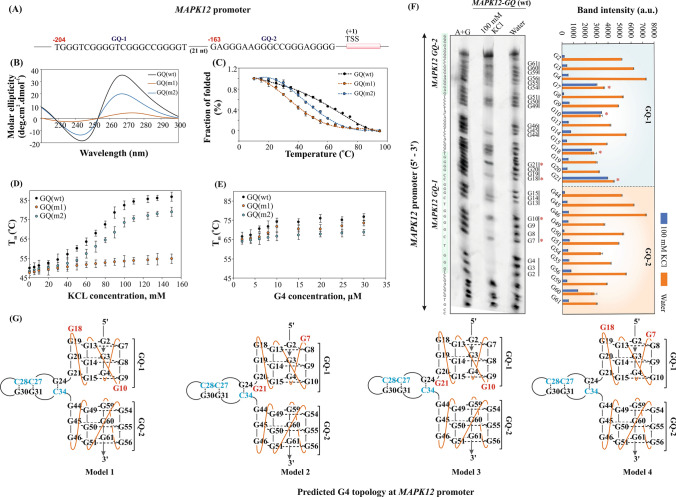
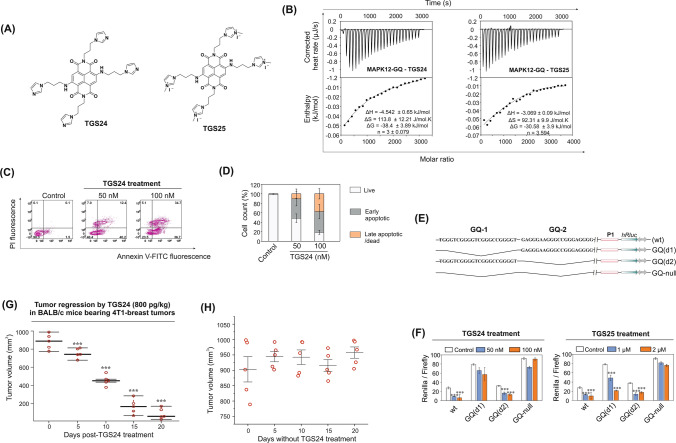
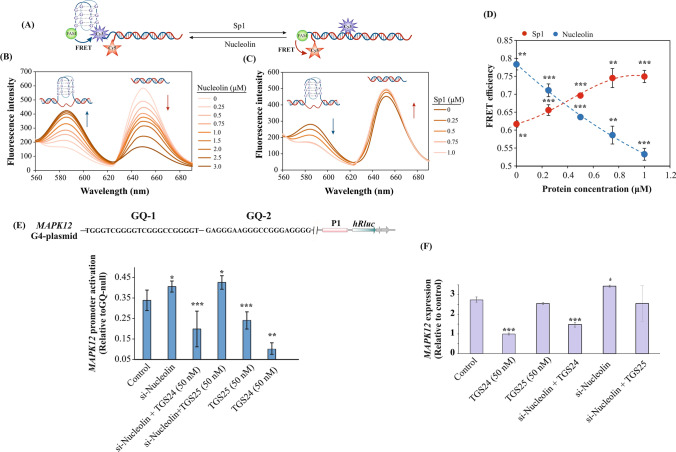
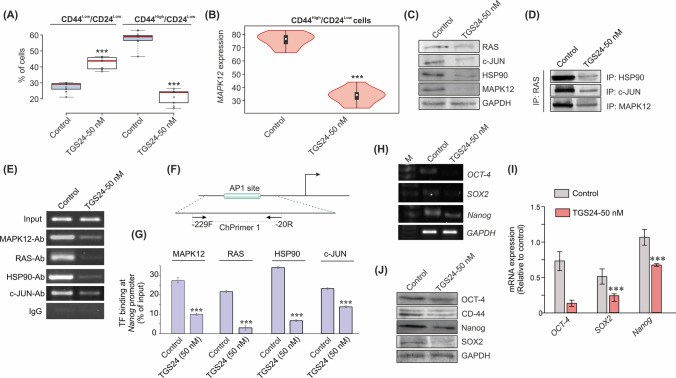
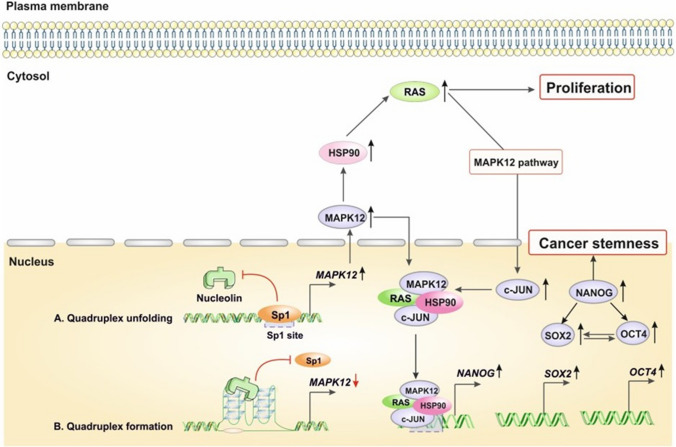
P38γ (MAPK12) is predominantly expressed in triple negative breast cancer cells (TNBC) and induces stem cell (CSC) expansion resulting in decreased survival of the patients due to metastasis. Abundance of G-rich sequences at MAPK12 promoter implied the functional probability to reverse tumorigenesis, though the formation of G-Quadruplex (G4) structures at MAPK12 promoter is elusive. Here, we identified two evolutionary consensus adjacent G4 motifs upstream of the MAPK12 promoter, forming parallel G4 structures. They exist in an equilibria between G4 and duplex, regulated by the binding turnover of Sp1 and Nucleolin that bind to these G4 motifs and regulate MAPK12 transcriptional homeostasis. To underscore the gene-regulatory functions of G4 motifs, we employed CRISPR-Cas9 system to eliminate G4s from TNBC cells and synthesized a naphthalene diimide (NDI) derivative (TGS24) which shows high-affinity binding to MAPK12-G4 and inhibits MAPK12 transcription. Deletion of G4 motifs and NDI compound interfere with the recruitment of the transcription factors, inhibiting MAPK12 expression in cancer cells. The molecular basis of NDI-induced G4 transcriptional regulation was analysed by RNA-seq analyses, which revealed that MAPK12-G4 inhibits oncogenic RAS transformation and trans-activation of NANOG. MAPK12-G4 also reduces CD44High/CD24Low population in TNBC cells and downregulates internal stem cell markers, arresting the stemness properties of cancer cells.

Keywords: Breast cancer; G-Quadruplex; MAPK12; Promoter; Stemness; Structural dynamics; Transcription regulation.


Conflict of interest statement

Authors declare no conflict of interest.

Figures

Fig. 1
Fig. 1
Identification of two putative G4-forming motifs at MAPK12 promoter. A Two adjacent G4-forming motifs, GQ-1 and GQ-2, mapped at −204 and −163 base pairs respectively upstream the transcription start site (TSS) of MAPK12 promoter, separated by 21 nt. B CD spectra of G4-forming motifs in presence of 100 mM KCl at pH 7.0 and 25 C temperature; GQ(wt), wild-type G4-forming motifs; GQ(m1), GQ-1 motif mutated; GQ(m2), GQ-2 motif mutated. C CD-melting curves of GQ(wt), GQ(m1), and GQ(m2) in presence of 100 mM KCl at pH 7.0 within a range of 10 C–95 °C temperature at 5 °C interval. Fraction of folded G4 calculated from the sigmoidal curves using the molar ellipticity values at 265 nm as a function of temperature. Error bars represent mean ± SE (N = 3). D KCl-dependency of G4-forming motifs; CD-Melting temperatures (Tm) of GQ(wt), GQ(m1), and GQ(m2) plotted against increasing concentrations of KCl at pH 7.0 and 25 °C. Error bars represent mean ± SE (N = 3). E Concentration-dependent G4-molecularity of GQ(wt), GQ(m1), and GQ(m2). CD-Melting temperatures (Tm) plotted against increasing concentrations of G4-DNA at pH 7.0 and 25 °C. Error bars represent mean ± SE (N = 3). F DMS protection assay using 74-nt long MAPK12 promoter sequence containing adjacently located GQ-1 and GQ-2 motifs in presence and absence of 100 mM KCl. Guanine residues in G-tetrads and loop elements are assigned based on the principle of DMS-mediated protection of N7 atoms in guanine bases required for G4-folding with respect to A + G ladder. Densitometric values defining the DMS-cleaved band intensities are provided in the bar plot. Error bars represent mean ± SE (N = 3). G2–G21 participate in GQ-1 formation; G44–G61 involved in GQ-2 folding. Red asterisks at G7 and G10 denote the propensity of guanines to occur in both tetrad core and loop elements. G Four predicted G4 topologies of GQ(wt) sequence at MAPK12 promoter determined by CD spectral profiles and DMS protection assays. Parallel G4 topologies of GQ-1 and GQ-2 with propeller loops (orange line) connected by a 21-nt spacer forming putative stem–loop structure
Fig. 2
Fig. 2
MAPK12-G4 binding selectivity and anticancer properties of naphthalene diimide compound. A Chemical formula of synthetic naphthalene diimide derivatives, TGS24 and another isogenic compound TGS25. B ITC profiles showing intermolecular interactions between wild-type MAPK12-GQ and TGS24, TGS25 in potassium phosphate buffer (pH 7.0) and 100 mM KCl at 25 °C temperature. Top panels: enthalpic heat released versus time at 25 °C during titrations. Bottom panels: thermogram of the integrated peak intensities plotted against the molar ratio of the complex. Thermodynamic parameters of intermolecular interactions (change in binding enthalpy (ΔH), entropy (ΔS), binding stoichiometry (n) and binding free energy (ΔG) are estimated from best-fit curves. C Flow cytometric analysis of apoptosis in MDAMB-231 cells by Annexin V-FITC-PI dual staining assay. 2 × 105 cells treated with TGS24 (50 nM and 100 nM) for 24 h. FITC: Fluorescein isothiocyanate; PI: Propidium iodide. In the typical flow cytometric quadrants, lower left quadrant (Annexin V-FITC negative/PI negative) denotes live cells, lower right quadrant (Annexin V-FITC positive/PI negative) denotes early apoptotic cells, upper quadrants (Annexin V-FITC positive/PI positive and Annexin V-FITC negative/PI positive) define late apoptotic and dead cells. D Percentage of live (Annexin V-FITC negative/PI negative), early apoptotic (Annexin V-FITC positive/PI negative), and late apoptotic/dead (Annexin V-FITC positive/PI positive and Annexin V-FITC negative/PI positive) cells calculated from flow cytometric analyses in MDAMB-231 cells treated with TGS24 (50 nM and 100 nM) for 24 h. Error bars represent mean ± SE (N = 3). E pGL4.72[hRlucCP] luciferase constructs having the inserts containing MAPK12 promoter sequences having both of wild-type G4-elements (wt), single-deletion of GQ-1 motif (GQ(d1)) or GQ-2 motif (GQ(d2)), and double-deletions of GQ-1 and GQ-2 (GQ-null) ahead of the hRluc coding region. The promoter sequences are cloned into KpnI and HindIII restriction sites. hRluc, Renilla luciferase gene; P1, promoter sequences. F Dual-luciferase assays. Evaluation of MAPK12 promoter activities using the luciferase constructs with or without the wild-type G4-forming sequences in MDAMB-231 cells. Promoter activities are determined by Renilla/Firefly luminescence values in control cells and cells treated with TGS24 (50 nM and 100 nM) and TGS25 (1 and 2 μM) for 24 h. Error bars represent mean ± SE (N = 3). Statistical differences in the luciferase activities compared to that of the control cells use two-tailed Student's t test (*P < 0.05, **P < 0.01, ***P < 0.001). G Tumor regression by TGS24 (800 pg per kg body weight) treatment and without treatment (H) in BALB/c mice (average body weight 25 g) bearing palpable 4T1-breast tumors. Tumor volume measured up to 21 days at a 5 days interval after tumor implantation. Statistical analyses of tumor regression compared to that of the 0th day post-TGS24 treatment use two-tailed Student's t test (*P < 0.05, **P < 0.01, ***P < 0.001)
Fig. 3
Fig. 3
Xenograft model of TNBC cell line MDAMB-231 in NUDE mice. A Schematics of xenografting procedure to establish tumor in NUDE mice and subsequent dissection procedures for histopathological and gene expression analysis. B Histopathological analysis of the prepared tissue sections of the major organs like kidney, liver and lungs by haematoxylin eosin staining and fixed slides imaged using inverted phase-contrast microscope. The major organs are isolated from TGS24 treated mouse and compared with the no treatment control group. C Gene expression analysis by real-time PCR for the various genes promoting stemness, metastasis and key drivers of oncogenesis. RNA isolated from the tumor tissue of xenografted mice model is used for the experiment. Relative gene expression with respect to GAPDH housekeeping gene. (*P < 0.05, **P < 0.01)
Fig. 4
Fig. 4
Nucleolin and Sp1 regulate G4 → duplex transition at MAPK12 promoter. A FRET probe. MAPK12-G4 motifs conjugated with 6-FAM at 5′-end of GQ-1 and internal Cy3 at T22. The complementary strand of G4-forming sequence contains Cy5 at 3′-end. G4-formation gives high FRET signal between 6-FAM and Cy3. Duplex formation gives high FRET signal between 6-FAM and Cy5. B Fluorometric titration of 90 nM FRET probe with increasing gradient of recombinant Nucleolin (0–3 µM) in 50 mM Tris–Cl, pH 7.0, 100 mM KCl at 15 °C at excitation wavelength (λex) of 497 nm. Decline of FRET signal at Cy5 emission ((λem) 650 nm) upon Nucleolin titration suggests disruption of duplex with concomitant increase of Cy3 emission ((λem) 595 nm) indicating G4 evolution. C Fluorometric titration of 90 nM FRET probe with increasing gradient of recombinant Sp1 (0–1 µM) in 50 mM Tris–Cl, pH 7.0, 100 mM KCl at 15 °C at excitation wavelength (λex) of 497 nm. Decline of FRET signal at Cy3 emission ((λem) 595 nm) upon Sp1 titration suggests G4 resolution with concomitant increase of Cy5 emission ((λem) 650 nm) indicating duplex transition. D FRET efficiency calculated following the equation: E = 1 – (IDA/ID); IDA and ID are the emission intensity of donor fluorophore in presence and absence of acceptor fluorophore respectively. Error bars represent mean ± SE (N = 3). Statistical differences are determined compared to the control by two-tailed Student's t test (*P < 0.05, **P < 0.01, ***P < 0.001). With increasing Sp1, distance between 6-FAM and Cy5 decreases. Nucleolin titration decreases the distance between 6-FAM and Cy3. The change in distances (r) between donor and acceptor fluorophore calculated by E = R06/(R06 + r6). R0 denotes Forster distance between donor and acceptor. The distance between 6-FAM and Cy3 decreased from 6.5 ± 0.1 nm (R0 = 6.5 nm) in the free DNA to 5.2 ± 0.1 nm in the complex with Nucleolin indicating G4 formation. The distance between 6-FAM and Cy5 decreased from 6.8 ± 0.2 in free DNA to 5.3 ± 0.3 under Sp1-bound conditions indicating duplex formation (E) pGL4.72[hRlucCP] luciferase constructs having the inserts containing MAPK12 promoter sequences having adjacent G4-elements (wild-type). Dual-luciferase assays. Evaluation of MAPK12 promoter activities in MDAMB-231 cells under the following conditions: siRNA knockdown of Nucleolin at 48 h and TGS24 (50 nM) treatment for 24 h, nucleolin-knockdown + TGS24 treatment, nucleolin knockdown + TGS25 treatment, and TGS24 and TGS25 treated alone separately Error bars represent mean ± SE (N = 3). Statistical differences in the luciferase activities compared to that of the control cells use two-tailed Student's t test (*P < 0.05, **P < 0.01, ***P < 0.001). Statistical differences in the luciferase activities in presence of TGS24-treated samples compared to that of cells, treated with recombinant Sp1 and Nucleolin, siRNA-knockdown of Nucleolin use two-tailed Student's t test (###P < 0.001). F RT-PCR analysis. Expression profile of MAPK12 transcripts from P1 promoter in MDAMB-231 cells under following conditions: TGS24 (50 nM) treatment for 24 h and siRNA knockdown of Nucleolin for 48 h, nucleolin-knockdown + TGS24 treatment, nucleolin knockdown + TGS25 treatment, and TGS25 treated alone separately. Quantification of the transcripts’ level relative to the control by qPCR analyses. Error bars represent mean ± SE (N = 3). Statistical differences are determined compared to the control by two-tailed Student's t test (*P < 0.05, **P < 0.01, ***P < 0.001). Statistical differences between recombinant Nucleolin-treated and Nucleolin-knockdown cells are determined by two-tailed Student's t test (###P < 0.001). GAPDH considered as housekeeping gene
Fig. 5
Fig. 5
Downstream effects of TGS24-treatment and its selective interaction with MAPK12-G4 motifs. A RNAseq analyses of TGS24 treatment in MDAMB-231 spheres expressing high MAPK12. Heatmap of biological replicates of differentially expressed genes upon 24 h treatment of 50 nM TGS24 treatment in MDAMB-231 spheres using the log10(count) values for each replicate. The screening threshold for the differentially expressed genes is set to: |log2(Fold Change)|> 1 and P value < 0.05. Differential expression of the transcripts clustered by Euclidean correlation, with distinct upregulation, unaltered, and downregulation patterns in expression for TGS24 treatment, compared to control condition. The count values are colour coded blue to yellow to red in increasing order. Differentially expressed genes are clustered based on their involvement with RAS, apoptosis, and stemness- and metastasis-related pathways. B RT-qPCR-verification of RNAseq data for differentially expressed genes in RAS pathway upon 50 nM TGS24 treatment in MDAMB-231 spheres for 24 h: MAP4K3, RAS, MAPK12, c-FOS, c-JUN, HSP90. Quantification of the transcripts’ level relative to the control by qPCR analyses. Error bars represent mean ± SE (N = 3). Statistical differences are determined compared to the control by two-tailed Student's t test (*P < 0.05, **P < 0.01, ***P < 0.001). GAPDH considered as housekeeping gene. C RT-qPCR-verification of RNAseq data for differentially expressed genes in metastasis and stemness-related pathway upon 50 nM TGS24 treatment in MDAMB-231 spheres for 24 h: ALDHβ1, WNT-1, β-Catenin, SOX2, MMP12, Vimentin, CD-44. Quantification of the transcripts’ level relative to the control by qPCR analyses. Error bars represent mean ± SE (N = 3). Statistical differences are determined compared to the control by two-tailed Student's t test (*P < 0.05, **P < 0.01, ***P < 0.001). GAPDH considered as housekeeping gene. D RT-qPCR-verification of RNAseq data for differentially expressed genes in apoptotic pathway upon 50 nM TGS24 treatment in MDAMB-231 spheres for 24 h: NF-κβ, Sp1, GATA3, CASP9, PARP-1. Quantification of the transcripts’ level relative to the control by qPCR analyses. Error bars represent mean ± SE (N = 3). Statistical differences are determined compared to the control by two-tailed Student's t test (*P < 0.05, **P < 0.01, ***P < 0.001). GAPDH considered as housekeeping gene. E Correlation of log2(fold-change) values from RNA-Seq and RT-PCR analysis. The R2 value is 0.854. F Interaction network of upregulated and downregulated genes, obtained using STRING database, with the minimum required interaction score of 0.400 and network edges representing evidence of an interaction
Fig. 6
Fig. 6
Stabilization of MAPK12-G4 motifs by TGS24 enhances stemness-markers via HSP90-RAS-c-JUN-NANOG axis. A Flow cytometric analyses of CD44 and CD24 expression in MDAMB-231 spheres upon TGS24 (50 nM) treatment for 24 h. Box and whisker plot displays the percentage of CD44 low/CD24low and CD44high /CD24 low population upon TGS24 (50 nM) treatment for 24 h. Error bars represent mean ± SE (N = 3). Statistical differences are determined compared to the control by two-tailed Student's t test (*P < 0.05, **P < 0.01, ***P < 0.001). B Violin plot showing MAPK12 expression in CD44high /CD24low population upon TGS24 (50 nM) treatment for 24 h. Error bars represent mean ± SE (N = 3). Statistical differences are determined compared to the control by two-tailed Student's t test (*P < 0.05, **P < 0.01, ***P < 0.001). C Western blot analyses of the proteins in RAS pathway: RAS, c-JUN, HSP90, MAPK12 under TGS24 (50 nM) treatment for 24 h in MDAMB-231 spheres. GAPDH considered as housekeeping protein. D Co-immunoprecipitation analysis showing tetrameric complex of RAS, HSP90, MAPK12, and c-JUN. MDAMB-231 spheres that express RAS, are subjected to immunoprecipitation (IP) with anti-RAS antibody and to immunoblotting (IB) with anti-HSP90, anti-c-JUN, and anti-MAPK12 antibodies upon TGS24 (50 nM) treatment for 24 h. E ChIP analyses. ChIP results using anti-RAS, anti-HSP90, anti-c-JUN, and anti-MAPK12 antibodies suggesting MAPK12, c-JUN, RAS, and HSP90 enrichment at NANOG promoter under TGS24 (50 nM) treatment for 24 h in MDAMB-231 spheres. F Schematic representation of NANOG promoter region (AP1 site). Transcription initiation site is marked with an arrow. Position of the ChIP primers used in semi-quantitative and Real-time PCR reactions following immunoprecipitation is indicated. Input fraction indicates total DNA; negative control immunoprecipitation uses rabbit IgG showing no signal. G Quantification of MAPK12, RAS, c-JUN, and HSP90 binding at NANOG promoter by percentage of input method based on quantitative real-time PCR under aforementioned conditions. Error bars represent mean ± SE (N = 3). Statistical differences are determined by one-way ANOVA followed by Tukey–Kramer test (*P < 0.05, **P < 0.01, ***P < 0.001). H RT-PCR analyses. Expression profile of OCT-4, SOX2, and NANOG transcripts upon the treatment of TGS24 (50 nM) treatment for 24 h in MDAMB-231 spheres. I Quantification of the transcripts’ level of OCT-4, SOX2, and NANOG relative to the control by qPCR analyses. Error bars represent mean ± SE (N = 3). Statistical differences are determined compared to the control by two-tailed Student's t test (*P < 0.05, **P < 0.01, ***P < 0.001). J Western blot analyses of OCT-4, SOX2, CD-44, and NANOG upon the treatment of TGS24 (50 nM) treatment for 24 h in MDAMB-231 spheres
Fig. 7
Fig. 7
Dynamics of two tandem G4-motifs at MAPK12 promoter regulated by spatiotemporal binding of Nucleolin and Sp1 regulate cancer stemness via MAPK12-HSP90-RAS-c-JUN-NANOG axis

Similar articles

References

    1. Lee JC, Laydon JT, McDonnell PC, Gallagher TF, Kumar S, Green D, McNulty D, Blumenthal MJ, Heys JR, Landvatter SW, et al. A protein kinase involved in the regulation of inflammatory cytokine biosynthesis. Nature. 1994;372:739–746. doi: 10.1038/372739a0. - DOI - PubMed
    1. Cuadrado A, Nebreda AR. Mechanisms and functions of p38 MAPK signalling. Biochem J. 2010;429:403–417. doi: 10.1042/BJ20100323. - DOI - PubMed
    1. Yin N, Qi X, Tsai S, Lu Y, Basir Z, Oshima K, Thomas JP, Myers CR, Stoner G, Chen G. p38gamma MAPK is required for inflammation-associated colon tumorigenesis. Oncogene. 2016;35:1039–1048. doi: 10.1038/onc.2015.158. - DOI - PubMed
    1. Xu M, Wang S, Wang Y, Wu H, Frank JA, Zhang Z, Luo J. Role of p38gamma MAPK in regulation of EMT and cancer stem cells. Biochim Biophys Acta Mol Basis Dis. 2018;1864:3605–3617. doi: 10.1016/j.bbadis.2018.08.024. - DOI - PMC - PubMed
    1. Fang Y, Wang J, Wang G, Zhou C, Wang P, Zhao S, Zhao S, Huang S, Su W, Jiang P, et al. Inactivation of p38 MAPK contributes to stem cell-like properties of non-small cell lung cancer. Oncotarget. 2017;8:26702–26717. doi: 10.18632/oncotarget.15804. - DOI - PMC - PubMed

MeSH terms

Substances