. 2024 Jul 19;79(1):177-188.
doi: 10.1093/cid/ciae014.

Time Trends in Causes of Death in People With HIV: Insights From the Swiss HIV Cohort Study

Collaborators, Affiliations

Time Trends in Causes of Death in People With HIV: Insights From the Swiss HIV Cohort Study

M S R Weber et al. Clin Infect Dis. .

Abstract

Background: Advancements in access to antiretroviral therapy (ART) and human immunodeficiency virus (HIV) care have led to a decline in AIDS-related deaths among people with HIV (PWH) in Switzerland. However, data on the ongoing changes in causes of death among PWH over the past 15 years are scarce.

Methods: We investigated all reported deaths in the Swiss HIV Cohort Study between 2005 and 2022. Causes of death were categorized using the Coding Causes of Death in HIV protocol. The statistical analysis included demographic stratification to identify time trends and logistic regression models to determine associated factors for the underlying cause of death.

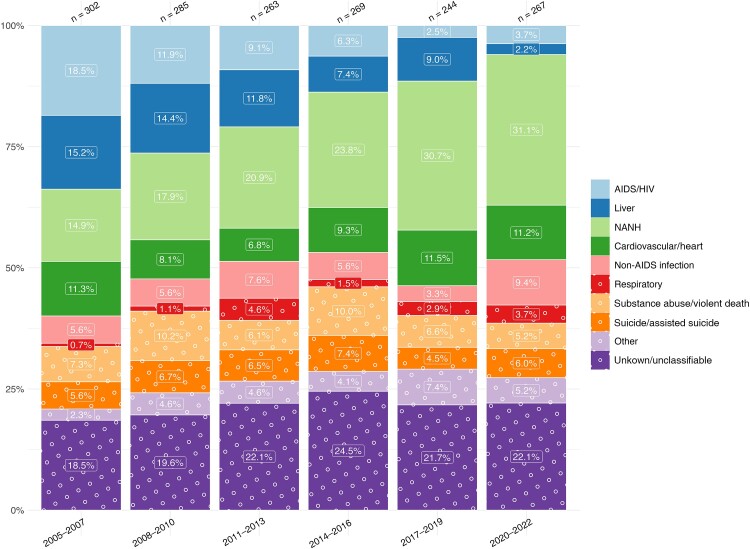
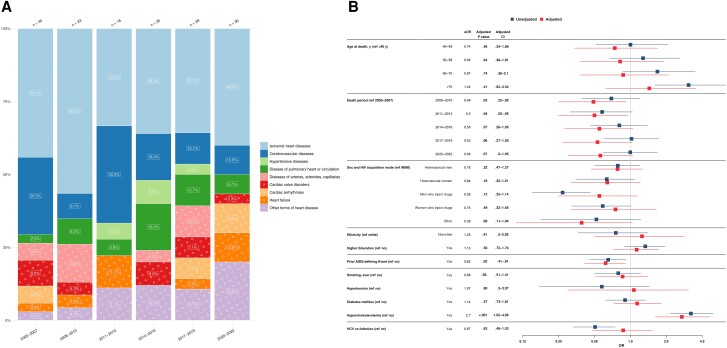
Results: In total, 1630 deaths were reported, with 23.7% of individuals assigned female sex at birth. These deaths included 147 (9.0%) HIV/AIDS-related deaths, 373 (22.9%) due to non-AIDS, non-hepatic cancers, 166 (10.2%) liver-related deaths, and 158 (9.7%) cardiovascular-related deaths. The median age at death (interquartile range) increased from 45.0 (40.0-53.0) years in 2005-2007 to 61.0 (56.0-69.5) years in 2020-2022. HIV/AIDS- and liver-related deaths decreased, whereas deaths from non-AIDS, non-hepatic cancers increased and cardiovascular-related deaths remained relatively stable.

Conclusions: The proportionally decreasing HIV/AIDS and liver-related deaths showcase the effectiveness of ART, comprehensive HIV patient care, and interventions targeting hepatitis C virus coinfection. Future research should focus on managing cancer and cardiovascular-related conditions as the new leading causes of death among PWH. Comprehensive healthcare strategies focusing on non-AIDS-related comorbid conditions, cancer management, and sustaining liver and cardiovascular health are needed to bridge the ongoing health disparities between PWH and the general population.

Keywords: HIV/AIDS; cancer; cardiovascular risk; cause of death; hepatitis.


Conflict of interest statement

Potential conflicts of interest . M. S. R. W. has received conference travel grants from Gilead. J. J. D. R. has received educational research grants to their institution from Gilead Sciences and ViiV healthcare, unrelated to the present work. M. H. received travel grants from Gilead Science, ViiV Healthcare and MSD; lecture honoraria for conference report from Gilead Science and ViiV Healthcare; and payment for expert testimony from ViiV Healthcare and Gilead Science, all unrelated to the present work. M. C.'s institution received research grants from Gilead, MSD and ViiV healthcare; reports payment for expert testimony from MSD, Gilead, and ViiV; and travel grants from Gilead. E. B's institution received a research grant from MSD, fees for E. B.'s participation on advisory boards and/or travel grants from Gilead, ViiV, MSD, AbbVie, Pfizer, AstraZeneca, Moderna, and Ely Lilly; E. B. also reports consulting fees from Moderna and payment or honoraria from Pfizer. E. H. received financial support for attending meetings from Gilead Sciences, ViiV healthcare, and AstraZeneca; the travel grants were paid to her institution. H. F. received educational grants from ViiV, MSD, AbbVie, Gilead, Sandoz, AstraZeneca and Pfizer, paid to his institution. M. S. received money for advisory boards and/or travel grants from Gilead, ViiV, and MSD, paid to his institution, and reports an unpaid leadership or fiduciary role with the SHCS. P. S.'s institution has received travel grants, congress, and advisory fees from ViiV and Gilead, unrelated to the present work. D. H. has received consultancies from AstraZeneca, Gilead, ViiV Healthcare, and Bavarian Nordic, as well as institutional funding from AbbVie, AstraZeneca, Gilead, GSK, MSD, Pfizer, Roche, ViiV Healthcare; reports support for travel and/or attending meetings from Gilead; and reports leadership or fidicuary roles with Patient Focused Medicines Development (PFMD) and Positive Council Switzerland. D. L. B. reports honoraria for advisory boards or speaker lectures, paid to himself, from Gilead, MSD, Pfizer, and ViiV and support for attending meetings and/or travel from Gilead and ViiV, unrelated to the present work. H. F. G. has received honoraria for data and safety monitoring board or advisory board membership from Merck, Gilead Sciences, ViiV Healthcare, GSK, Janssen, Johnson & Johnson, and Novartis and a travel grant from Gilead Sciences. He also reports unrestricted research grants from Gilead Sciences; grants or contracts paid to his institution from the Swiss National Science Foundation, the SCHS, and the National Institutes of Health; and unrestricted research grants from Gilead sciences and the Yvonne Jacob Foundation. All other authors report no potential conflicts All authors have submitted the ICMJE Form for Disclosure of Potential Conflicts of Interest. Conflicts that the editors consider relevant to the content of the manuscript have been disclosed.

Figures

Figure 1
Figure 1
Time trends in causes of death from 2005 to 2022, stratified by 3-year periods. Single causes of death are categorized into broader categories as outlined in Table 1. The x-axis includes time periods from 2005 to 2022, grouped into 3-year intervals; y-axis, the percentage distribution for each cause-of-death category; number above bar, the total reported deaths for the corresponding 3-year period. Abbreviations: HIV, human immunodeficiency virus; NANH, non-AIDS, non-hepatic.
Figure 2.
Figure 2.
A, Time trends in human immunodeficiency virus (HIV)/AIDS–related causes of death from 2005 to 2022, stratified by 3-year periods. Single causes of death are categorized into broader categories, as outlined in Table 1, and further grouped into infectious causes (red), cancers (blue), and other conditions (orange). The x-axis includes time periods from 2005 to 2022, grouped into 3-year intervals; y-axis, the percentage distribution for each cause-of-death category; numbers above bars, the total reported deaths for the corresponding 3-year period. The number within each bar represents the percentage of each cause of death within its respective 3-year interval. B, Factors associated with HIV/AIDS-related causes of death. The y-axis includes all factors included in the multivariable/adjusted logistic regression analysis (red) based on their statistical significance in the univariable/unadjusted logistic regression analysis (blue) as well as clinical relevance; the x-axis, the odds for each factor, compared with its reference (ref) factor, of dying of an HIV/AIDS-related cause of death compared with any other cause of death. Exercise caution when interpreting this analysis, since certain factors may influence various causes of death, while others may specifically increase the odds of one particular cause of death. Definitions for all variables used in the univariable analysis are available in Table 2. Single death causes are categorized into broader causes, as outlined in Table 1. Abbreviations: aOR, adjusted odds ratio; ART, antiretroviral therapy; AUC, area under the curve; CI, confidence interval; MSM, men who have sex with men; NHL, non-Hodgkin lymphoma; OR, odds ratio; PCP, Pneumocystis jirovecii pneumonia; PML, progressive multifocal leukoencephalopathy.
Figure 3.
Figure 3.
A, Time trends in causes of death grouped by hepatitis C virus (HCV) status from 2005 to 2022, stratified by 3-year periods. Single causes of death are categorized into broader categories as outlined in Table 1. Left, Time trends in causes of death among individuals without HCV coinfection. Right, Time trends in causes of death among individuals with HCV coinfection, defined as s positive HCV RNA result at any follow-up. The x-axis includes 3-year intervals from 2005 to 2022; y-axis; percentage distribution of each cause of death category; numbers above bars, the total reported deaths for the corresponding 3-year period. The number within each bar indicates the percentage of each cause of death within its respective 3-year period. B, Factors associated with liver-related causes of death. The y-axis includes all factors included in the multivariable/adjusted logistic regression analysis (red), based on their statistical significance in the univariable/unadjusted logistic regression analysis (blue) as well as clinical relevance; the x-axis, the odds for each factor, compared with its reference (ref) factor, of dying of a liver-related cause of death compared with any other cause. Exercise caution when interpreting this analysis, since certain factors may influence various causes of death, while others may specifically increase the odds of one particular cause of death. Definitions for all variables used in the univariable analysis are available in Table 2. Single death causes are categorized into broader causes. as outlined in Table 1. Abbreviations: aOR, adjusted odds ratio; ART, antiretroviral therapy; CI, confidence interval; CMV, cytomegalovirus; HBV, hepatitis B virus; HIV, human immunodeficiency virus; MSM, men who have sex with men; NANH, non-AIDS, nonhepatic; OR, odds ratio.
Figure 4.
Figure 4.
A, Time trends in non-AIDS, nonhepatic (NANH) cancer–related causes of death from 2005 to 2022, stratified by 3-year periods. Single causes of death are categorized into broader categories, as outlined in Table 1. The x-axis includes 3-year intervals from 2005–2022; y-axis, the percentage distribution for each cause of death; numbers above bars, total reported deaths for the corresponding 3-year period. The number within each bar indicates the percentage for each cause of death within its 3-year interval. B, Factors associated with NANH cancer–related causes of death. The y-axis includes all factors included in the multivariable/adjusted logistic regression analysis (red), based on their statistical significance and the univariable/unadjusted logistic regression analysis (blue) and clinical relevance. The x-axis shows the odds for each factor, compared with its reference factor (ref), of dying of an NANH cancer–related cause of death compared with any other causes of death. Exercise caution when interpreting this analysis, since certain factors may influence various causes of death, while others may specifically increase the odds of one particular death cause. Definitions for all variables used in the univariable analysis are available in Table 2. Single death causes are categorized into broader causes, as outlined in Table 1. Abbreviations: aOR, adjusted odds ratio: ART, antiretrovial therapy; AUC, area under the curve; CI, confidence interval; HCV, hepatitis C virus; HIV, human immunodeficiency virus; OR, odds ratio.
Figure 5.
Figure 5.
A, Cardiovascular/heart-related causes of death from 2005 to 2022, stratified by 3-year periods. Single causes of death are grouped into broader categories as outlined in Table 1. The x-axis includes the 3-year intervals spanning from 2005 to 2022; y-axis, the percentage distribution for each cause of death; numbers above bars, the total reported deaths for the corresponding 3-year period. The number within each bar represents the percentage of each cause of death within its respective 3-year interval. B, Factors associated with cardiovascular/heart-related causes of death. The y-axis includes all factors in the multivariable/adjusted logistic regression analysis (red), based on their statistical significance in the univariable/unadjusted logistic regression analysis (blue) as well as clinical relevance; x-axis, the odds for each factor, compared with its reference factor (ref), of dying of a cardiovascular/heart-related cause of death compared with any other causes of death. Exercise caution when interpreting this analysis, since certain factors may influence various causes of death, while others may specifically increase the odds of one particular cause of death. Definitions for all variables used in the univariable analysis are available in Table 2. Single death causes are categorized into broader causes, as outlined in Table 1. Abbreviations: aOR, odds ratio; CI, confidence interval HCV, hepatitis C virus; HIV, human immunodeficiency virus; MSM, men who have sex with men; OR, odds ratio.

Similar articles

Cited by

References

    1. Weber R, Ruppik M, Rickenbach M, et al. Decreasing mortality and changing patterns of causes of death in the Swiss HIV Cohort Study. HIV Med 2013; 14:195–207. - PubMed
    1. Trickey A, Sabin CA, Burkholder G, et al. Life expectancy after 2015 of adults with HIV on long-term antiretroviral therapy in Europe and North America: a collaborative analysis of cohort studies. Lancet HIV 2023; 10:e295–307. - PMC - PubMed
    1. Marcus JL, Leyden WA, Alexeeff SE, et al. Comparison of overall and comorbidity-free life expectancy between insured adults with and without HIV infection, 2000–2016. JAMA Netw Open 2020; 3:e207954. - PMC - PubMed
    1. Trickey A, McGinnis K, John Gill M, et al. Causes of death among adults with HIV on ART in Europe and North America: 1996–2019. 2023. Available at: https://www.croiconference.org/abstract/causes-of-death-among-adults-wit.... Accessed 31 August 2023.
    1. Lohse N, Hansen AB, Pedersen G, et al. Survival of persons with and without HIV infection in Denmark, 1995–2005. Ann Intern Med 2007; 146:87–95. - PubMed

Publication types