. 2024 Jan 12;20(1):e1011941.
doi: 10.1371/journal.ppat.1011941. eCollection 2024 Jan.

Transcriptome and small RNAome profiling uncovers how a recombinant begomovirus evades RDRγ-mediated silencing of viral genes and outcompetes its parental virus in mixed infection

Affiliations

Transcriptome and small RNAome profiling uncovers how a recombinant begomovirus evades RDRγ-mediated silencing of viral genes and outcompetes its parental virus in mixed infection

Margaux Jammes et al. PLoS Pathog. .

Abstract

Tomato yellow leaf curl virus (TYLCV, genus Begomovirus, family Geminiviridae) causes severe disease of cultivated tomatoes. Geminiviruses replicate circular single-stranded genomic DNA via rolling-circle and recombination-dependent mechanisms, frequently generating recombinants in mixed infections. Circular double-stranded intermediates of replication also serve as templates for Pol II bidirectional transcription. IS76, a recombinant derivative of TYLCV with a short sequence in the bidirectional promoter/origin-of-replication region acquired from a related begomovirus, outcompetes TYLCV in mixed infection and breaks disease resistance in tomato Ty-1 cultivars. Ty-1 encodes a γ-clade RNA-dependent RNA polymerase (RDRγ) implicated in Dicer-like (DCL)-mediated biogenesis of small interfering (si)RNAs directing gene silencing. Here, we profiled transcriptome and small RNAome of Ty-1 resistant and control susceptible plants infected with TYLCV, IS76 or their combination at early and late infection stages. We found that RDRγ boosts production rates of 21, 22 and 24 nt siRNAs from entire genomes of both viruses and modulates DCL activities in favour of 22 and 24 nt siRNAs. Compared to parental TYLCV, IS76 undergoes faster transition to the infection stage favouring rightward transcription of silencing suppressor and coat protein genes, thereby evading RDRγ activity and facilitating its DNA accumulation in both single and mixed infections. In coinfected Ty-1 plants, IS76 efficiently competes for host replication and transcription machineries, thereby impairing TYLCV replication and transcription and forcing its elimination associated with further increased siRNA production. RDRγ is constitutively overexpressed in Ty-1 plants, which correlates with begomovirus resistance, while siRNA-generating DCLs (DCL2b/d, DCL3, DCL4) and genes implicated in siRNA amplification (α-clade RDR1) and function (Argonaute2) are upregulated to similar levels in TYLCV- and IS76-infected susceptible plants. Collectively, IS76 recombination facilitates replication and promotes expression of silencing suppressor and coat proteins, which allows the recombinant virus to evade the negative impact of RDRγ-boosted production of viral siRNAs directing transcriptional and posttranscriptional silencing.


Conflict of interest statement

The authors declare no competing interests.

Figures

Fig 1
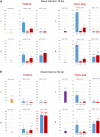
Fig 1. Total viral DNA, mRNA and small (s)RNA accumulation in susceptible (S) and Ty-1 resistant (R) tomato plants infected with TYLCV-IL, its recombinant derivative TYLCV-IS76, or their combination (IL+IS76) at 10 and 30 days post inoculation (dpi).
(A) Viral DNA loads measured by quantitative PCR (qPCR). The qPCR data were normalized using the tomato 25S rRNA gene. (B) Loads of total viral mRNAs measured by Illumina RNA-seq in reads per million (RPM) of total (plant + viral) mRNA reads. (C) Loads of total viral small (s)RNAs measured by Illumina sRNA-seq in reads per million (RPM) of total (plant + viral) sRNA reads in the size range from 15 to 34 nts. In all panels, bar graphs plot the loads for two biological replicates per each condition, with the standard error shown with a capped vertical line and the mean value indicated above. Bars for IS76 and IL are colour-coded in purple and yellow, respectively. Ratios of the mean values for each virus (IL, IS76) and their combination (IL+IS76) in S vs R plants (S/R) are given below each graph. In the case of viral mRNAs and sRNAs, their production rates (the total mRNA or total sRNA load in RPM divided by the respective virus DNA load)—“mRNA/DNA” and “sRNA/DNA”—are also indicated below the graphs.
Fig 2
Fig 2
Single-nucleotide resolution maps of viral mRNA reads in susceptible (S) and Ty-1 resistant (R) tomato plants infected with TYLCV-IL or its recombinant derivative TYLCV-IS76 at 10 (A) and 30 (B) days post inoculation (dpi). For each condition, Illumina mRNA-seq 100 nt paired-end reads were mapped onto the reference sequences of IL and IS76 genomes with zero mismatches (see S3 Dataset for more details of mapping). Histograms plot the numbers of viral reads at each nucleotide position of the IL and IS76 genomes (2781 and 2773 bp in length, respectively): blue bars above the axis represent virion strand (rightward) reads starting at each respective position, while red bars below the axis represent complementary strand (leftward) reads ending at each respective position. The viral genome organization is shown schematically above the histograms, with ORFs of the viral rightward (V1, V2) and leftward (C1-to-C4) genes shown with blue and red arrows, respectively, and capped and polyadenylated viral mRNAs (V2-V1, C1-C4 and C2-C3) shown as solid blue and red lines.
Fig 3
Fig 3
Single-nucleotide resolution maps of viral mRNA reads in susceptible (S) and Ty-1 resistant (R) tomato plants co-infected with TYLCV-IL and its recombinant derivative TYLCV-IS76 at 10 (A) and 30 (B) days post inoculation (dpi). For each condition, Illumina 100 nt paired-end reads were mapped onto the reference sequences of IL and IS76 genomes with zero mismatches (see S3 Dataset for more details of mapping). Histograms plot the numbers of viral reads at each nucleotide position of the IL and IS76 genomes (2781 and 2773 bp in length, respectively): blue bars above the axis represent virion strand (rightward) reads starting at each respective position, while red bars below the axis represent complementary strand (leftward) reads ending at each respective position. The viral genome organization is shown schematically above the histograms, with ORFs of the viral rightward (V1, V2) and leftward (C1-to-C4) genes shown with blue and red arrows, respectively, and capped and polyadenylated viral mRNAs (V2-V1, C1-C4 and C2-C3) shown as solid blue and red lines.
Fig 4
Fig 4
Production rates of viral mRNAs and sRNAs derived from virion (V) and complementary (C) stands of the viral genome in susceptible (S) and Ty-1 resistant (R) tomato plants singly infected with TYLCV-IL and its recombinant derivative TYLCV-IS76 at 10 (A) and 30 (B) days post inoculation (dpi). Illumina mRNA-seq reads representing each mRNA (V2-V1, C1-C4, C2-C3) of IL and IS76 and Illumina sRNA-seq reads (in size range from 20 to 25 nts) representing virion and complementary strands of each virus genome were counted in reads per million (RPM) of total (plant + viral) reads. The resulting counts were divided by the load of respective viral DNA measured by qPCR and, in the case of viral mRNA, by the length of each transcription unit in nucleotides. In each panel, bar graphs plot loads of the viral DNA (yellow and purple bars for IL and IS76, respectively) and the production rates of the rightward (V2-V1) and leftward (C1-C4, C2-C3) mRNAs (blue and red bars, respectively) and the sRNAs derived from the virion and complementary stands (blue and red bars, respectively). In all cases, the loads are for two biological replicates per each condition, with the standard error shown with a capped vertical line and the mean value indicated above.
Fig 5
Fig 5
Production rates of viral mRNAs and sRNAs derived from virion (V) and complementary (C) stands of the viral genome in susceptible (S) and Ty-1 resistant (R) tomato plants co-infected with TYLCV-IL and its recombinant derivative TYLCV-IS76 at 10 (A) and 30 (B) days post inoculation (dpi). Illumina mRNA-seq reads representing each mRNA (V2-V1, C1-C4, C2-C3) of IL and IS76 and Illumina sRNA-seq reads (in size range from 20 to 25 nts) representing virion and complementary strands of each virus genome were counted in reads per million (RPM) of total (plant + viral) reads. The resulting counts were divided by the load of respective viral DNA measured by qPCR and, in the case of viral mRNA, by the length of each transcription unit in nucleotides. In each panel, bar graphs plot loads of the viral DNA (yellow and purple bars for IL and IS76, respectively) and the production rates of the rightward (V2-V1) and leftward (C1-C4, C2-C3) mRNAs (blue and red bars, respectively) and the sRNAs derived from the virion and complementary stands (blue and red bars, respectively). In all cases, the loads are for two biological replicates per each condition, with the standard error shown with a capped vertical line and the mean value indicated above.
Fig 6
Fig 6
Single-nucleotide resolution maps of 20–25 nt viral small (s)RNAs in susceptible (S) and Ty-1 resistant (R) tomato plants infected with TYLCV-IL or its recombinant derivative TYLCV-IS76 at 10 (A) and 30 (B) days post inoculation (dpi). For each condition, Illumina sRNA-seq reads in the size range from 20 to 25 nts were mapped onto the reference sequences of IL and IS76 genomes with zero mismatches (see S4 Dataset for more details of mapping and maps of each size class of viral sRNAs). Histograms plot the numbers of viral reads at each nucleotide position of the IL and IS76 genomes (2781 and 2773 bp in length, respectively): blue bars above the axis represent virion strand (rightward) reads starting at each respective position, while red bars below the axis represent complementary strand (leftward) reads ending at each respective position. The viral genome organization is shown schematically above the histograms, with ORFs of the viral rightward (V1, V2) and leftward (C1-to-C4) genes shown with blue and red arrows, respectively, and capped and polyadenylated viral mRNAs (V2-V1, C1-C4, C2-C3) shown as solid blue and red lines.
Fig 7
Fig 7
Single-nucleotide resolution maps of 20–25 nt viral small (s)RNAs in susceptible (S) and Ty-1 resistant (R) tomato plants co-infected with TYLCV-IL and its recombinant derivative TYLCV-IS76 at 10 (A) and 30 (B) days post inoculation (dpi). For each condition, Illumina sRNA-seq reads in the size range from 20 to 25 nts were mapped onto the reference sequences of IL and IS76 genomes with zero mismatches (see S4 Dataset for details of read mapping and counting in mixed infection and for maps of each size class of viral sRNAs). Histograms plot the numbers of viral reads at each nucleotide position of the IL and IS76 genomes (2781 and 2773 bp in length, respectively): blue bars above the axis represent virion strand (rightward) reads starting at each respective position, while red bars below the axis represent complementary strand (leftward) reads ending at each respective position. The viral genome organization is shown schematically above the histograms, with ORFs of the viral rightward (V1, V2) and leftward (C1-to-C4) genes shown with blue and red arrows, respectively, and capped and polyadenylated viral mRNAs (V2-V1, C1-C4, C2-C3) shown as solid blue and red lines.
Fig 8
Fig 8
Production rates of sRNAs from different regions of virion (V) and complementary (C) stands of the viral genome in susceptible (S) and Ty-1 resistant (R) tomato plants infected with TYLCV-IL, its recombinant derivative TYLCV-IS76 or a combination thereof (IL+S76) at 10 (A) and 30 (B) days post inoculation (dpi). Illumina sRNA-seq reads in the size range from 20 to 25 nts representing virion and complementary strands of each transcription unit (V2-V1, C1-C4, C2-C3) and two parts of the intergenic region with the rightward (IR1) and the rightward (IR2) promoters of IL and IS76 genomes were counted in reads per million (RPM) of total (plant + viral) reads (see Material and Methods for further details of read counting in mixed infection). The resulting counts were divided by the length of each region in nucleotides and the load of respective viral DNA measured by qPCR and then multiplied by 10000. Bar graphs plot sRNA loads for the rightward (V2-V1) and leftward (C1-C4, C2-C3) mRNA transcription units and two parts of the intergenic region (IR1 and IR2). The loads of sRNAs derived from the virion and complementary stands of each region of the viral genome are represented with blue and red bars, respectively. In all cases, the loads are for two biological replicates per each condition, with the standard error shown with a capped vertical line and the mean value indicated above.
Fig 9
Fig 9. Size profiles of viral sRNAs derived from the complete viral genome in susceptible (S) and Ty-1 resistant (R) tomato plants infected with TYLCV-IL, its recombinant derivative TYLCV-IS76 or a combination thereof (IL+S76) at 10 and 30 days post inoculation (dpi).
Illumina sRNA-seq reads in the size range from 20 to 25 nts mapped to the virion (rightward) and complementary (leftward) strands of the complete viral genome were counted and percentages (%) of 6 individual size-classes in the total 20–25 nt viral reads (set to 100%) were calculated and plotted as bar graphs, with blue and red bars representing rightward and leftward strands, respectively. In all panels, the percentages are for two biological replicates per each condition, with the standard error shown with a capped vertical line and the mean value indicated above.
Fig 10
Fig 10. Size profiles of viral sRNAs derived from the rightward promoter-containing intergenic region 1 (IR1) in susceptible (S) and Ty-1 resistant (R) tomato plants infected with TYLCV-IL, its recombinant derivative TYLCV-IS76 or a combination thereof (IL+S76) at 10 and 30 days post inoculation (dpi).
Illumina sRNA-seq reads in the size range from 20 to 25 nts mapped to the viral genome the virion (rightward) and complementary (leftward) strands of the IR1 were counted and percentages (%) of 6 individual size-classes in the total 20–25 nt viral reads (set to 100%) were calculated and plotted as bar graphs, with blue and red bars representing rightward and leftward strands, respectively. In all panels, the percentages are for two biological replicates per each condition with the standard error shown with a capped vertical line and the mean value indicated above.
Fig 11
Fig 11. Size profiles of viral sRNAs derived from the leftward promoter-containing intergenic region 2 (IR2) in susceptible (S) and Ty-1 resistant (R) tomato plants infected with TYLCV-IL, its recombinant derivative TYLCV-IS76 or a combination thereof (IL+S76) at 10 and 30 days post inoculation (dpi).
Illumina sRNA-seq reads in the size range from 20 to 25 nts mapped to the viral genome the virion (rightward) and complementary (leftward) strands of the IR1 were counted and percentages (%) of 6 individual size-classes in the total 20–25 nt viral reads (set to 100%) were calculated and plotted as bar graphs, with blue and red bars representing rightward and leftward strands, respectively. In all panels, the percentages are for two biological replicates per each condition with the standard error shown with a capped vertical line and the mean value indicated above.
Fig 12
Fig 12. Silencing-related tomato genes differentially expressed in susceptible (S) and Ty-1 resistant (R) tomato plants mock-inoculated vs infected with TYLCV-IL, its recombinant derivative TYLCV-IS76 or a combination thereof (IL+S76) at 10 or 30 days post inoculation (dpi).
Charts plot the counts of Illumina mRNA-seq reads representing mRNAs of the RNA-dependent RNA polymerase (RDR) family genes RDRγ (Ty-1) and RDR1, the Dicer like (DCL) family genes DCL2b, DCL2d, DCL3 and DCL4, the Argonaute (AGO) family gene AGO2a and the Domain Rearranged Methyltransferase (DRM) family gene DRM1L in reads per million (RPM) of total mRNA-seq reads. The counts are for two biological replicates per each condition, with the standard error shown with a capped vertical line and the unfilled boxes positioned at the mean value levels and connected with solid lines (blue for S plants and red for R plants). The gene accession numbers (according to the annotated tomato reference genome ITAG4.1 available on Sol Genomics Network www.solgenomics.net) are given below the gene names.

References

    1. Jeske H. Geminiviruses. In: de Villiers EM, Hausen HZ. Editors. TT Viruses. Current Topics in Microbiology and Immunology, vol 331. Springer, Berlin, Heidelberg; 2009. pp. 185–226. 10.1007/978-3-540-70972-5_11. - DOI - PubMed
    1. Hanley-Bowdoin L, Bejarano ER, Robertson D, Mansoor S. Geminiviruses: masters at redirecting and reprogramming plant processes. Nat Rev Microbiol. 2013;11:777–88. doi: 10.1038/nrmicro3117 - DOI - PubMed
    1. Palanichelvam K, Kunik T, Citovsky V, Gafni Y. The capsid protein of tomato yellow leaf curl virus binds cooperatively to single-stranded DNA. J Gen Virol. 1998;79:2829–2833. doi: 10.1099/0022-1317-79-11-2829 - DOI - PubMed
    1. Hallan V, Gafni Y. Tomato yellow leaf curl virus (TYLCV) capsid protein (CP) subunit interactions: implications for viral assembly. Arch Virol. 2001;146:1765–73. doi: 10.1007/s007050170062 - DOI - PubMed
    1. Rojas MR, Jiang H, Salati R, Xoconostle-Cázares B, Sudarshana MR, Lucas WJ, et al.. Functional analysis of proteins involved in movement of the monopartite begomovirus, Tomato yellow leaf curl virus. Virology. 2001;291:110–25. doi: 10.1006/viro.2001.1194 - DOI - PubMed