. 2024 Feb 14;32(2):209-226.e7.
doi: 10.1016/j.chom.2023.12.013. Epub 2024 Jan 11.

Linking microbial genes to plasma and stool metabolites uncovers host-microbial interactions underlying ulcerative colitis disease course

Affiliations

Linking microbial genes to plasma and stool metabolites uncovers host-microbial interactions underlying ulcerative colitis disease course

Melanie Schirmer et al. Cell Host Microbe. .

Abstract

Understanding the role of the microbiome in inflammatory diseases requires the identification of microbial effector molecules. We established an approach to link disease-associated microbes to microbial metabolites by integrating paired metagenomics, stool and plasma metabolomics, and culturomics. We identified host-microbial interactions correlated with disease activity, inflammation, and the clinical course of ulcerative colitis (UC) in the Predicting Response to Standardized Colitis Therapy (PROTECT) pediatric inception cohort. In severe disease, metabolite changes included increased dipeptides and tauro-conjugated bile acids (BAs) and decreased amino-acid-conjugated BAs in stool, whereas in plasma polyamines (N-acetylputrescine and N1-acetylspermidine) increased. Using patient samples and Veillonella parvula as a model, we uncovered nitrate- and lactate-dependent metabolic pathways, experimentally linking V. parvula expansion to immunomodulatory tryptophan metabolite production. Additionally, V. parvula metabolizes immunosuppressive thiopurine drugs through xdhA xanthine dehydrogenase, potentially impairing the therapeutic response. Our findings demonstrate that the microbiome contributes to disease-associated metabolite changes, underscoring the importance of these interactions in disease pathology and treatment.

Keywords: Veillonella parvula; culturomics; metabolomics; metagenomics; microbiome; multiomics data integration; nitrate respiration; thiopurines; tryptophan metabolism; ulcerative colitis.


Conflict of interest statement

Declaration of interests R.J.X. is a co-founder of Celsius Therapeutics and Jnana Therapeutics, board director at MoonLake Immunotherapeutics, and consultant to Nestlé. D.R.M. is a co-founder of MedBiome Inc.

Figures

Figure 1:
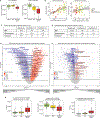
Figure 1:. PROTECT cohort overview and longitudinal microbiome-associations with disease progression.
A. Our approach uses paired multiomics to identify microbes, microbial genes and metabolites associated with disease. Subsequent integration with culture metabolomics directly links previously undescribed and annotated metabolites in patients to disease-associated microbes. B. Patients were grouped into inactive, mild and moderate/severe disease based on their PUCAI; those receiving colectomy as surgical intervention represent the most severe disease, where all other treatment options have failed. C. Disease progression and treatment response for 95 patients with mild or moderate/severe disease at week 0. While disease severity often improved, only 48% achieved remission by week 52. D. Eight assembled MSPs encoded the complete narGHJI operon. Patients were stratified by level of inflammation (as measured by fecal calprotectin: low (<100 mcg/g), increased (100–200 mcg/g), high (200–3,000 mcg/g) or very high (>3,000 mcg/g)), showing that the median abundance of the narGHJI genes for each MSP increases with inflammation. E. Viral MSPs that significantly changed with disease severity or colectomy (LME, Storey’s q < 0.05, samples from all time points). Depletion of 10 of these viral MSP was further associated with increased fecal calprotectin levels (marked by red #, Wilcoxon, p<0.05). Colors indicate mean abundance for each MSP stratified by patient group and stars indicate significant changes compared to inactive disease and no colectomy requirement, respectively. For each MSP, the numbers following the taxonomic name specify the number of core genes supporting the taxonomic assignment followed by the total number of annotated core genes.
Figure 2:
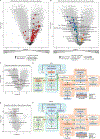
Figure 2:. Metabolic disruptions associated with moderate/severe disease in stool and plasma.
A. Metabolite diversity significantly decreased in moderate/severe disease. Stool Wilcoxon: inactive vs. mild, p=0.2; inactive vs. mod./severe, p=10−4; mild vs. mod./severe p=10−5. Plasma Wilcoxon: inactive vs mild, p=10−4; mild vs mod./severe p=0.007. B. Variation in stool metabolites was significantly associated with species diversity (Chao1, metagenomic species profiles). Spearman correlation with first principal coordinate (PC) of PCoA for stool and plasma metabolite profiles, respectively. Linear model with 95% confidence interval. C-F. Overview of differentially abundant stool (left) and plasma (right) metabolites in moderate/severe and mild versus inactive disease (linear mixed effects model [LME], Storey’s q<0.05, * indicates q<0.2, based on all samples). X-axis of volcano plots indicates LME coefficient and y-axis significance of the association (Storey q-value). Dots and annotation color indicate Pearson correlation of the respective metabolite intensities with fecal calprotectin levels (blue - negative, red - positive, gray/black - not significant). G. Differential abundances of N4-acetylcytidine (plasma), cytidine (stool) and N1-acetylspermidine (plasma).
Figure 3:
Figure 3:. Levels of dipeptide, conjugated bile acids and metabolites involved in tryptophan metabolism changed in moderate/severe disease.
A. Dipeptides (red) were systematically enriched in moderate/severe disease (LME, Storey’s q<0.05). B. Bile acids (BA) were differentially abundant, depending on conjugation type, with tauro-conjugated BA increased and amino acid conjugated BA decreased in moderate/severe disease. C, D. Differentially abundant metabolites from the serotonin, indole and kynurenine pathway in stool and plasma. E, F. Overview of tryptophan pathways highlighting metabolites that are decreased (blue) or increased (orange) in moderate/severe disease compared to inactive disease in stool and plasma, respectively. For each reaction, arrow color indicates bacterial and/or host origin (based on KEGG, for indole pathway).
Figure 4:
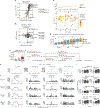
Figure 4:. V. parvula culture metabolomic profiles recapitulate microbe-metabolite associations.
A, B. Comparison between stool and culture metabolomics (N=104 matched metabolites). Veillonella has highest correspondence between metabolites enriched in moderate/severe disease and correlation with taxonomic abundance (A, V. p., p=1.21e-13, ChiSquare test; red = increased in disease/pos. correlation with V.p., yellow = decreased in disease/neg. correlation with V.p.) or fold change in supernatants vs unspent medium (B, Veillonella HPA0037, p=2.64e-02; red = increased in both disease and culture, blue = increased in disease and decreased in culture, yellow = decreased in both disease and culture). C. PROTECT stool and V. parvula culture profiles significantly correlated in all conditions (Spearman, all p<0.05, median pinactive=10−8, median pmild=10−13, median pmod/sev=10−20). Metabolite profiles were restricted to compounds detected in both stool and culture (n=1,427). D. PCoA with euclidean distance of stool and culture metabolite intensity profiles. Color indicates V.p. abundance in the paired metagenomic profile. The density plot shows disease severity distribution along the first principal coordinate (x-axis). Percentage of total variance explained by each axis is indicated in brackets. E. Lactate intensity in stool across disease severity. F. Excerpt of tryptophan metabolism pathway producing end products indolelactate, indoleacetate, indole propionate and indole-3-ethanol. Arrows show predicted reactions in V.p. HPA0037 and SKV38 genome, using provided gene annotations, GapSeq and BLASTp. G. Total ion chromatograms (TIC) used to determine reference retention time and m/z for each reference standard. H. Extracted ion chromatograms (EIC) from targeted LC-MS on spent media upon V.p. exposure, using reference standards for tryptophan and indole metabolites, within acquisition time window +/− 0.5 min. Black chromatograms show levels in a representative replicate after exposure to V.p. in late exponential phase; gray lines show unspent media. I. Intensity estimates for three replicate estimates as area under the EIC curve for unspent media (UM), mid-exponential (ME) and late-exponential growth phase.
Figure 5:
Figure 5:. Fragmentation of disease-enriched lipids reveals multiple fatty acid amides derived from V. parvula cultures.
A. Distribution of lipids, measured as LC-MS peaks, significant in mild or moderate/severe UC (q<0.05) and detected in V.p. cultures. Lipids which significantly decrease or increase in spent media (FC<0.5 or FC>2) are marked “down” and “up”, respectively. B. The largest connected component (enlarged from circled region at bottom left) in molecular networking of lipids using MS/MS spectra and GNPS. Node shapes and colors represent significant changes in disease and V.p. culture, respectively. Molecule names represent spectra confirmed by internal standards and CPs_QI20648 was predicted as linoleamide. C,D. Distribution of intensities for selected predicted fatty amides conditioned on patient disease severity (C) or V.p. cultures (D) supplemented with lactate (L), nitrate (N) or both (L+N). Asterisks indicate fold change (FC) in intensities comparing spent media to unspent media: *: FC>2, **: FC>4, ***: FC>8.
Figure 6:
Figure 6:. V. parvula culture metabolomic profiles confirm nitrate-dependent capabilities to metabolize purines and thiopurines.
A. Pangenome analysis of V.p. genes related to purine metabolism and nitrate reductase. Columns indicate presence/absence of each gene in each sample. B. In vitro consumption of hypoxanthine, xanthine, adenine and guanine in mid-exponential phase of V.p.. SK +/− nitrate as terminal electron acceptor and lactate as carbon source. Purines were determined by LC-MS. Experiments were performed in triplicate. Uninoc = uninoculated media, Spent M = spent media/supernatant. One-way ANOVA and Tukey, *p<0.05, **p<0.01. C. In vitro consumption of hypoxanthine, xanthine, urate, adenine and guanine in V.p. WT, xdh (xdh::cm), and pucD (pucD::cm) mutant cells. First column shows metabolite concentrations in sterile media. Guanine was not detected in WT or mutant experiments. Cells were collected from SKN medium at mid-exponential phase. Experiments were performed in triplicate. T-test, ns=not significant, ***p<0.001, ****p<0.0001. D. xdhA and pucD gene abundance across PROTECT samples stratified by disease severity. Representative gene sequences were mapped against the PROTECT gene catalogue with >60% identity and >70% coverage. Plot indicates cumulative abundance of all mapped gene families. Wilcoxon, FC = fold change comparing gene abundance in mod./severe vs. inactive patients. E. Structures of purine analog IBD drugs 6-mercaptopurine (6-MP) and azathioprine, with hypoxanthine for comparison. F. Degradation of 6-MP and azathioprine by V.p. is reduced by xdhA deletion. Drugs were added to SKN medium at a final concentration of 20 μM (nreplication=4) and degradation was monitored during the mid-exponential phase. Experiments performed in triplicate. T-test, ns=not significant, ***p<0.001, ****p<0.0001.

References

    1. Lavoie S, Conway KL, Lassen KG, Jijon HB, Pan H, Chun E, Michaud M, Lang JK, Gallini Comeau CA, Dreyfuss JM, et al. (2019). The Crohn’s disease polymorphism, ATG16L1 T300A, alters the gut microbiota and enhances the local Th1/Th17 response. Elife 8. 10.7554/eLife.39982. - DOI - PMC - PubMed
    1. Krautkramer KA, Fan J, and Bäckhed F (2021). Gut microbial metabolites as multi-kingdom intermediates. Nat. Rev. Microbiol. 19, 77–94. - PubMed
    1. Ansaldo E, Farley TK, and Belkaid Y (2021). Control of Immunity by the Microbiota. Annu. Rev. Immunol. 39, 449–479. - PubMed
    1. Brown EM, Clardy J, and Xavier RJ (2023). Gut microbiome lipid metabolism and its impact on host physiology. Cell Host Microbe 31, 173–186. - PMC - PubMed
    1. Wlodarska M, Luo C, Kolde R, d’Hennezel E, Annand JW, Heim CE, Krastel P, Schmitt EK, Omar AS, Creasey EA, et al. (2017). Indoleacrylic Acid Produced by Commensal Peptostreptococcus Species Suppresses Inflammation. Cell Host Microbe 22, 25–37.e6. - PMC - PubMed

LinkOut - more resources