. 2024 Feb 5;34(3):505-518.e6.
doi: 10.1016/j.cub.2023.12.033. Epub 2024 Jan 11.

Juvenile hormones direct primordial germ cell migration to the embryonic gonad

Affiliations

Juvenile hormones direct primordial germ cell migration to the embryonic gonad

Lacy J Barton et al. Curr Biol. .

Abstract

Germ cells are essential to sexual reproduction. Across the animal kingdom, extracellular signaling isoprenoids, such as retinoic acids (RAs) in vertebrates and juvenile hormones (JHs) in invertebrates, facilitate multiple processes in reproduction. Here we investigated the role of these potent signaling molecules in embryonic germ cell development, using JHs in Drosophila melanogaster as a model system. In contrast to their established endocrine roles during larval and adult germline development, we found that JH signaling acts locally during embryonic development. Using an in vivo biosensor, we observed active JH signaling first within and near primordial germ cells (PGCs) as they migrate to the developing gonad. Through in vivo and in vitro assays, we determined that JHs are both necessary and sufficient for PGC migration. Analysis into the mechanisms of this newly uncovered paracrine JH function revealed that PGC migration was compromised when JHs were decreased or increased, suggesting that specific titers or spatiotemporal JH dynamics are required for robust PGC colonization of the gonad. Compromised PGC migration can impair fertility and cause germ cell tumors in many species, including humans. In mammals, retinoids have many roles in development and reproduction. We found that like JHs in Drosophila, RA was sufficient to impact mouse PGC migration in vitro. Together, our study reveals a previously unanticipated role of isoprenoids as local effectors of pre-gonadal PGC development and suggests a broadly shared mechanism in PGC migration.

Keywords: Hmgcr; cell movement; embryonic development; gametogenesis; germ cells; gonad; juvenile hormones; ovary; retinoids; testis.


Conflict of interest statement

Declaration of interests The authors declare no competing interests.

Figures

Figure 1:
Figure 1:. Juvenile hormone (JH) signaling is active in the embryonic mesoderm during PGC migration
A Left: Schematic summarizing gonadotropic effect of JH in insects, whereby JH is produced in an endocrine gland and acts systemically to promote oogenesis. Right: Summary of established JH signaling pathways wherein endocrine cells produce JHs downstream of Acetyl-CoA and a biosynthetic pathway that culminates in JH acid methyltransferase (Jhamt)-mediated JH production. JHs (red jagged lines) are then secreted in the hemolymph and enter JH-responding cells. Once in JH-responding cells, JH binds to one of two JH transcriptional receptors, Methoprene tolerant (Met) or Germ cell expressed (Gce). JH-bound Met/Gce translocates to the nucleus to regulate target genes. B Top: Lateral view image of a late Stage 12 embryo stained by Fluorescent in situ hybridization (FISH) for jhamt (green). and nanos (magenta) mRNA. Below are zoomed in images of the dashed boxed area from the top image, with nanos mRNA (magenta) in the middle panel and the merge of nanos (magenta) and jhamt (green) mRNAs in the bottom panel. Primers used to generate in situ probes are listed in Table S1. C Schematic of germ cell development during Stage 10–14 of Drosophila embryogenesis. D Top: schematic of a new transgenic JH sensor (JHRE-GFP) in which eight copies of the JH Response Element from the early trypsin gene from A. aegypti were placed upstream of eGFP (See Materials and Methods for construct design). Bottom: Induction of Kr-h1 mRNA, a known JH transcriptional target, and GFP mRNA. deltaCt was calculated relative to the average Ct of two housekeeping genes, DCTN5-p25 and Und, and fold change was calculated for whole second instar larvae fed cornmeal food containing 1.6μg/mg of JH analogue, methoprene normalized to age and genotype-matched larvae fed ethanol. Animals were fed methoprene or solvent control for 24 hours prior to RNA isolation. Bars represent the geometric mean of normalized expression per biological replicate (dot), each consisting of ten second instar larvae. Error bars represent +/− standard error of the mean as previously described. E Dorsal (d) images of Stage 10 JHRE-GFP embryos that are wild type (left) or mutant for Met and Gce (right). F Left: dorsal view of a Stage 11 JHRE-GFP embryo stained for GFP (green) protein, Vasa (magenta) protein, and DNA using DAPI (gray). Right: lateral view of a Stage 11 JHRE-GFP embryo. GFP channel is shown below each merged image. For all images, magnified images in the boxed area outlined by a dashed, white square are shown to the right of each whole-embryo image. Arrows point to PGCs which are GFP-positive. Genotypes are noted in the top left corner, embryo orientation in the bottom, and scale bars represent 25μm. All images are maximum projections of two to three 2μm confocal slices. See Figure S1 for supplemental data relating to data within this figure.
Figure 2:
Figure 2:. Key JH synthesis enzyme, Jhamt, facilitates PGC migration to the gonad.
A Schematic of the jhamt locus noting the location of premature stop codons within the methyltransferase domain (shown in green), which were introduced by CRISPR-mediated editing. Light gray denotes 5’ and 3’ UTR. B Titers of two JHs, JH III and JH bisepoxide (JHB3), in hemolymph of third instar Drosophila larvae measured by quantitative mass spectrometry using deuterated standards. Each dot represents a biological replicate of hemolymph bled from 25 larvae. For titers, w, Sp/CyO,ft-lacZ was used as a wildtype strain as the CRISPR-induced alleles in a w background were initially crossed into this background. C Fecundity of young females. Each dot represents the average number of eggs laid per biological replicate, which was obtained by dividing the number of eggs laid over a 24-hour period by the number of females (10–12) in each cohort three- and four-days after eclosion. To avoid confounding male infertility effects, all virgin females were mated to wildtype (w1118) males. For B and C, bars and whiskers represent mean +/− standard deviation and statistical significance was tested by unpaired student t test. D Dorsal view images of Stage 14 Drosophila embryos stained for Vasa (magenta) and DNA (DAPI, gray). Zygotic genotypes are noted in the top left corner. Gonads are circled with a white dashed circle. Arrowheads highlight extragonadal germ cells. All embryo images are maximum projections of two to three 2μm confocal slices. Scale bars represent 25μm. E Quantification of extragonadal PGCs in Stage 14–16 embryos. Each dot represents one embryo. To yield jhamt-/− embryos, with heteroallelic combinations of independently derived indels, jhamt8F/CyO,ftz-lacZ females were mated to jhamt12F1/CyO,ftz-lacZ. To generate jhamt−/Def embryos, jhamt8F1/CyO,ftz-lacZ animals were mated to Df(2L)BSC781/CyO, ft-lacZ animals. F Quantification of extragonadal PGCs in Stage 14–16 embryos when Hmgcr is ectopically expressed in the nervous system using Elav-GAL4 and UAS-Hmgcr. Each dot represents an embryo. For panels E and F, bars and whiskers represent median +/− interquartile range (IQR), statistical significance was tested by Mann-Whitney U test, with ns=not significant. The reference strain for jhamt studies was w1118, as jhamt alleles were backcrossed into this background, crossed to Oregon R. See Figure S2 for supplemental data relating to data within this figure.
Figure 3:
Figure 3:. Juvenile hormone is sufficient for PGC migration.
A Ventral view images of Stage 14 embryos stained for Vasa (magenta) and Elav (green). Genotypes are noted in the top left corner of each image. Arrowheads highlight germ cells in contact with Elav-positive central nervous system. All embryo images are maximum projections of two to three 2μm confocal slices. Scale bars represent 25μm. B Quantification of the number of PGCs in Stage 14–16 embryos contacting Elav-positive cells upon ectopic expression of either Hmgcr or jhamt using the Elav-GAL4 driver. Bar and whiskers represent mean +/− standard deviation and statistical significance was tested by unpaired t-test. C Top Left: Scatter plots from FACS of GFP-positive PGCs from nos-moesin::GFP transgenic embryos. Region 1 (R1) denotes collection cutoff. Top Right: Image of isolated GFP-positive PGCs (gray). Bottom: Schematic of the in vitro transwell assay in which FACS-enriched PGCs are placed on a 10μm filter above either serum-free media conditioned with Kc167 cells as a positive control, serum-free unconditioned media as a negative control, or experimental conditions, such as serum-free media with JH III. The number of PGCs that translocated to the bottom well was quantified visually after 1.5 hours. D Quantification of Specific PGC migration, which is the percentage of experimental translocated PGCs relative to positive (serum-free Kc167-conditioned media) and negative (serum-free media) controls. Such normalization allows comparison of biological replicates done on different days, with each dot representing the average of two technical replicates done on the same day. See Materials and Methods for further details. Numbers shown in white within each jhamt knockdown bar represents the Fold Change (FC) of jhamt mRNA at the time when conditioned media was collected. Bar height represents mean and error bars represent standard deviation from two to four biological replicates and statistical significance was tested by unpaired t-test. E Quantification of specific migration in transwell assays using isolated PGCs placed above serum-free media containing various concentrations of commercially available JH III (green bars) or 20-hydroxyecdysone (20E, magenta bars) with 1% BSA as a non-specific carrier protein. Bars represent means and error bars represent standard deviation from three biological replicates, which were each obtained by averaging two to three technical replicates. F Percentage Specific PGC migration wherein isolated PGCs were placed across either serum-free media conditioned (gray), serum-free media with 1% BSA (black) and either JH III (dark green, 2.5μM) or the JH analogue, methoprene, (light green, 2.5μm) with 1% BSA as a non-specific carrier protein. Bars represent means and error bars represent standard deviation from two biological replicates, which were each obtained by averaging two to three technical replicates. ns=not significant. See Figure S3 for supplemental data relating to data within this figure.
Figure 4:
Figure 4:. JH transcriptional receptor loss compromises PGC migration to the gonad
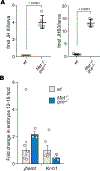
A Schematic of genetic loci encoding the two redundant JH transcriptional receptors, Met and Gce with location of extant mutations recombined for this study noted. B Fold change of gce and Kr-h1 mRNAs in Met, gce mutant one-day old adult females relative to wildtype control animals normalized using housekeeping genes, DCTN5-p25 and Und. Shown are Fold Change in homoallelic combination for the newly recombined mutant alleles Met1, gceMi (dark blue) and heteroallelic combination of Met1, gceMi with existing or Met27, gce2.5k alleles (light blue). Bars represent the geometric mean of normalized expression per biological replicate (dot), each containing pooled mRNA from five females. Error bars represent +/− standard error of the mean as previously described. C Fecundity of young females. Each dot represents the average number of eggs laid per biological replicate, which were obtained by dividing the number of eggs laid over a 24-hour period by the number of females (10–12) in each cohort three- and four-days after eclosion. To avoid any confounding male infertility effects, all virgin females were mated to wildtype (w1118) males. Bars and whiskers represent mean +/− standard deviation and statistical significance was tested by unpaired student t test. D Left: Lateral view images of Stage 14 embryos stained for Vasa (magenta) and DAPI (gray). Maternal and zygotic genotypes are noted in the top left corner. Right: Quantification of extragonadal PGCs in Stage 14–16 embryos. Each dot represents one embryo. To generate maternal and zygotic mutant embryos, mutant Met1/27, gceMi/2.5k mothers were crossed to Met1,gceMi/Y males. Arrowheads point to extragonadal germ cells. E Top panel: schematic of genetic suppression experiment. In otherwise wildtype embryos, ectopic expression of Hmgcr in the gut/endoderm (green) with 48Y-GAL4; UASt-Hmgcr transgenes traps ~65% of PGCs (pink) in the gut (left schematic). To determine if Met and Gce is required downstream of HMGCR, Met1/27, gceMi/2.5k females were crossed 48Y-GAL4; UASt-Hmgcr males to generate PGCs without maternal loading of Met/gce. Bottom panels: Lateral view of Stage 14 embryos stained for Vasa (magenta), the endodermal marker, Hnt (green) and DAPI (gray). Bold M: designates the maternal genotype that PGCs primarily rely on when exiting the endoderm. Bold P: designates the paternal genotype. White brackets indicate germ cells that remain in gut. Right: Percentage of PGCs remaining in the gut in Stage 14+ embryos upon expression of UAS-Hmgcr using the 48Y-GAL4 driver. Each dot represents one embryo. F Quantification of Specific in vitro migration when isolated PGCs were treated with 1μM flavopiridol to inhibit transcription (Txn) 30 minutes prior to placing PGCs in the transwell plate. Flavopiridol (1μM) was also added to the bottom chambers of the transwell plates for transcriptional inhibition experimental conditions. Specific migration was calculated relative to vehicle control treated PGCs subjected to serum-free media (uncond media, black) and serum-free media conditioned with Kc167 (Cond media, gray). The effect of transcriptional inhibition (−) was measured in PGCs subjected to cond media or containing 5μM JH III (green). Bars represent means and error bars represent standard deviation from two biological replicates, which were each obtained by averaging two technical replicates. Bars and whiskers within each graph represent median +/− interquartile range (IQR). Statistical significance was tested by Mann-Whitney U test, with ns=not significant. Dashed white circles outline the gonad and scale bars represent 25μm in all images. See Figure S4 for supplemental data relating to data within this figure.
Figure 5:
Figure 5:. Compensatory feedback loop maintains JH homeostasis in Drosophila.
A Titers of two JHs, JH III and JH bisepoxide (JHB3), in hemolymph of third instar Drosophila larvae measured by quantitative mass spectrometry using deuterated standards. Each dot represents a biological replicate of hemolymph bled from 25 Met1/1, gceMi/Mi or w1118 third instar larvae. B Fold change of jhamt and Kr-h1 mRNA in Met1/27, gceMi/2.5k embryos 12–16 hours post deposition (hpd) relative to the wildtype strain obtained by crossing w1118 to OregonR and normalized using two housekeeping genes, DCTN5-p25 and Und. Bars represent the geometric mean of normalized expression per biological replicate (dot). Error bars represent +/− standard error of the mean as previously described. See Figure S5 for supplemental data relating to data within this figure.
Figure 6:
Figure 6:. Model of JH function in PGC migration.
A Quantification of specific in vitro migration wherein isolated Drosophila PGCs are placed in a transwell migration system across Kc167-conditioned media (gray), serum-free media (black), JH III (green, 5μM), all trans retinoic acid (ATRA, dark blue, 5μM) or 9-cis RA (light blue 5μM). B Quantification of specific in vitro migration wherein mouse PGCs were FACS-enriched from trunk tissues dissected from E10.5 Oct4-GFP embryos and placed across two positive controls: Fetal Bovine Serum (FBS) or CXCL12 (50 ng/mL) (gray), serum-free media as a negative control (black) or ATRA (dark blue, 1μM) or 9cis-RA (light blue, 1μM). For A and B, bars and error bars represent mean +/− standard deviation from at least two biological replicates, which were obtained by averaging two to three technical replicates. C Schematic of model for how JHs ensure migrating PGCs (pink) colonize the gonad (green) in the Drosophila embryo. See Figure S6 for supplemental data relating to data within this figure.

Comment in

Similar articles

Cited by

References

    1. Saitou M, and Hayashi K (2021). Mammalian in vitro gametogenesis. Science 374, eaaz6830. 10.1126/science.aaz6830. - DOI - PubMed
    1. Misawa N, Takemura M, and Maoka T (2021). Carotenoid Biosynthesis in Animals: Case of Arthropods. Adv Exp Med Biol 1261, 217–220. 10.1007/978-981-15-7360-6_19. - DOI - PubMed
    1. Finger DS, Whitehead KM, Phipps DN, and Ables ET (2021). Nuclear receptors linking physiology and germline stem cells in Drosophila. Vitam Horm 116, 327–362. 10.1016/bs.vh.2020.12.008. - DOI - PMC - PubMed
    1. Banisch TU, Slaidina M, Gupta S, Ho MG, Gilboa L, and Lehmann R (2021). A transitory signaling center controls timing of primordial germ cell differentiation. Dev Cell 56, 1742–+. 10.1016/j.devcel.2021.05.008. - DOI - PMC - PubMed
    1. Bai JW, Uehara Y, and Montell DJ (2000). Regulation of invasive cell behavior by taiman, a Drosophila protein related to AlB1, a steroid receptor coactivator amplified in breast cancer. Cell 103, 1047–1058. Doi 10.1016/S0092-8674(00)00208-7. - DOI - PubMed

Publication types

LinkOut - more resources