. 2024 Feb 12;42(2):209-224.e9.
doi: 10.1016/j.ccell.2023.12.013. Epub 2024 Jan 11.

Clinical and molecular features of acquired resistance to immunotherapy in non-small cell lung cancer

Affiliations

Clinical and molecular features of acquired resistance to immunotherapy in non-small cell lung cancer

Danish Memon et al. Cancer Cell. .

Abstract

Although immunotherapy with PD-(L)1 blockade is routine for lung cancer, little is known about acquired resistance. Among 1,201 patients with non-small cell lung cancer (NSCLC) treated with PD-(L)1 blockade, acquired resistance is common, occurring in >60% of initial responders. Acquired resistance shows differential expression of inflammation and interferon (IFN) signaling. Relapsed tumors can be separated by upregulated or stable expression of IFNγ response genes. Upregulation of IFNγ response genes is associated with putative routes of resistance characterized by signatures of persistent IFN signaling, immune dysfunction, and mutations in antigen presentation genes which can be recapitulated in multiple murine models of acquired resistance to PD-(L)1 blockade after in vitro IFNγ treatment. Acquired resistance to PD-(L)1 blockade in NSCLC is associated with an ongoing, but altered IFN response. The persistently inflamed, rather than excluded or deserted, tumor microenvironment of acquired resistance may inform therapeutic strategies to effectively reprogram and reverse acquired resistance.

Keywords: Clonal selection; Genomics and Transcriptomics; Immune escape; Immune-checkpoint blockade; Interferon alpha/gamma response; Neoantigens; T cell exhaustion; Tumor heterogeneity; Type I and Type II Interferons; anti-PD-1 therapy.


Conflict of interest statement

Declaration of interests A.J.S. reports consulting/advising role to J&J, KSQ therapeutics, BMS, Merck, Enara Bio, Perceptive Advisors, Oppenheimer and Co, Umoja Biopharma, Legend Biotech, Iovance Biotherapeutics, Prelude Therapeutics, Immunocore, Lyell Immunopharma, Amgen and Heat Biologics. Research funding: GSK (Inst), PACT pharma (Inst), Iovance Biotherapeutics (Inst), Achilles therapeutics (Inst), Merck (Inst), BMS (Inst), Harpoon Therapeutics (Inst) and Amgen (Inst). MDH reports research grant from BMS; personal fees from Achilles; Arcus; AstraZeneca; Blueprint; BMS; Genentech/Roche; Genzyme/Sanofi, Immunai; Instil Bio; Janssen; Merck; Mirati; Natera; Nektar; Pact Pharma; Regeneron; Shattuck Labs; Syndax; as well as equity options from Arcus, Factorial, Immunai, and Shattuck Labs. A patent filed by Memorial Sloan Kettering related to the use of tumor mutational burden to predict response to immunotherapy (PCT/US2015/062208) is pending and licensed by PGDx. J.L. has received honoraria from Targeted Oncology and Physicians’ Education Resource. D.M. is an employee of M:M Bio Limited. D.M. reports consulting role to Shattuck Labs and Corbus Pharma. T.M. is a consultant for Daiichi Sankyo Co, Leap Therapeutics, Immunos Therapeutics, and Pfizer, and co-founder of Imvaq Therapeutics. T.M. has equity in Imvaq therapeutics. T.M. reports grants from Bristol Myers Squibb, Surface Oncology, Kyn Therapeutics, Infinity Pharmaceuticals, Peregrine Pharmaceuticals, Adaptive Biotechnologies, Leap Therapeutics, and Aprea. T.M. is an inventor on patent applications related to work on oncolytic viral therapy, alphavirus-based vaccines, neo-antigen modeling, CD40, GITR, OX40, PD-1, and CTLA-4. B.D.G. has received honoraria for speaking engagements from Merck, Bristol Meyers Squibb, and Chugai Pharmaceuticals; has received research funding from Bristol Meyers Squibb and Merck; and has been a compensated consultant for Darwin Health, Merck, PMV Pharma, Shennon Biotechnologies, and Rome Therapeutics of which he is a co-founder. B.D.G. is part of a patent related to neoantigen prediction (WO2018136664A1, PCT/US2023/011643). G.F. and T.H.S. are employees and stockholders of Shattuck Labs, Inc. M.L.M. has received honorarium from GSK. H.R., X.Z., M.R.K., I.A., R.S., J.C.B., M.L.M., and M.D.H. are current employees and stockholders of AstraZeneca.

Figures

Figure 1.
Figure 1.. Clinical features of acquired resistance to immunotherapy in lung cancer.
(a) Cumulative incidence of developing acquired resistance among patients with NSCLC with initial response to PD-1 blockade therapy. (b) Time to onset of acquired resistance among responders (n=243). (c) Estimated rate of developing acquired resistance defined by duration of initial response. (d) Rates of baseline clinical features among patients with primary (n = 346) and acquired resistance (n = 118). Asterisk represents significant comparisons of Fisher’s p < 0.05. (e) Common organ sites of progression at time of primary or acquired resistance. * represents significant comparisons of Fisher’s p < 0.05. (f) Post-progression overall survival in patients with primary or acquired resistance (Log-rank p < 0.0001). See also Table S1.
Figure 2.
Figure 2.. Overview of the patient cohort used for the exome and expression analyses.
(a) Flow diagram depicting molecular profiling of samples from patients with NSCLC treated with PD-1 blockade who developed acquired resistance. Paired samples are those collected prior to treatment initiation with PD-1 inhibitor and at time of resistance from the same patient. Unpaired samples include single timepoints of collection; prior to treatment initiation or at time of resistance. (b) Swimmer’s plot of when each patient was molecularly profiled. Course of treatment, progression-free survival, and time to tissue acquisition are depicted. Lines within circles identify the type of sequencing completed. (c) Waterfall plot of RECIST best overall response in patient (dark blue) and lesion (light blue). Dashed line represents 30% shrinkage. Asterisk represents new metastatic lesions that appeared during treatment and continued to grow consistent with a site of acquired resistance (de novo growth). See also Figures S1, S2, and Tables S1, S2.
Figure 3.
Figure 3.. Resistant lesions show up-regulation of IFNγ response pathway and infiltration of CD8+ T cells.
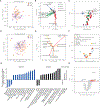
(a) Principal components analysis of paired samples using enrichment scores of hallmark gene sets derived from ssGSEA. Paired pre- and post-treatment lesions from the same patient are connected using a dashed line (n=26). The light grey arrow indicates the average directionality of change for each pair. (b) Principal components feature loadings of hallmark gene sets with both magnitude and direction. Biological processes in hallmark gene sets were categorized into sub-groups as previously described and colour-coded accordingly. (c) Differential comparison of hallmark enrichment scores between pre- and post-treatment samples. Each point represents a hallmark gene set and point size indicates the number of genes in a gene set. The x-axis indicates the change in hallmark enrichment scores for paired samples from each patient (Post vs Pre) and the y-axis is false discovery rate (FDR)-adjusted p-value derived from the comparison of enrichment scores of hallmark gene sets using paired t-test. The black dashed line represents FDR cutoff to identify significant gene sets (FDR < 0.1). (d) Principal components analysis of immune cell estimates derived using CIBERSORT immune cell deconvolution approach. (e) Principal components feature loadings of immune cell estimates. (f) Differential comparison of immune cell estimates (CIBERSORT) between pre- vs post-treatment samples. Each point represents an immune cell type and associated color reference indicated in panel e. The x-axis indicates the change in immune cell estimates for paired samples from each patient (Post vs Pre) and y-axis is FDR adjusted p-value derived from paired comparison of immune cell estimates. (g) Summary of key changes in hallmark gene sets, immune checkpoint blockade-resistance related gene signatures and estimates of immune cells using differential analysis of expression data. All gene sets with p-value < 0.05 are shown. * indicates gene sets that were significant after FDR correction (FDR < 0.1). (h) Differentially expressed genes between pre- and post-treatment samples. The black dashed line represents FDR cutoff to identify significant genes (FDR < 0.15). Benjamini–Hochberg (BH) method was used for FDR correction. See also Figure S3 and Tables S3-S5.
Figure 4.
Figure 4.. A subset of samples from patients with acquired resistance have elevated IFNγ response and T cell exhaustion signatures post-treatment.
(a) Schematics of pseudotime analysis of bulk mRNA aiming to uncover temporal information that traces the underlying biological process of samples from a cross-sectional cohort of individuals. This analysis assumes that tumors in the cross-sectional cohort behave asynchronously and each patient’s sample is at a different stage of progression captured along the trajectory of pre- and post-treatment. (b) Pseudotime estimates based on the 500 most variable genes in pre- and post-treatment samples using PhenoPath. (c) Spearman’s rank correlation score between change in pseudotime pre- to post-treatment vs change in ssGSEA-based enrichment scores of the hallmark and immune checkpoint blockade (ICB) resistance gene sets. Top ten positively and top three negatively correlated gene sets are shown. **FDR < 0.01, ***FDR < 0.001. (d) Scatter plot of change in ssGSEA enrichment score vs change in pseudotime estimates pre- to post-treatment with indication of patient samples separating into a IFNγ response increase (pink) vs stable (light blue) group. (e) Correlation between change in the IFNγ response signature and change in the ICB-resistance signature derived from a mouse model of melanoma for the paired samples. (f) Patient samples were sub-divided into ‘stable’ and ‘increase’ categories based on the magnitude of change in the IFNγ response signature between the pre- and post-treatment samples. The change in resistance signature was compared to the change in IFNγ response using a Pearson correlation. (g) Change in enrichment scores of key differentially regulated gene sets in either ‘stable’ or ‘increase’ patient samples (pearson correlation p < 0.05) ordered according to change in enrichment score of IFNγ response signature. The extent of overlap between IFNγ response signature and each differentially regulated gene set is represented as the overlap coefficient. (h-i) Activity of IFNγ response associated transcription factors (h) IRF1 and (i) STAT1 in pre- and post-treatment timepoints of patient samples (n=26) in ‘stable’ and ‘increase’ sub-groups. (j) Differential change in expression levels of previously reported immune-responsive genes and resistance associated therapeutic targets in literature in the ‘stable’ or ‘increase’ sub-group. Benjamini–Hochberg (BH) method was used for p-value adjustment. Statistical comparisons in panel h and i were performed using two-tailed paired t-test. See also Figure S4 and Table S6.
Figure 5.
Figure 5.. Genomic dynamics in acquired resistance to PD-1 blockade in lung cancer.
(a) Summary of somatic mutations (missense and indels) in samples from our immune checkpoint blockade (ICB)-resistance cohort for known driver genes in non-small cell lung cancer (NSCLC). Pattern of mutations of recurrently mutated genes derived from a previous study. The heatmap also indicates the unique and shared mutations in each sample and the proportion of mutations associated with key somatic signatures (smoking and APOBEC) associated with lung cancer. (b) Percentage loss or gain of clonal and sub-clonal mutations in paired samples (n=24) from each patient. (c) Comparison of global p-value estimates for genes (n=20,091) derived from dN/dS analysis of missense, truncations and indels to evaluate gene-level selection pressure in pre- and post-treatment samples estimated using dndscv method. (d) Comparison of global p-value estimates genes to identify gene sets under positive selection in pre- and post-treatment samples. The change in gene level global p-value between pre- and post-treatment samples (shown in c) was used to order genes and estimate GSEA normalized enrichment score and p-value for each gene set. (e) Summary of key changes in expression and mutations in nine patients with pre- and post-treatment measurements for both expression and exome. The private mutations in post-treatment lesions of patients in genes part of antigen presentation pathway (KEGG or REACTOME) are shown. (F,G) Immunohistochemistry based quantification of (f) HLA/MHC-I and (g) B2M. The pre-treatment lesion of patient AR_19 did not have enough tissue for immunohistochemistry. (h) Schematics of samples obtained from patients prior enrollment on Study 06 – a phase 1b study in advanced NSCLC where patients were treated with durvalumab (Durva) and tremelimumab (Treme) as a second line therapy. Patients enrolled in the Study 06 trial were either naïve to immunotherapy (IO) treatment, had progressed without initial objective response (primary resistant), or progressed after an initial objective response (acquired resistant) on a previous line of anti-PD-(L)1 monotherapy. (i) Violin plot of ssGSEA enrichment scores for the hallmark IFNγ response gene set for samples from the three patient groups. ssGSEA enrichment scores of samples from patients with acquired resistance and patients who were ICB naïve were compared using wilcoxon rank-sum test. See also Figure S5 and Tables S7, S8.
Figure 6.
Figure 6.. Cell lines derived from mouse CT26 tumors with acquired resistance to PD-1 show dysfunctional IFNγ signalling
(a) Tumor volume over time after treatment with anti-PD-1 therapy or control (Vehicle) for parental (CT26 parental) and resistant cells (CT26 anti-PD-1 Res.) (n = 9 per group). (b) Percentage of mice that resisted anti-PD-1 treatment. (c) Experimental design for development of ICB-resistance model from anti-PD-1 treatment of CT26-derived tumors in mice. Cell lines were derived from tumors and subjected to RNA sequencing. (d) principal component analysis (PCA) of IFNγ-untreated samples i.e. parental (sensitive), 2nd round and 4th round ICB-resistant cells based on enrichment scores of hallmark gene sets. (e) Principal components feature loadings of hallmark gene sets with both magnitude and direction. Biological processes in hallmark gene sets were categorized into sub-groups as previously described and the vectors were color-coded accordingly. (f-i) Enrichment scores in parental, 2nd and 4th round cells for the following genesets: (f) IFNγ response pathway, (g) STAT1, (h) IRF1 and (i) antigen processing machinery. (j) Comparison of significance of change in enrichment score between IFNγ stimulated (IFNγs) and IFNγ untreated (IFNγu) 2nd round and significance of change in enrichment score between IFNγs and IFNγu parental cells. (k) Comparison of significance of change in enrichment score between IFNγs and IFNγu 4th round and significance of change in enrichment score between IFNγs and IFNγu parental cells. (l-o) Comparison of enrichment scores between IFNγu vs IFNγs (parental or 2nd or 4th) cells for the following genesets: (l) IFNγ response pathway, (m) IRF1, (n) STAT1 and (o) antigen processing machinery. Statistical comparisons in panels f, g, h, i, l, m n and o were performed using unpaired t-test. For all panels, error bars are the standard error from the mean. See also Figure S6 and Table S9.
Figure 7.
Figure 7.. Acquired resistance to immune checkpoint blockade (ICB) associates with induction of terminally exhausted CD8+ T cells in the LLC1 syngeneic lung cancer mouse model.
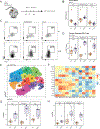
(a) Experimental design of anti-PD-1 + anti-CTLA-4 therapy treatment schedule in the LLC1 mouse model following implantation of parental (LLC1), 3~4 weeks IFNγ stimulated (γLLC1) and ICB-resistant LLC1 cell lines. (b) Comparison of tumor weights harvested on Day 16 in parental (LLC1), respective tumor types following ICB demonstrated that tumors with chronic IFN features (γLLC1 and ResResLLC1) do not respond to ICB. (c) Representative flow cytometric plots to show the expression of PD-1 and TIM-3 on CD8+ T cells from non-treated and ICB-treated tumors. (d) Comparison of percentage of PD-1+ TIM-3+ terminally exhausted CD8 T cells in tumors.(e) Unsupervised clustering of CD8 T cell population based on expression of T cell focused immune profiling panel. (f) A heatmap to indicate the levels of the different T cell related markers across the 12 meta-clusters, defined of the unsupervised clustering of CD8 T cells. (g,h) Comparison of percentage frequency of meta-clusters 5 (MC05) and 6 (MC06) within the CD8 T cell population between non-treated and ICB-treated LLC1, γLLC1 and ResResLLC1 tumors. The boxplots in panels b,d,g and h indicate median and the lower and upper hinges correspond to the first and third quartiles. The upper whisker extends from the hinge to the largest value no further than 1.5 * IQR (inter-quartile range) from the hinge. The lower whisker extends from the hinge to the smallest value at most 1.5 * IQR of the hinge. Statistical comparisons in panels b, d, g and h were performed using wilcoxon rank-sum test. See also Figure S7.

References

    1. Gandhi L, Rodríguez-Abreu D, Gadgeel S, Esteban E, Felip E, De Angelis F, Domine M, Clingan P, Hochmair MJ, Powell SF, et al. (2018). Pembrolizumab plus Chemotherapy in Metastatic Non-Small-Cell Lung Cancer. N. Engl. J. Med. 378, 2078–2092. 10.1056/NEJMoa1801005. - DOI - PubMed
    1. Reck M, Rodríguez-Abreu D, Robinson AG, Hui R, Csőszi T, Fülöp A, Gottfried M, Peled N, Tafreshi A, Cuffe S, et al. (2016). Pembrolizumab versus Chemotherapy for PD-L1-Positive Non-Small-Cell Lung Cancer. N. Engl. J. Med. 375, 1823–1833. 10.1056/NEJMoa1606774. - DOI - PubMed
    1. Schoenfeld AJ, and Hellmann MD (2020). Acquired Resistance to Immune Checkpoint Inhibitors. Cancer Cell 37, 443–455. 10.1016/j.ccell.2020.03.017. - DOI - PMC - PubMed
    1. Abdallah N, Nagasaka M, Abdulfatah E, Shi D, Wozniak AJ, and Sukari A. (2018). Non-small cell to small cell lung cancer on PD-1 inhibitors: two cases on potential histologic transformation. Lung Cancer Auckl. NZ 9, 85–90. 10.2147/LCTT.S173724. - DOI - PMC - PubMed
    1. Anagnostou V, Smith KN, Forde PM, Niknafs N, Bhattacharya R, White J, Zhang T, Adleff V, Phallen J, Wali N, et al. (2017). Evolution of Neoantigen Landscape during Immune Checkpoint Blockade in Non-Small Cell Lung Cancer. Cancer Discov. 7, 264–276. 10.1158/2159-8290.CD-16-0828. - DOI - PMC - PubMed

Publication types