. 2024 Feb 12;42(2):238-252.e9.
doi: 10.1016/j.ccell.2023.12.019. Epub 2024 Jan 11.

Response to Bruton's tyrosine kinase inhibitors in aggressive lymphomas linked to chronic selective autophagy

Affiliations

Response to Bruton's tyrosine kinase inhibitors in aggressive lymphomas linked to chronic selective autophagy

James D Phelan et al. Cancer Cell. .

Abstract

Diffuse large B cell lymphoma (DLBCL) is an aggressive, profoundly heterogeneous cancer, presenting a challenge for precision medicine. Bruton's tyrosine kinase (BTK) inhibitors block B cell receptor (BCR) signaling and are particularly effective in certain molecular subtypes of DLBCL that rely on chronic active BCR signaling to promote oncogenic NF-κB. The MCD genetic subtype, which often acquires mutations in the BCR subunit, CD79B, and in the innate immune adapter, MYD88L265P, typically resists chemotherapy but responds exceptionally to BTK inhibitors. However, the underlying mechanisms of response to BTK inhibitors are poorly understood. Herein, we find a non-canonical form of chronic selective autophagy in MCD DLBCL that targets ubiquitinated MYD88L265P for degradation in a TBK1-dependent manner. MCD tumors acquire genetic and epigenetic alterations that attenuate this autophagic tumor suppressive pathway. In contrast, BTK inhibitors promote autophagic degradation of MYD88L265P, thus explaining their exceptional clinical benefit in MCD DLBCL.

Keywords: Bruton’s tyrosine kinase; DLBCL; autophagy; functional genomics; proteomics; targeted therapy.


Conflict of interest statement

Declaration of interests T.O. received research funding from Gilead and Merck KGaA, is a consultant/received honoraria for/from Beigene, Roche, Janssen, Merck KGaA, Gilead, Kronos Bio and Abbvie (all not related to this work). Z.W. is a current employee at GSK. A.L.S III is a current employee at AstraZeneca and has stock options.

Figures
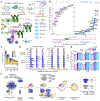
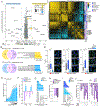
Figure 1.
Figure 1.. CRISPR screens reveal regulators of oncogenic signaling in ABC DLBCL
A. Scheme of CRISPR drug modifier screens. B. Ranked gene list from BTK inhibitor screens. Outliers promoting synergy (purple), resistance (blue), or autophagy-related (dark blue) are highlighted. C. Cumulative screen scores are displayed for ATG genes. D. Outgrowth of GFP+ sgRNAs in ABC lines treated with inhibitors normalized to day 0. Mean+SEM; n≥3. E. Relative MFI (GFP/RFP) of LC3 constructs in sgRNA-transduced ABC lines as shown, Starv=starvation media, Torin1, Acal=acalabrutinib, BAF=bafilomycin A1. Mean+SEM, n≥3. F. ATGABC pathway scheme with screen hits highlighted. Also see Figure S1/Table S1.
Figure 2.
Figure 2.. NF-κB is inhibited by the ATGABC pathway.
A. Acalabrutinib CRISPR screen results in control (NT and ATG5) vs ATGABC (ATG101 and ATG9A) knockout cells. NF-κB positive regulators (light blue), NF-κB negative regulators (dark blue), and ATG genes (pink) are highlighted. Size scaled by p-value; color scaled by toxicity of control DMSO screens. B. Gene scores from screens in A. C. Mean p50 translocation (ImageStream) in HBL1 and TMD8 cells treated for 24h with DMSO or acalabrutinib in the indicated genotypes. Mean+SEM, n=4, one-way ANOVA. D. Relative gene signature changes vs p-value of DMSO vs Acalabrutinib-treated groups. Averaged values from TMD8 cells with control sgRNAs (NT, ATG5, ATG7, ULK1, ULK2; left panel) or ATGABC sgRNAs (ATG9A, ATG101, ATG14, RB1CC1, WIPI2; right panel). Two-sided t-test; dotted line indicates multiple-testing correction signficance. E. IL-10 concentrations from supernatant of acalabrutinib treated TMD8 cells with indicated sgRNAs. Mean+SEM, n=3. *P ≤ 0.05, **P ≤ 0.01, ***P ≤ 0.001, ****P ≤ 0.0001. Also see Figure S2/Tables S2-3.
Figure 3.
Figure 3.. Loss of the ATGABC pathway in DLBCL tumors.
A. Homozygous (HOMDEL, dark blue) or heterozygous (HETLOSS, light blue) deletions of the ATG13 locus are displayed on chromosome 11. The minimal common region of copy number alterations are boxed displaying genes in this region. B. ATG13 DNA copy number vs mRNA expression in 281 ABC DLBCL samples with linear regression curve; non-zero slope. C. CRISPR screen scores for sgRNAs targeting ATG13 and HARBI1 in minimal shared amplified regions from A in HBL1 and TMD8 cells. D. Pearson correlation matrix of gene expression values of ATGABC pathway genes in indicated samples. E. Relative gene expression change stratified by assigned DLBCL genetic subtype (ie. MCD vs. non-MCD) of indicated ATGABC pathway genes in the NCI DLBCL cohort (left panel) or the BCC DLBCL cohort (right panel). *P ≤ 0.05, **P ≤ 0.01, ***P ≤ 0.001, ****P ≤ 0.0001 (two sample t-test). Also see Figure S3.
Figure 4.
Figure 4.. Protein degradation by chronic selective autophagy.
A. Relative protein abundance in HBL1 and TMD8 cells comparing control (ATG5 vs. NT control; n=4) vs ATGABC genotypes (ATG9A or ATG101 vs. NT control; n=7). Size scaled by percentage of experiments each peptide was profiled; color scaled by percentage of experiments each peptide was enriched. Select proteins upregulated in ATGABC cells are labeled. B. Immunoblots for the indicated proteins in HBL1 cells transduced with indicated sgRNAs and treated with acalabrutinib for 24h. C. Relative MFI (GFP/RFP) of selective autophagy receptor constructs in ATG9A KO vs. control in TMD8 (light blue) and HBL1 (dark blue) cells. Mean+SEM, n≥3 biological replicates. Also see Figure S4/Table S4.
Figure 5.
Figure 5.. Ubiquitinated My-T-BCR accumulates upon disruption of chronic selective autophagy.
A. Confocal images and quantification of PLA puncta (red) for IgM-pIκBα (left) and MYD88-BCL10 (right) in TMD8 cells with indicated sgRNAs after overnight BTKi treatment (Acala=acalabrutinib). Cells were stained with wheat-germ agglutinin (green) and DAPI (blue). Scale bar: 10μm. Box and whiskers: 10-90% percentile; n=3, p-value from one-way ANOVA. B. Left: Scatter plot of MYD88L265P-BioID2 interactomes in HBL1 and TMD8 cells with control sgRNA vs. ATGABC sgRNAs (ATG9A or ATG101 KO, n=5). Size scaled by percentage of experiments a protein was profiled; color scaled by percentage of experiments a protein was enriched in ABCATG. Right, enrichment of ATGABC pathway proteins biotinylated by MYD88L265P in HBL1 and TMD8 control (purple) or ATGABC sgRNAs (blue); p-value from two-sided t-test. C. Relative MFI (GFP/RFP) of indicated fusion proteins in TMD8 cells with ATGABC or NT (Cntl.) sgRNAs treated with BAF (bafilomycin A1). Mean+SEM, n≥3. D. Left, immunoblots of total ubiquitin (Ub) and MYD88 in control (IgG) or MYD88 immunoprecipitated TMD8 cell lysates (SDS lysis) expressing the indicated sgRNAs. Right, quantification of Ub MYD88 in cells with ATG9A or TNFAIP3 sgRNAs normalized to NT control. Mean+SEM, n≥3, p-value from one-way ANOVA. E. Distribution (left) and ranked z-score (right) of ubiquitinated peptides in HBL1 and TMD8 cells with ATGABC (ATG9A or ATG101) vs NT control sgRNAs. F. Immunoblots of total ubiquitin (Ub) after ectopic expression of MYD88L265P, BCL10, IRAK1 or MALT1 and immunoprecipitation of MYD88, BCL10, IRAK1 or MALT1 as indicated in TMD8 cell lysates (SDS lysis) expressing NT control or ATG9A sgRNAs. *P ≤ 0.05, **P ≤ 0.01, ***P ≤ 0.001, ****P ≤ 0.0001. Also see Figure S5/Table S5-6.
Figure 6.
Figure 6.. Functional dissection of MYD88L265P autophagic turnover.
A. Average CRISPR screen score for the MYD88L265P autophagy reporter vs. average MYD88L265P BioID2 enrichment in ATGABC KOs. Data are filtered for proteins with ≥2-fold enrichment. Size scaled by average ubiquitination/protein; color scaled by BTKi CRISPR screen scores (Fig. 1B). CRISPR scores corresponding to proteins not profiled are displayed below the x-axis. B. Venn diagrams of genes/proteins meeting the displayed criteria from A. Bar graphs display statistical pathway enrichment from overlapping gene sets. C. Heatmap of hierarchical clustered genes using Pearson correlation values calculated from the indicated CRISPR screen hits scoring as high (blue) or low (purple). D. PLA scores and confocal images of PLA puncta (red) for TBK1:MYD88, TBK1:NBR1, or TBK1:p62 in TMD8 cells transduced with indicated sgRNAs. Cells were stained with wheat-germ agglutinin (green) and DAPI (blue). Scale bar: 10μm. Box and whiskers: 10-90% percentile; n=3, ****P ≤ 0.0001, one-way ANOVA. E-F. Relative MFI (GFP/RFP) of MYD88L265P-RFP-GFP in TMD8 cells treated with TBK1 inhibitor, GSK-8612 (E); in TMD8 and HBL1 cells after 72 hours of acalabrutinib (25nM) or GSK-8612. n=4 biologically independent replicates (F). G. Outgrowth of GFP+ sgRNAs in TMD8 cells treated with acalabrutinib normalized to day 0. Mean+SEM, n≥3. H. Relative MFI (GFP/RFP) of MYD88L265P-RFP-GFP in TMD8 cells treated with acalabrutinib (25nM), sotrastaurin, or AZD-2014 (200nM) for 3 days. Mean+SEM, n=3. I. Outgrowth of GFP+ sgRNAs in TMD8 cells treated with sotrastaurin normalized to day 0. Mean+SEM, n=4. J. Relative MFI (GFP/RFP) of MYD88L265P-RFP-GFP in TMD8 and HBL1 cells at indicated times with single or combination acalabrutinib (10nM), AZD-2014 (50nM), or lenalidomide. Mean+SEM, n=3. Also see Figure S6/Table S7.
Figure 7.
Figure 7.. Chronic Selective Autophagy Targets My-T-BCR signaling in MCD DLBCL.
A. Model of oncogenic signaling in MCD DLBCL. B. BCR inhibitors disrupt the My-T-BCR and promote MYD88L265P autophagic degradation. C. Summary of Chronic Selective Autophagy of MYD88L265P.

References

    1. Swerdlow SH, Campo E, Pileri SA, Harris NL, Stein H, Siebert R, Advani R, Ghielmini M, Salles GA, Zelenetz AD, and Jaffe ES (2016). The 2016 revision of the World Health Organization classification of lymphoid neoplasms. Blood 127, 2375–2390. 10.1182/blood-2016-01-643569. - DOI - PMC - PubMed
    1. Alizadeh AA, Eisen MB, Davis RE, Ma C, Lossos IS, Rosenwald A, Boldrick JC, Sabet H, Tran T, Yu X, et al. (2000). Distinct types of diffuse large B-cell lymphoma identified by gene expression profiling. Nature 403, 503–511. 10.1038/35000501. - DOI - PubMed
    1. Davis RE, Brown KD, Siebenlist U, and Staudt LM (2001). Constitutive nuclear factor kappaB activity is required for survival of activated B cell-like diffuse large B cell lymphoma cells. J Exp Med 194, 1861–1874. 10.1084/jem.194.12.1861. - DOI - PMC - PubMed
    1. Wright G, Tan B, Rosenwald A, Hurt EH, Wiestner A, and Staudt LM (2003). A gene expression-based method to diagnose clinically distinct subgroups of diffuse large B cell lymphoma. Proc Natl Acad Sci U S A 100, 9991–9996. 10.1073/pnas.1732008100. - DOI - PMC - PubMed
    1. Davis RE, Ngo VN, Lenz G, Tolar P, Young RM, Romesser PB, Kohlhammer H, Lamy L, Zhao H, Yang Y, et al. (2010). Chronic active B-cell-receptor signalling in diffuse large B-cell lymphoma. Nature 463, 88–92. 10.1038/nature08638. - DOI - PMC - PubMed

Publication types

MeSH terms

Substances