. 2024 Feb 1;187(3):659-675.e18.
doi: 10.1016/j.cell.2023.12.010. Epub 2024 Jan 11.

Hypoxia and intra-complex genetic suppressors rescue complex I mutants by a shared mechanism

Affiliations

Hypoxia and intra-complex genetic suppressors rescue complex I mutants by a shared mechanism

Joshua D Meisel et al. Cell. .

Abstract

The electron transport chain (ETC) of mitochondria, bacteria, and archaea couples electron flow to proton pumping and is adapted to diverse oxygen environments. Remarkably, in mice, neurological disease due to ETC complex I dysfunction is rescued by hypoxia through unknown mechanisms. Here, we show that hypoxia rescue and hyperoxia sensitivity of complex I deficiency are evolutionarily conserved to C. elegans and are specific to mutants that compromise the electron-conducting matrix arm. We show that hypoxia rescue does not involve the hypoxia-inducible factor pathway or attenuation of reactive oxygen species. To discover the mechanism, we use C. elegans genetic screens to identify suppressor mutations in the complex I accessory subunit NDUFA6/nuo-3 that phenocopy hypoxia rescue. We show that NDUFA6/nuo-3(G60D) or hypoxia directly restores complex I forward activity, with downstream rescue of ETC flux and, in some cases, complex I levels. Additional screens identify residues within the ubiquinone binding pocket as being required for the rescue by NDUFA6/nuo-3(G60D) or hypoxia. This reveals oxygen-sensitive coupling between an accessory subunit and the quinone binding pocket of complex I that can restore forward activity in the same manner as hypoxia.

Keywords: C. elegans; NADH:ubiquinone oxidoreductase; NDUFA6; NDUFS4; complex I; electron transport chain; hyperoxia; hypoxia; mitochondria; oxygen.


Conflict of interest statement

Declaration of interests V.K.M. is listed as an inventor on patents filed by MGH on therapeutic uses of hypoxia. V.K.M. is a paid advisor to 5am Ventures. O.S.S. was a paid consultant for Proteinaceous, Inc. V.K.M. is on the Advisory Board at Cell.

Figures
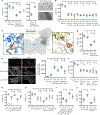
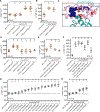
Figure 1.
Figure 1.. A subset of complex I mutations are rescued by hypoxia independent of HIF
A. Growth of animals for 2 days (left) and 5 days (right) at 21% or 1% oxygen at room temperature. B. Growth of wild type and nuo-6(qm200) animals for two days; growth of nuo-2(tm5258), nuo-5(tm2751), nduf-7(tm1436), and nduf-9(mg747) animals for 4 days at room temperature. C. Ovine NADH:ubiquinone oxidoreductase, or complex I (PDB: 6ZKC) in closed conformation. Colored red (on right) are the 6 C-terminal amino acids deleted in NDUFS7/nduf-7(et19) that interact with NDUFA9/NDUF-9 (yellow), phospholipid headgroups (pink), and NADPH (purple). Colored red (on left) is NDUFS2/GAS-1(R290) which is substituted to K in NDUFS2/gas-1(fc21) and interacts with conserved residues E200 and R260 of ND1/NDUO-1 (grey). All NDUFS4/LPD-5 (orange) is lost in lpd-5(mg746). D. Growth of animals for 2 days at room temperature. E. Fluorescent images of age-matched L4 stage animals containing hsp-6::gfp grown at 21% or 1% oxygen for one generation (left). Images were acquired at 69x magnification with an exposure time of 100 ms. Mean intestinal fluorescence of hsp-6::gfp in pictured animals (right). F. Growth of wild type, mev-1(kn1), and clk-1(qm30) animals for 2 days; growth of isp-1(qm150) animals for 3 days. The same wild type controls are used in panel 1D as the data were collected in the same experiment. G. Growth of animals for 3 days at 20°C. H-J. Growth of animals for 2 days (H), 5 days (I), or for 4 days (J) at room temperature. Statistical significance was calculated using one-way ANOVA followed by Tukey’s Multiple Comparison Test. Error bars represent standard deviation. n.s. = not significant, * = p value <0.05, ** = p value <0.01, *** = p value <0.001. See also Figure S1 and Table S1.
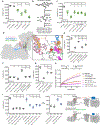
Figure 2.
Figure 2.. Complex I mutants rescued by hypoxia are sensitive to moderate hyperoxia and suppressed by intra-complex mutations in NDUFA6 or NDUFA5
A. Growth of animals following L1 synchronization at 21% oxygen (black), 50% oxygen (orange), or 100% oxygen (red) incubated at 20°C. B. Mean intestinal fluorescence of hsp-6::gfp in L4 stage animals incubated at 21%, 50%, or 100% oxygen for 1 day at 20°C. Exposure time = 100 ms, magnification = 69x. C. gas-1(fc21) or nduf-7(et19) P0 animals were randomly mutagenized with EMS at 21% oxygen. F2 progeny were transferred to the non-permissive 50% oxygen tension and selected for growth. NDUFS4/lpd-5 null C. elegans are not fertile at any oxygen tension, making a forward genetic screen challenging. D. Ovine complex I (PDB: 6ZKC) in closed conformation. Colored red is the ovine residue (K57) corresponding to C. elegans suppressor mutation NDUFA6/nuo-3(G60D) which lies in the LYRM domain responsible for binding the acyl chain (purple) of NDUFAB1. E. Growth of animals for 4 days at 50% oxygen followed by 1 day at 21% oxygen. F. Growth of animals for 2 days (graph, left) and 4 days (images, right) at room temperature. G. Mean intestinal fluorescence of hsp-6::gfp in L4 stage animals incubated at continuous 21% oxygen at 20°C. For all panels statistical significance was calculated using one-way ANOVA followed by Tukey’s Multiple Comparison Test. Error bars represent standard deviation. n.s. = not significant, * = p value <0.05, ** = p value <0.01, *** = p value <0.001. See also Figure S2 and Table S2.
Figure 3.
Figure 3.. Rescue of complex I mutants by hypoxia and nuo-3(G60D) is not due to alleviation of mitochondrial ROS
A. MitoSOX fluorescence quantified by measuring the mean fluorescence in the posterior bulb of the pharynx after 1 day. Images were taken with an exposure time of 1 second at 63x magnification. B. SDS-PAGE western blot of isolated mitochondria purified from animals grown at 21% or 1% oxygen for 4 days. The mitochondrial proteins modified by 4-HNE in this experiment are unidentified. C. NADH-driven complex I-dependent superoxide production in the absence of piericidin by isolated mitochondrial membranes at 21% oxygen. Superoxide is converted by SOD to hydrogen peroxide, which then oxidizes AmplexRed to Resorufin via HRP. Resorufin absorbs light at 557 nm. D. Growth of animals for 2 days at room temperature at 21% or 50% oxygen. For all panels statistical significance was calculated using one-way ANOVA followed by Tukey’s Multiple Comparison Test. Error bars represent standard deviation. n.s. = not significant, * = p value <0.05, ** = p value <0.01, *** = p value <0.001. See also Figure S3.
Figure 4.
Figure 4.. Complex I levels are compromised in oxygen-sensitive mutants but their restoration does not underlie the rescue by hypoxia or nuo-3(G60D)
A. BN-PAGE of isolated mitochondria followed by western blot from animals grown continuously at 21% oxygen. B. BN-PAGE of isolated mitochondria followed by complex I in-gel dehydrogenase activity assay from animals exposed to 50% oxygen for 1 day. C-D. TMT quantitative proteomics from animals exposed to 50% oxygen for 2 days. Plotted are log 2-fold ratios of all proteins from which at least two peptides were quantified. Complex I subunits are colored according to structural module. E. TMT quantitative proteomics from animals exposed to 50% oxygen for 2 days. Plotted are log 2-fold ratios of all complex I N module (orange) and Q module (yellow) subunits from which at least two peptides were quantified. F-G. SDS-PAGE followed by western blot of whole worm lysate from animals exposed to 21%, 50%, or 1% oxygen. For all panels statistical significance was calculated using one-way ANOVA followed by Tukey’s Multiple Comparison Test. n.s. = not significant, * = p value <0.05, ** = p value <0.01, *** = p value <0.001. See also Figure S4 and Table S3.
Figure 5.
Figure 5.. NDUFA6/nuo-3(G60D) and hypoxia rescue complex I forward activity in oxygen-sensitive mutants
A. Ratio of reduced CoQ9H2 to oxidized CoQ9 as determined by mass spectrometry. Samples were extracted from whole worms grown continuously at 21% oxygen. B. TMRM fluorescence quantified by measuring the mean fluorescence in the posterior bulb of the pharynx after 1 day at 21% oxygen. Images were taken with an exposure time of 20 ms at 63x magnification. C-E. Complex I-dependent oxidation of NADH by isolated mitochondrial membranes in vitro. NADH absorbs light at 340 nm. Plotted (at right) are rates of absorbance at 340 nm (minus 380 nm) per minute from the first 20 minutes of linear slopes. F. SDS-PAGE followed by western blot of whole worm lysate from animals exposed to 21% oxygen. Ti[NDI1] animals contain a single-copy integrated transgene expressing mito-targeted NDI1. For all panels statistical significance was calculated using one-way ANOVA followed by Tukey’s Multiple Comparison Test. Error bars represent standard deviation. n.s. = not significant, * = p value <0.05, ** = p value <0.01, *** = p value <0.001. See also Figure S5.
Figure 6.
Figure 6.. Complex I rescue by NDUFA6/nuo-3(G60D) requires LYRM domain activity
A. Growth of animals for 5 days at 50% oxygen followed by 1 day at 21% oxygen. B. Growth of animals for 5 days at 50% oxygen followed by 3 days at 21% oxygen. C. Ovine complex I (PDB: 6ZKC) in closed conformation. Colored red is the residue corresponding to C. elegans nuo-3(G60D) based on homology modelling. Colored red and represented as sticks are residues corresponding to C. elegans LYRM residues Y38, K39, and F70. D-E. Growth of animals for 6 days at 50% oxygen. F. Growth of animals for 5 days at 21% oxygen at 20°C. G-H. Growth of animals for 3 days at 21% oxygen incubated at 20°C. For all panels statistical significance was calculated using one-way ANOVA followed by Tukey’s Multiple Comparison Test or Dunnett’s Multiple Comparison Test (G-H). Error bars represent standard deviation. n.s. = not significant, * = p value <0.05, ** = p value <0.01, *** = p value <0.001. See also Figure S6.
Figure 7.
Figure 7.. Mutations surrounding the CoQ binding pocket block the ability of NDUFA6/nuo-3(G60D) or hypoxia to rescue complex I
A. Growth of animals for 3 days at 21% oxygen with 0, 0.5, or 1.0 μM rotenone. B. nuo-3(G60D) P0 animals were randomly mutagenized with EMS in the absence of rotenone. F2 progeny were transferred to rotenone-containing plates and selected for growth. C. Growth of animals for 2 days at 21% oxygen incubated at room temperature with 0 or 1.0 μM rotenone. D. Ovine complex I (PDB: 6ZKC) in closed conformation. Labelled and colored red are residues corresponding to C. elegans nuo-3(G60D) suppressor mutations NDUFS2/GAS-1(V161I), NDUFS7/NDUF-7(A119T or A119V), and NDUFS7/NDUF-7(M80I). Decylubiquinone is colored magenta. E-F. Growth of animals for 3 days at 21% oxygen incubated at 20°C. G. Growth of animals for 4 days at 21% oxygen incubated at room temperature. H. NADH-driven complex I-dependent superoxide production in the presence or absence of piericidin by isolated mitochondrial membranes at 21% oxygen. Resorufin absorbs light at 557 nm. I. Growth of animals for 3 days (left) and 5 days (right) at 21% or 1% oxygen incubated at room temperature. J. Complex I mutations result in decreased flux through the ETC, leading to local hyperoxia which can further inhibit complex I activity. Hypoxia or NDUFA6/nuo-3(G60D) mutation restore complex I forward activity in a manner dependent on residues surrounding the CoQ binding cavity. For all panels statistical significance was calculated using one-way ANOVA followed by Tukey’s Multiple Comparison Test. Error bars represent standard deviation. n.s. = not significant, * = p value <0.05, ** = p value <0.01, *** = p value <0.001. See also Figure S7.

References

    1. Hirst J. (2013). Mitochondrial Complex I. Annu. Rev. Biochem. 82, 551–575. 10.1146/annurev-biochem-070511-103700. - DOI - PubMed
    1. Sazanov LA (2015). A giant molecular proton pump: structure and mechanism of respiratory complex I. Nat. Rev. Mol. Cell Biol. 16, 375–388. 10.1038/nrm3997. - DOI - PubMed
    1. Stroud DA, Surgenor EE, Formosa LE, Reljic B, Frazier AE, Dibley MG, Osellame LD, Stait T, Beilharz TH, Thorburn DR, et al. (2016). Accessory subunits are integral for assembly and function of human mitochondrial complex I. Nature 538, 123–126. 10.1038/nature19754. - DOI - PubMed
    1. Guerrero-Castillo S, Baertling F, Kownatzki D, Wessels HJ, Arnold S, Brandt U, and Nijtmans L. (2017). The Assembly Pathway of Mitochondrial Respiratory Chain Complex I. Cell Metab 25, 128–139. 10.1016/j.cmet.2016.09.002. - DOI - PubMed
    1. Fiedorczuk K, and Sazanov LA (2018). Mammalian Mitochondrial Complex I Structure and Disease-Causing Mutations. Trends Cell Biol 28, 835–867. 10.1016/j.tcb.2018.06.006. - DOI - PubMed

Publication types

LinkOut - more resources