. 2024 Apr;17(2):169-181.
doi: 10.1016/j.mucimm.2024.01.002. Epub 2024 Jan 11.

A bacterial vesicle-based pneumococcal vaccine against influenza-mediated secondary Streptococcus pneumoniae pulmonary infection

Affiliations

A bacterial vesicle-based pneumococcal vaccine against influenza-mediated secondary Streptococcus pneumoniae pulmonary infection

Saugata Majumder et al. Mucosal Immunol. 2024 Apr.

Abstract

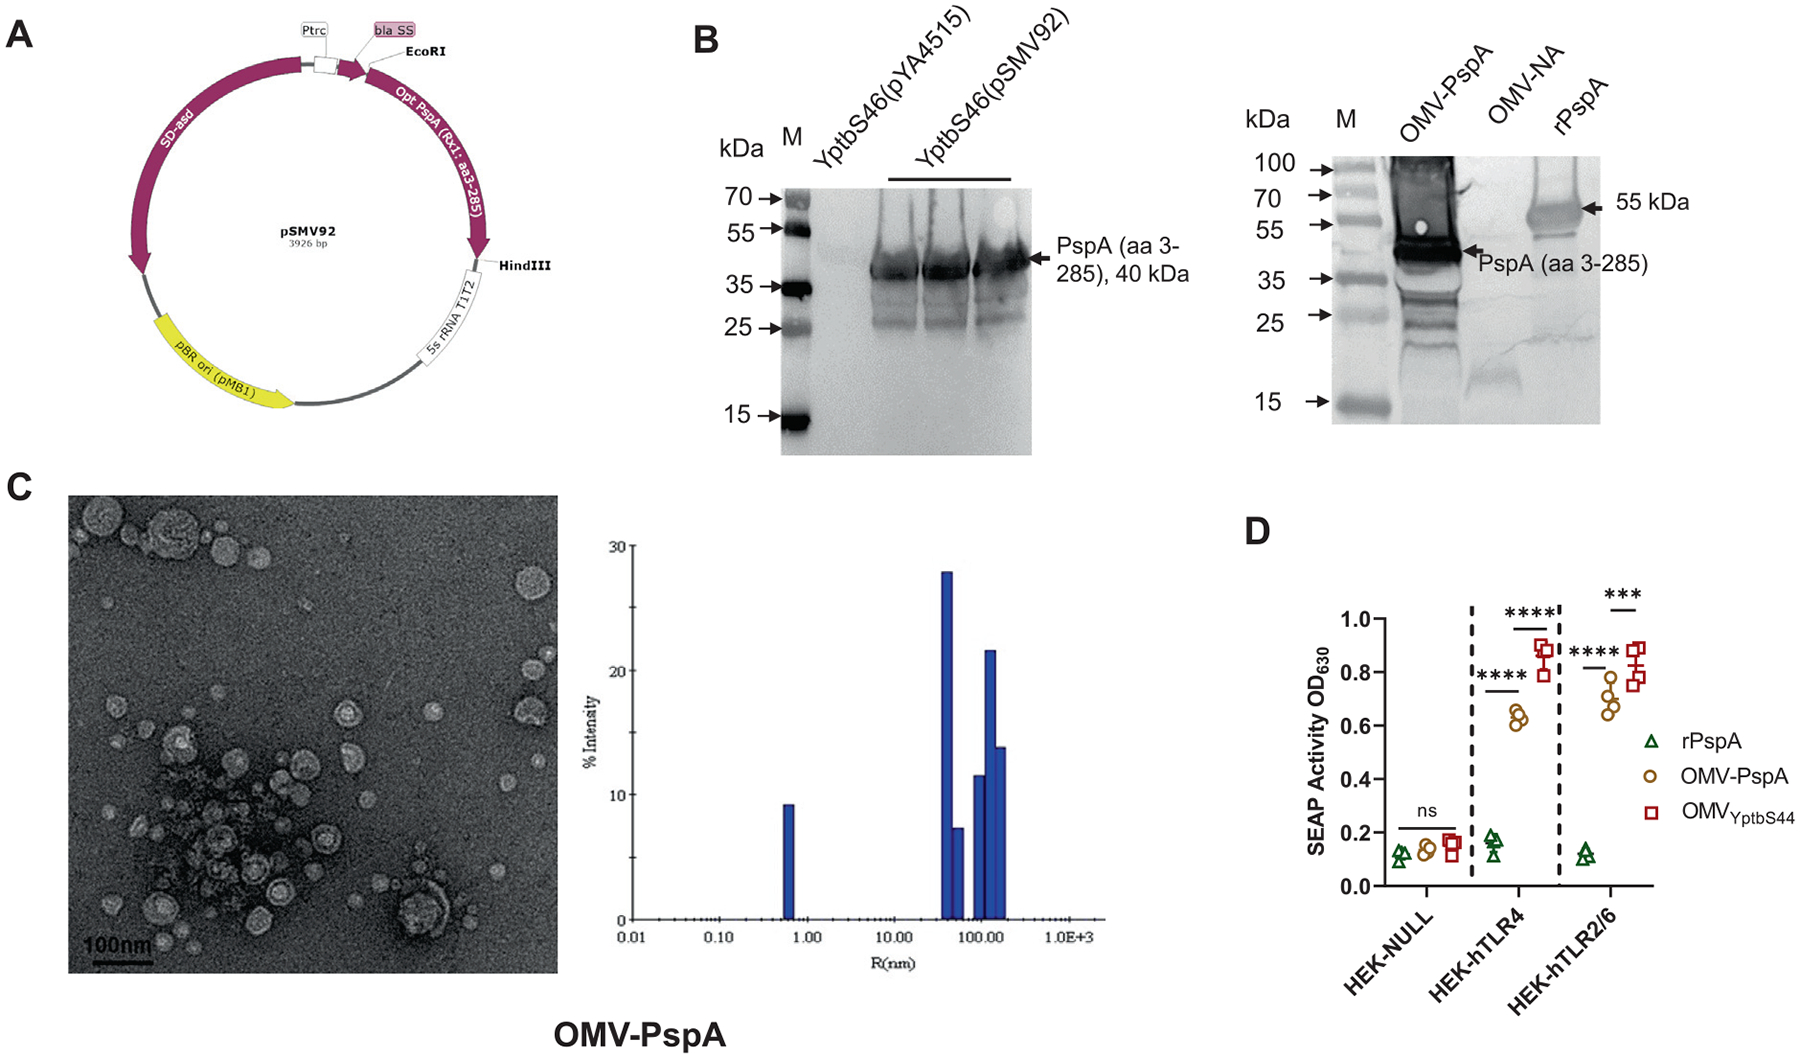
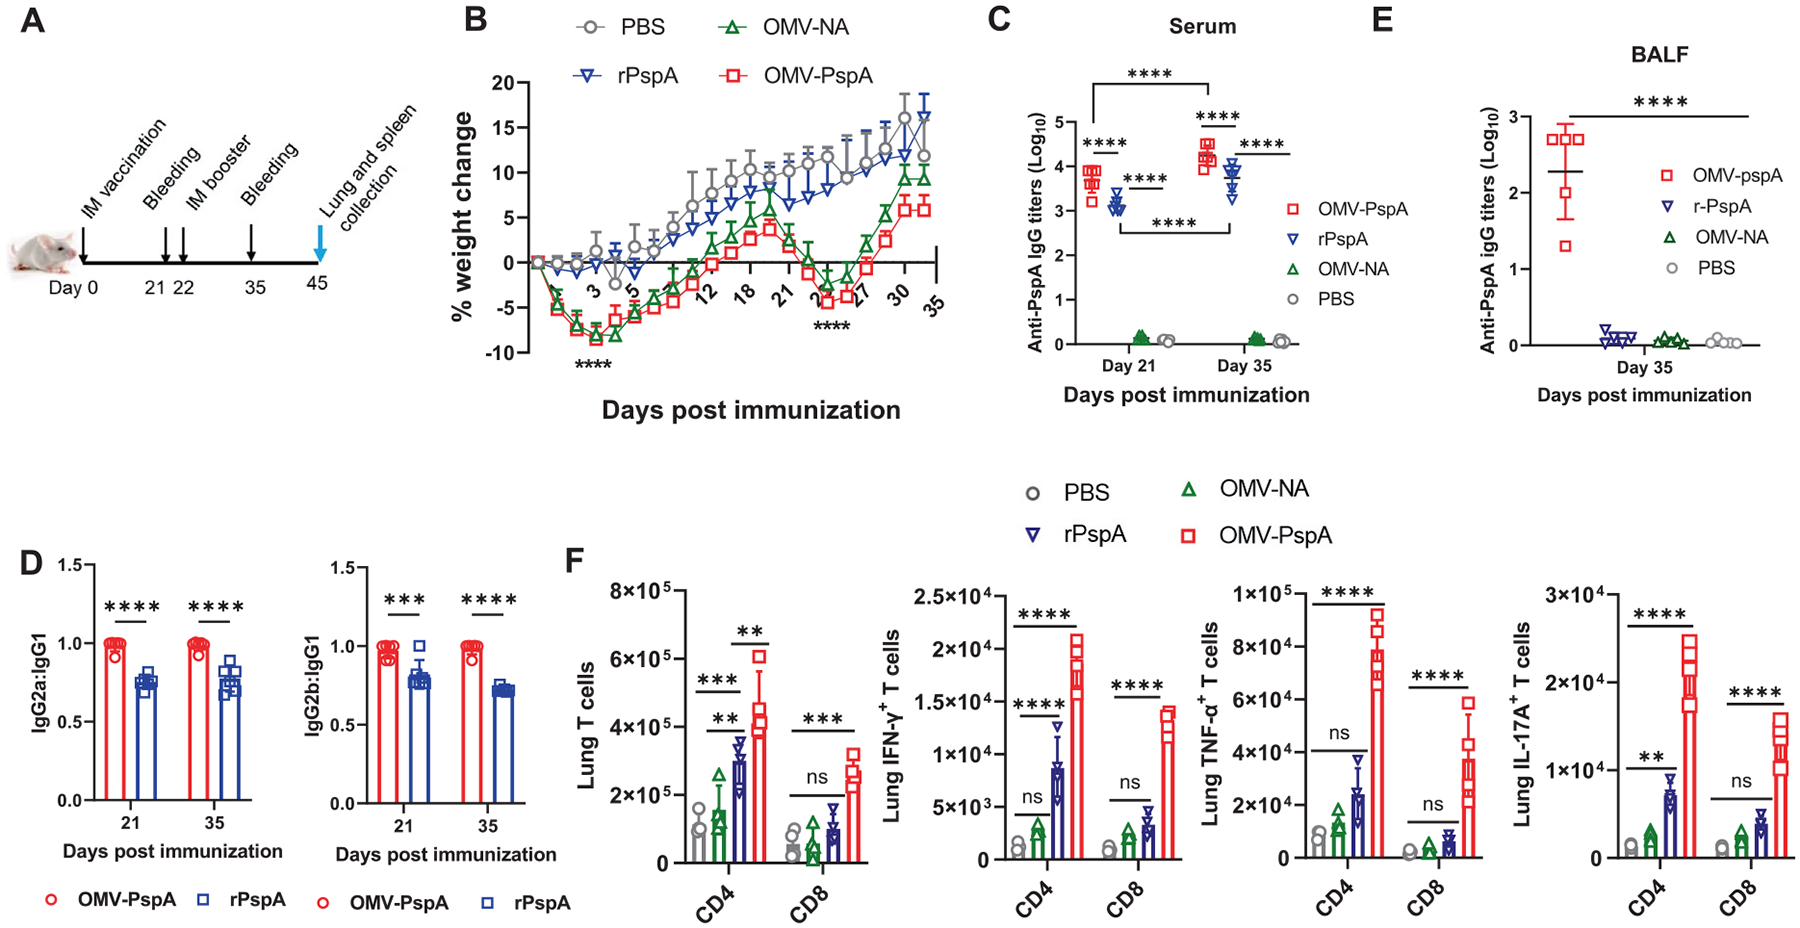
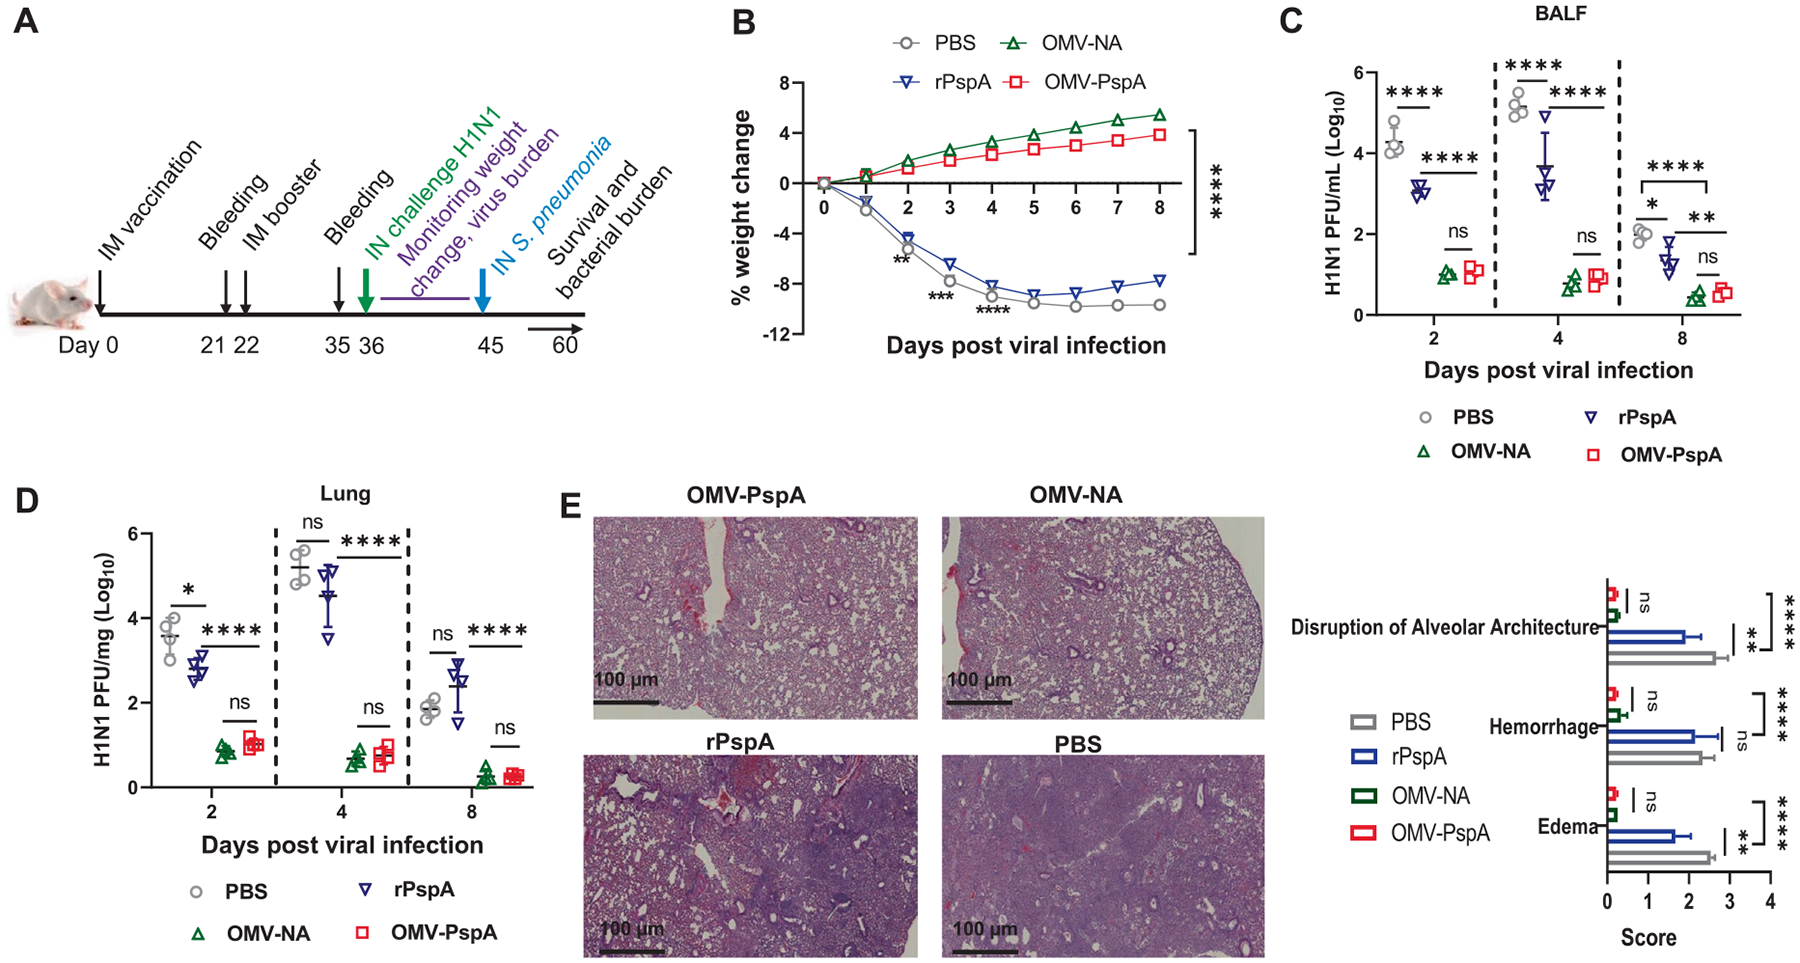
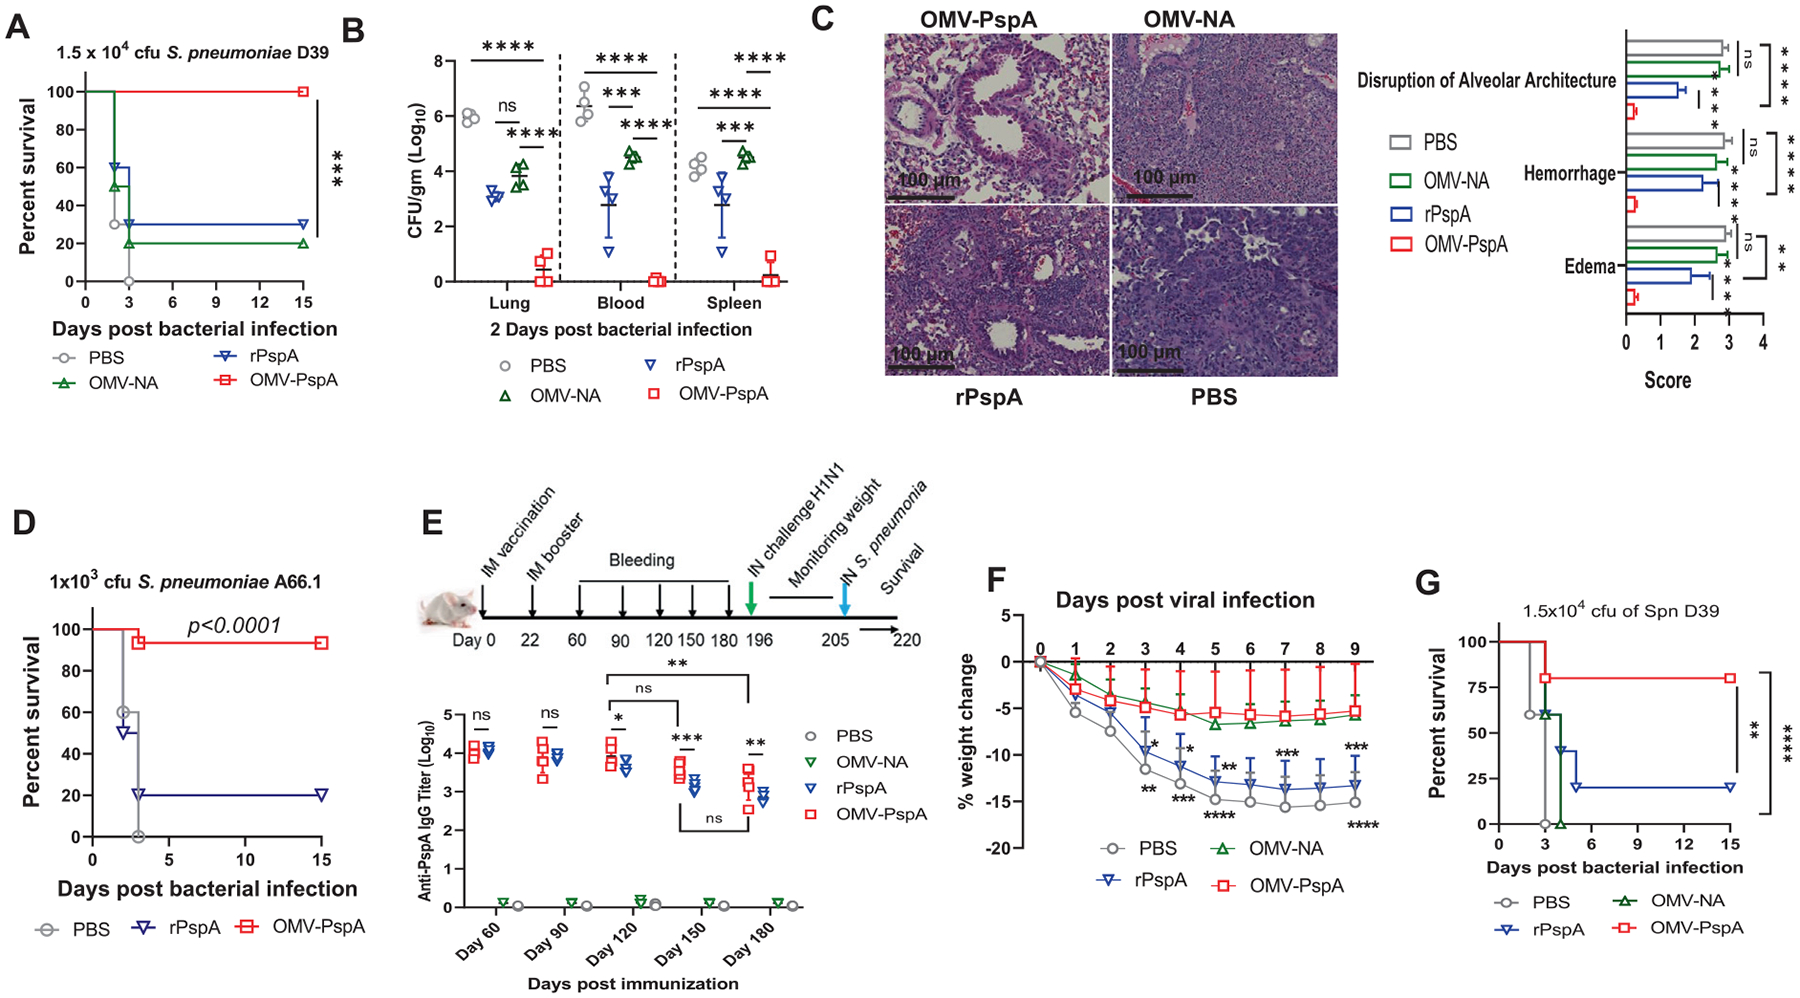
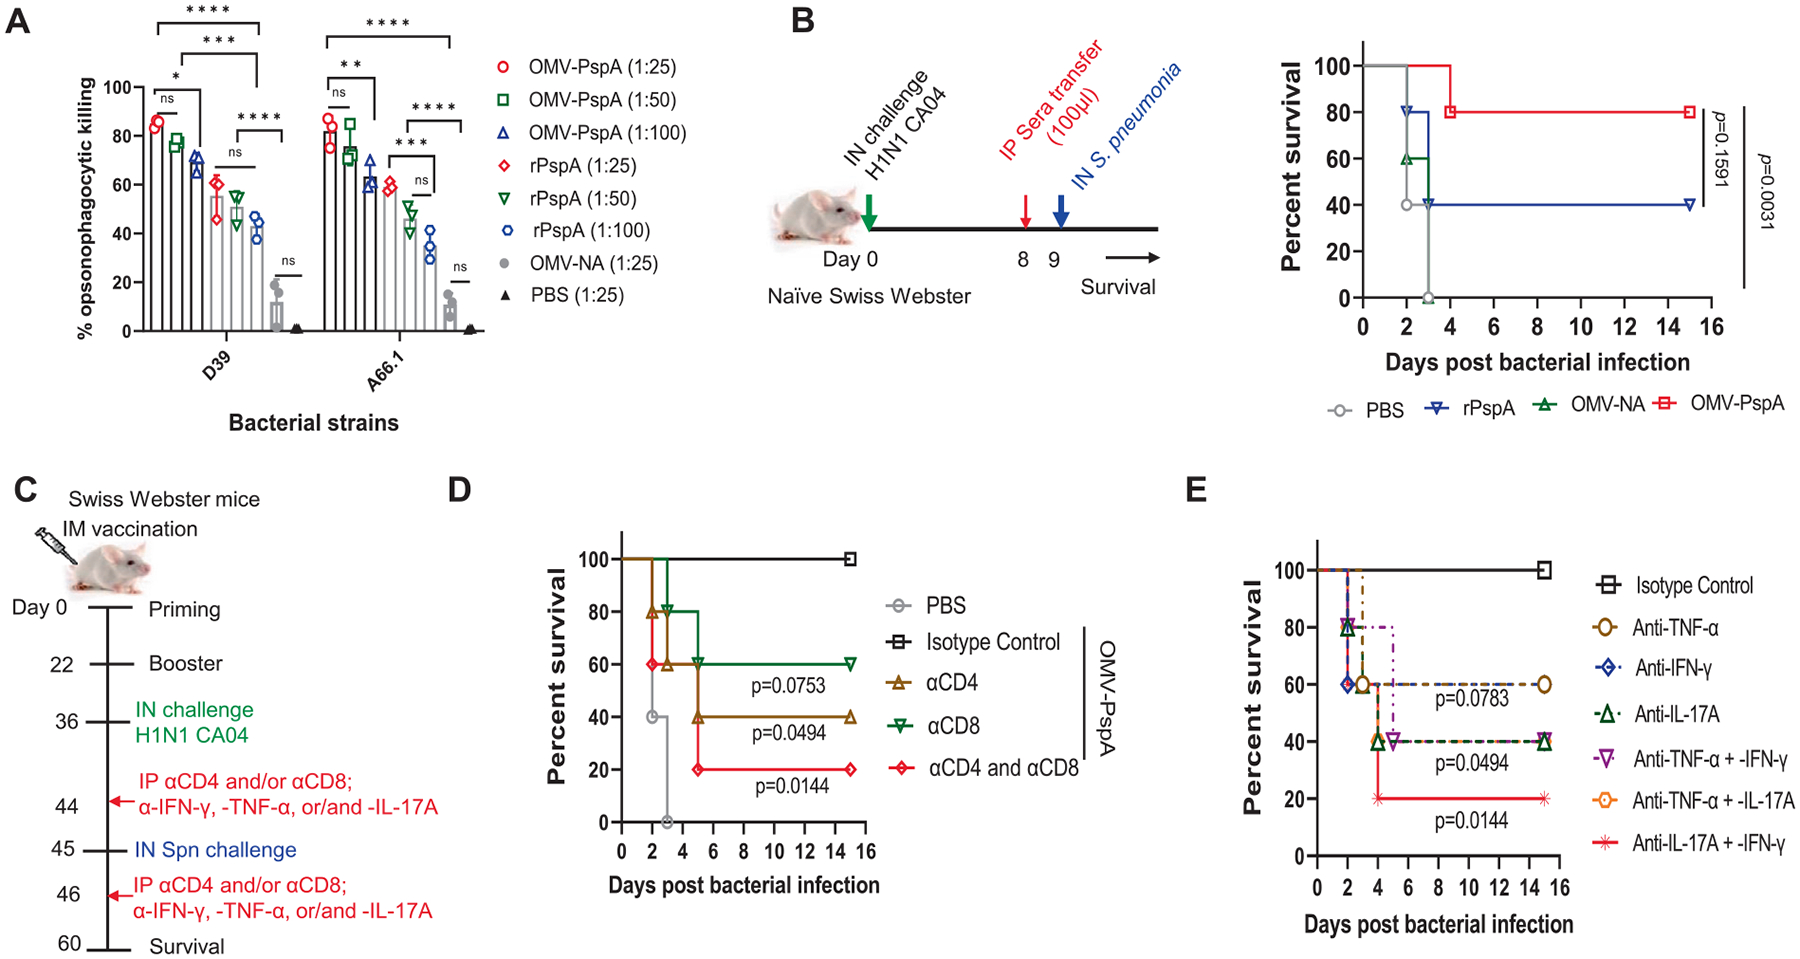
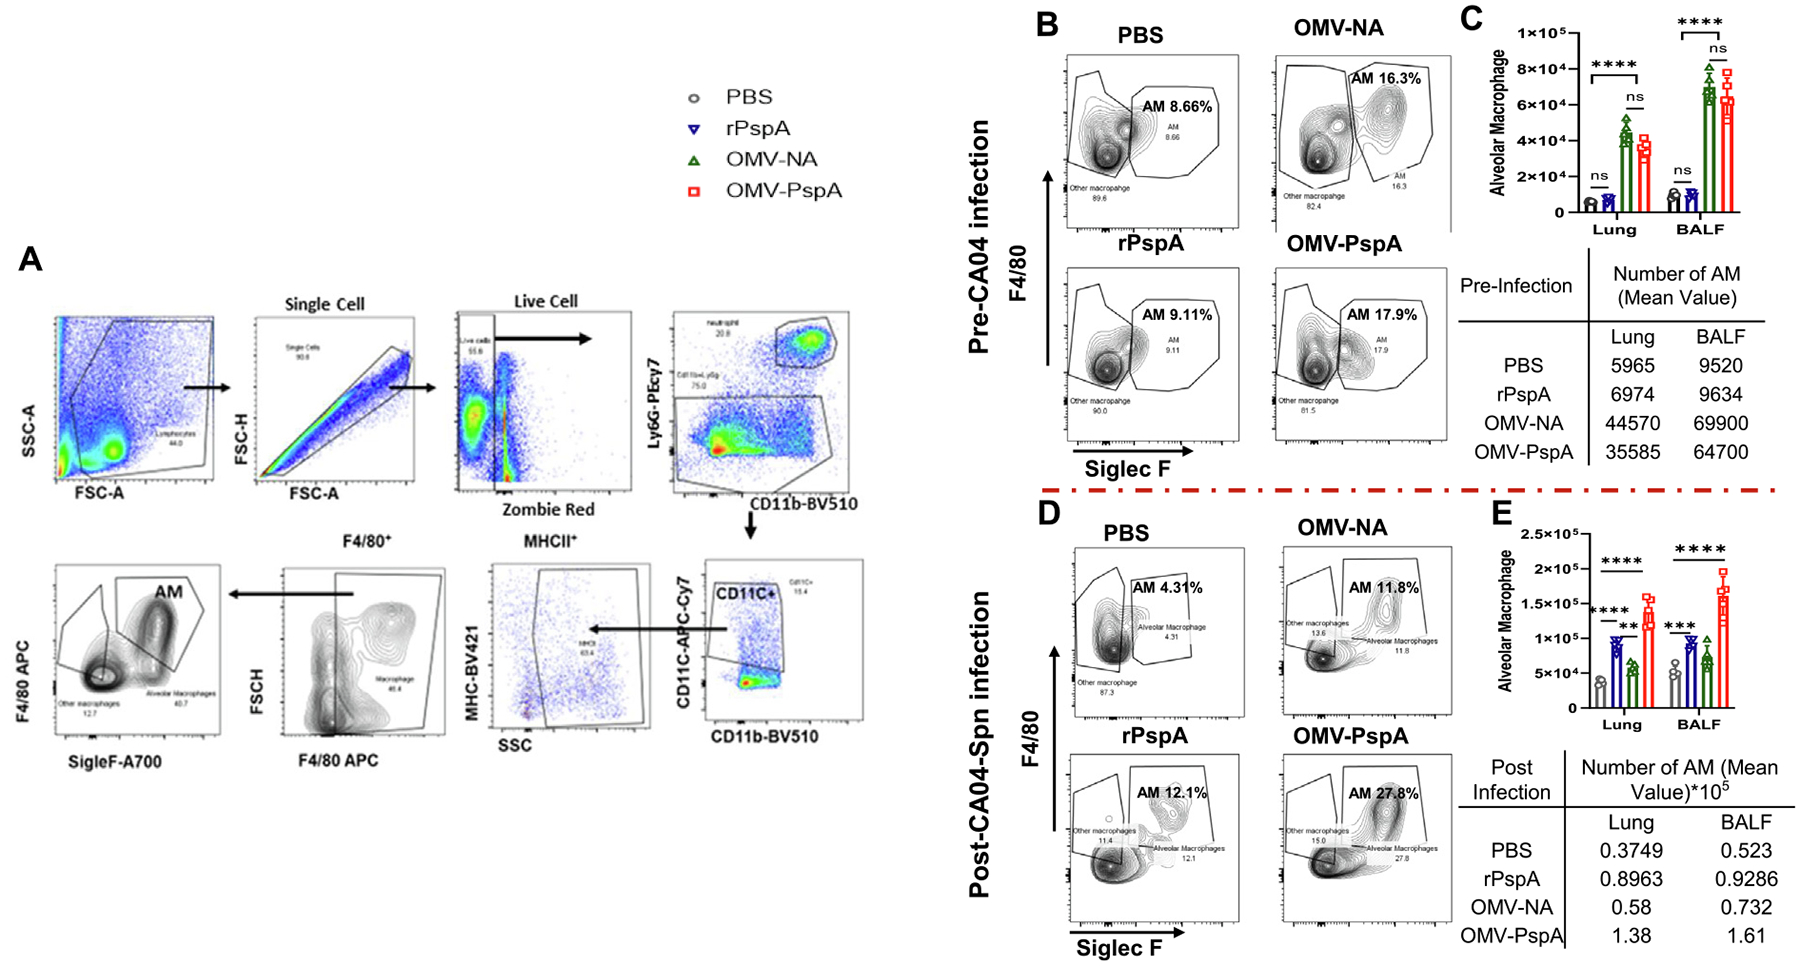
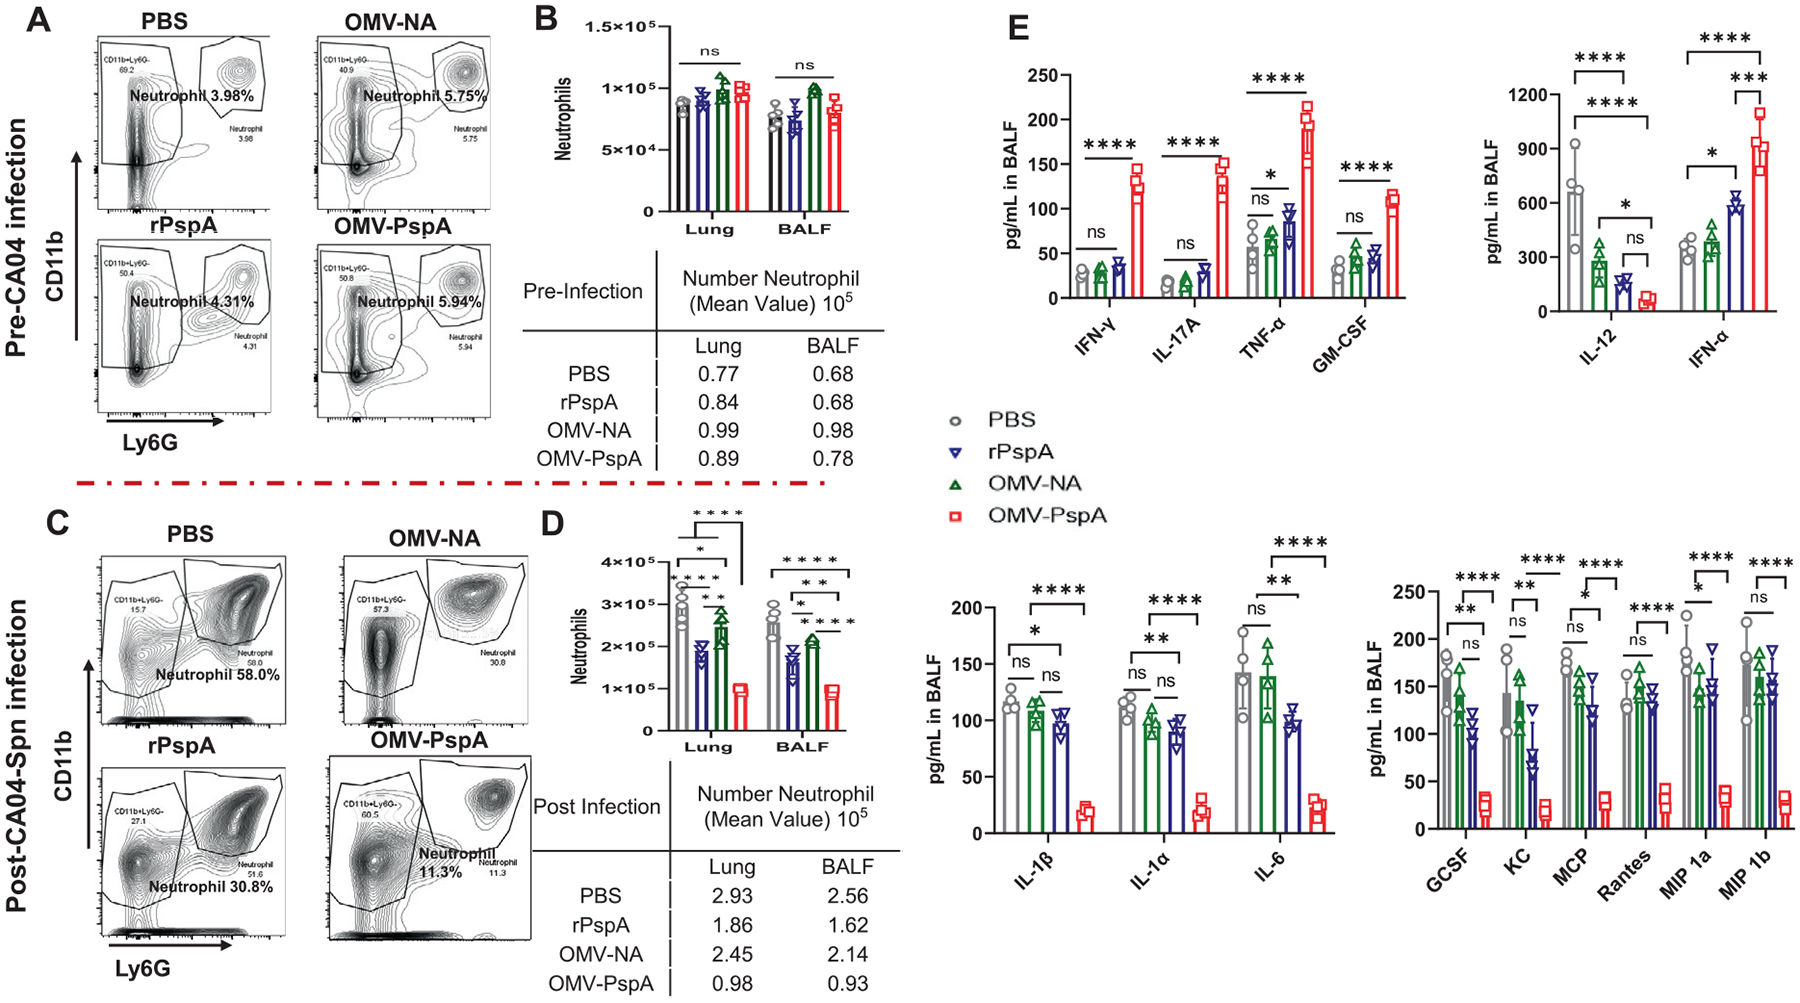
Streptococcus pneumoniae (Spn) is a common pathogen causing a secondary bacterial infection following influenza, which leads to severe morbidity and mortality during seasonal and pandemic influenza. Therefore, there is an urgent need to develop bacterial vaccines that prevent severe post-influenza bacterial pneumonia. Here, an improved Yersinia pseudotuberculosis strain (designated as YptbS46) possessing an Asd+ plasmid pSMV92 could synthesize high amounts of the Spn pneumococcal surface protein A (PspA) antigen and monophosphoryl lipid A as an adjuvant. The recombinant strain produced outer membrane vesicles (OMVs) enclosing a high amount of PspA protein (designated as OMV-PspA). A prime-boost intramuscular immunization with OMV-PspA induced both memory adaptive and innate immune responses in vaccinated mice, reduced the viral and bacterial burden, and provided complete protection against influenza-mediated secondary Spn infection. Also, the OMV-PspA immunization afforded significant cross-protection against the secondary Spn A66.1 infection and long-term protection against the secondary Spn D39 challenge. Our study implies that an OMV vaccine delivering Spn antigens can be a new promising pneumococcal vaccine candidate.


Conflict of interest statement

DECLARATIONS OF COMPETING INTEREST

The authors have no competing interests to declare.

Figures

Fig. 1
Fig. 1
Construction and analysis of OMVs containing PspA. (A) Construction of pSMV92 plasmid, in which the codon-optimized α-helical region of pspA (3–285 aa) was cloned into pYA4515 plasmid. (B) The analysis of PspA antigen by immunoblotting. The PspA synthesis in the YptbS46 harboring pYA4515, an empty Asd+ plasmid, YptbS46 harboring pSMV92, containing α-helical region of pspA (left panel); the PspA antigen in 8 μg of OMVs isolated from YptbS46(pSMV92) (designated as OMV-PspA), YptbS46(pYA4515) (designated as OMV-NA), 2 μg of purified recombinant PspA were used as a positive control (right panel). M, 10 to 250 kDa protein ladder (ThermoFisher Scientific). (C) Transmission electron microscope (TEM) image (left panel) of OMV-PspA and Dynamic Light Scattering (DLS) (left panel) of OMV-PspA. (D) Comparison of embryonic alkaline phosphate (SEAP) activities in HEK-blue cells with or without human toll-like receptors (TLRs) (Invitrogen). HEK-blue hTLR4 and hTLR2/6 cells were co-cultured with 30 μg/mL of OMV-PspA for 8 hours, respectively. OMVs from the YptbS44 strain and rPspA were used as controls. Results are representative of at least two independent experiments. Data are shown as the mean ± SD. The statistical significance of difference among groups was analyzed by two-way analysis of variance with Tukeys post hoc test: ns, no significance; **** p < 0.0001.
Fig. 2
Fig. 2
Immune responses induced by i.m. OMV immunization. Swiss Webster mice (n = 10/group, equal males and females, 7 weeks old) were immunized i.m. with 30 μg of OMV-PspA, OMV-NA, 3μg of rPspA/Alhydrogel, or Alhydrogel alone in 50 μL of PBS and boosted on day 22 after priming. (A) Immunization schema for mouse study. (B) Weight change rates of mice after immunization. (C) Total serum IgG titers to PspA in Swiss Webster mice on 21 and 35 days post-vaccination (DPV). (D) The ratio of IgG2a/IgG1 and IgG2b/IgG1 for antibodies specific to PspA antigen on 21 and 35 DPV. (E) Anti-PspA IgG titers in the BALFs of mice immunized with OMV-PspA, OMV-NA, rPspA, or PBS. (F) Lung PspA-specific T-cell responses in immunized mice. On 45 DPV, total CD4+ and CD8+ T-cell subsets and their specific cytokine (IFN-γ, TNF-α, and IL-17A) were stimulated by rPspA antigen. Each symbol was obtained from an individual mouse, and data were represented as the mean ± SD. The statistical significance of difference among groups was analyzed by two-way analysis of variance with Tukeys post hoc test: ns, no significance; * p < 0.05; ** p < 0.01; *** p < 0.001; **** p < 0.0001.
Fig. 3
Fig. 3
Immunized mice were challenged with a sublethal dose of an influenza virus. Swiss Webster mice (n = 10/group, equal males and females, 7 weeks old) were i.m. immunized with OMV-PspA, OMV-NA, rPspA, or PBS as described above. On 36 PDV, animals were challenged intranasally with 50 pfu of H1N1 (CA04) strain. (A) The schema for this study. (B) Weight change rates of immunized mice after CA04 infection. Virus titers in the BALF (C) and lung (D) of mice at 2, 4, and 8 DPVI were quantified using plaque assay described in Materials and Methods. (E) Lung histopathological analysis of representative mice from each group on 4 DPVI. The lungs were microscopically examined and imaged using Nanozoomer 2.0 RS Hamamatsu slide scanner (scale bar, 100 nm). Lung damage was assessed using a histology scoring system as described in the Material and Method. Each symbol was obtained from an individual mouse, and data were represented as the mean ± SD. The statistical significance of difference among groups was analyzed by two-way analysis of variance with Tukeys post hoc test: ns, no significance; * p < 0.05; ** p < 0.01; *** p < 0.001; **** p < 0.0001.
Fig. 4
Fig. 4
Short-term and long-term protective efficacy of OMV-PspA immunization against influenza-mediated secondary Spn infection. Swiss Webster mice (n = 10/group, equal numbers of males and females, 7 weeks old) were immunized intramuscularly with OMV-PspA, OMV-NA, rPspA/Alhydrogel, or PBS/Alhydrogel alone (negative control) and then boosted on day 22 after the priming immunization as described above. On 36 PDV, animals were challenged intranasally with 50 pfu of H1N1 (CA04) strain and monitored for 9 days. (A) On 9 DPVI, animals were intranasally challenged with 1.5 × 10⁴ CFU of Spn strain D39. (B) The bacterial burden was evaluated in the lungs, blood, and spleen of mice (n = 4/group) at 2 DPSI. (C) Lung histopathological analysis of representative mice from each group on 2 days post Spn infection (DPSI). The lungs were microscopically examined and imaged using Nanozoomer 2.0 RS Hamamatsu slide scanner (scale bar, 100 nm). Lung damage was assessed using a histology scoring system as described in the Material and Method. (D) On 9 DPVI, animals were intranasally challenged with 1 × 10³ CFU of Spn strain A66.1. (E) The schema used for long-term study. Groups of Swiss Webster mice (n = 5–10 females, 7 weeks old) were i.m. immunized with OMV-PspA, OMV-NA, rPspA, or PBS. Bloods were collected at 60, 90, 120, 150, and 180 DPV for measuring serum anti-PspA IgG titers. (F) Weight change rates of immunized mice after CA04 infection. On 196 PDV, animals were challenged intranasally with 50 pfu of H1N1 (CA04) strain. (G) Long-term protection against secondary Spn infection. On 9 DPVI (205 DPV), animals were intranasally challenged with 1.5 × 10⁴ CFU of Spn strain D39. The mortality and morbidity of animals were all monitored for 15 days. Statistical significance was analyzed by the log-rank (Mantel-Cox) test for survival analysis. Data were analyzed and presented as the mean ± SD. The statistical significance of difference among groups was analyzed by two-way analysis of variance with Tukeys post hoc test: ns, no significance; *, p < 0.05; **, p < 0.01; ****, p < 0.0001.
Fig. 5
Fig. 5
The roles of antibodies and T cells in protection against influenza-mediated secondary Spn infection. (A) Comparative analysis of opsonophagocytic killing assay against Spn strains D39 and A66.1 using antisera collected from immunized mice on 35 DPV. Data are representative of at least two independent experiments and presented as the mean ± SD. (B) Serum transfer. (Left) a schema for serum transfer and (right) survival of naïve Swiss Webster mice (n = 5/group, females, 7-weeks old), which were received corresponding sera and subjected to the co-infection. Naïve mice were intraperitoneally (i.p.) injected with 100 μL of serum collected from PBS-, rPspA-, OMV-NA-, and OMV-PspA-immunized mice on 35 DPV, respectively. Twenty-four hours postinjection, the recipient mice were intranasally challenged with 50 pfu of H1N1 (CA04) and then challenged with 1.5 × 10⁴ CFU of Spn strain D39 on 9 DPVI. (C) The schema of T-cell depletion and cytokine neutralization. OMV-PspA-immunized Swiss Webster mice (n = 5/group, females) were intranasally challenged with 50 pfu of H1N1 (CA04). On 8 DPVI, mice were i.p. administrated either with anti-CD4, anti-CD8, or anti-CD4 plus anti-CD8 mAbs (200μg/each mouse in 200 μL) at a twoday interval for the depletion of CD4+ and/or CD8+ T cells, or anti-TNF-α, anti-IFN-γ, and/or anti-IL-17A (200μg/each mouse in 200 μL) at a twoday interval for the neutralization of these cytokines. Mice were injected with the isotype control mAbs as controls. (D) Protection against secondary Spn infection in T-cell-depleted mice. (E) Protection against secondary Spn infection in cytokine-neutralized mice. On 8 days post CA04 infection, antibody-treated mice were then intranasally challenged with 1.5 × 10⁴ CFU of Spn strain D39. The mortality and morbidity of animals were all monitored for 15 days. Statistical significance was analyzed by the log-rank (Mantel-Cox) test for survival analysis. Data were analyzed and presented as the mean ± SD. The statistical significance of difference among groups was analyzed by two-way analysis of variance with Tukeys post hoc test: ns, no significance; *, p < 0.05; **, p < 0.01; ****, p < 0.0001.
Fig. 6
Fig. 6
Patterns of alveolar macrophages (AMs) in the BALF and lung of immunized mice with or without infection. Swiss Webster mice (n = 5 females) were immunized with OMV-PspA, OMV-NA, rPspA, or PBS as described above. Single cells were collected from the lung and BALF samples of these mice on 35 DPV before the CA04 challenge and on 2 DPSI and stained with fluorochrome-labeled molecular markers for characterizing AMs using flow cytometry. (A) Gating strategy for AMs and neutrophils. (B) Representative flow plot showing the percentage of AMs without infection. (C) Quantitative analysis of the number of AMs in the lung (per lung) and BALF (per mL) without infection. (D) Representative flow plot showing the percentage of AMs at 2 DPSI. (C) Quantitative analysis of the number of AMs in the lung (per lung) and BALF (per mL) at 2 DPSI. Data were analyzed and presented as the mean ± SD. The statistical significance of difference among groups was analyzed by two-way analysis of variance with Tukeys post hoc test: ns, no significance; *, p < 0.05; **, p < 0.01; ****, p < 0.0001.
Fig. 7
Fig. 7
Patterns of neutrophils in the BALF and lung of immunized mice with or without infection and cytokine profiles in the BALF of mice subjected to co-infection. Swiss Webster mice (n = 5 females) were immunized with OMV-PspA, OMV-NA, rPspA, or PBS as described above. Single cells were collected from the lung and BALF samples of these mice on 35 DPV before the CA04 challenge and on 2 days post Spn infection and stained with fluorochrome-labeled molecular markers for characterizing neutrophils using flow cytometry. (A) Representative flow plot showing the percentage of neutrophils without infection. (B) Quantitative analysis of the number of neutrophils in the lung (per lung) and BALF (per mL) without infection. (C) Representative flow plot showing the percentage of neutrophils at 2 DPSI. (D) Quantitative analysis of the number of neutrophils in the lung (per lung) and BALF (per mL) at 2 DPSI. (E) Cytokine profiles in the BALF of mice secondarily infected Spn. Cytokines/chemokines in the BALF samples were measured using the Bio-Plex Pro Mouse Cytokine 23-plex Assay kit (Bio-rad). Data were analyzed and presented as the mean ± SD. The statistical significance of difference among groups was analyzed by two-way analysis of variance with Tukeys post hoc test: ns, no significance; *, p < 0.05; **, p < 0.01; ****, p < 0.0001.

Similar articles

Cited by

References

    1. Centers for Disease Control and Prevention. Pneumococcal disease. Available at: https://www.cdc.gov/pneumococcal/index.html [Date accessed: 15 June 2019].
    1. Grousd JA, Rich HE & Alcorn JF Host-Pathogen interactions in Gram-positive bacterial pneumonia. Clin. Microbiol. Rev 32, e00107–e118 (2019). - PMC - PubMed
    1. Sun K & Metzger DW Inhibition of pulmonary antibacterial defense by interferon-gamma during recovery from influenza infection. Nat. Med 14, 558–564 (2008). - PubMed
    1. McCullers JA Insights into the interaction between influenza virus and pneumococcus. Clin. Microbiol. Rev 19, 571–582 (2006). - PMC - PubMed
    1. Morens DM, Taubenberger JK & Fauci AS Predominant role of bacterial pneumonia as a cause of death in pandemic influenza: implications for pandemic influenza preparedness. J. Infect. Dis 198, 962–970 (2008). - PMC - PubMed