. 2024 Jan 12;15(1):478.
doi: 10.1038/s41467-023-42762-w.

Single-cell multi-omic analysis of the vestibular schwannoma ecosystem uncovers a nerve injury-like state

Affiliations

Single-cell multi-omic analysis of the vestibular schwannoma ecosystem uncovers a nerve injury-like state

Thomas F Barrett et al. Nat Commun. .

Abstract

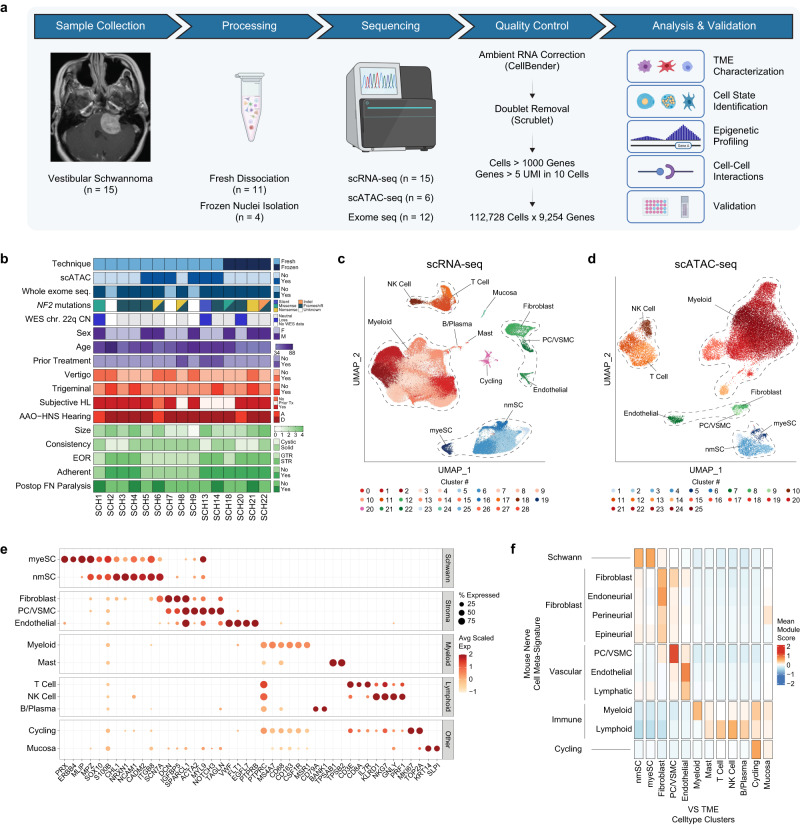
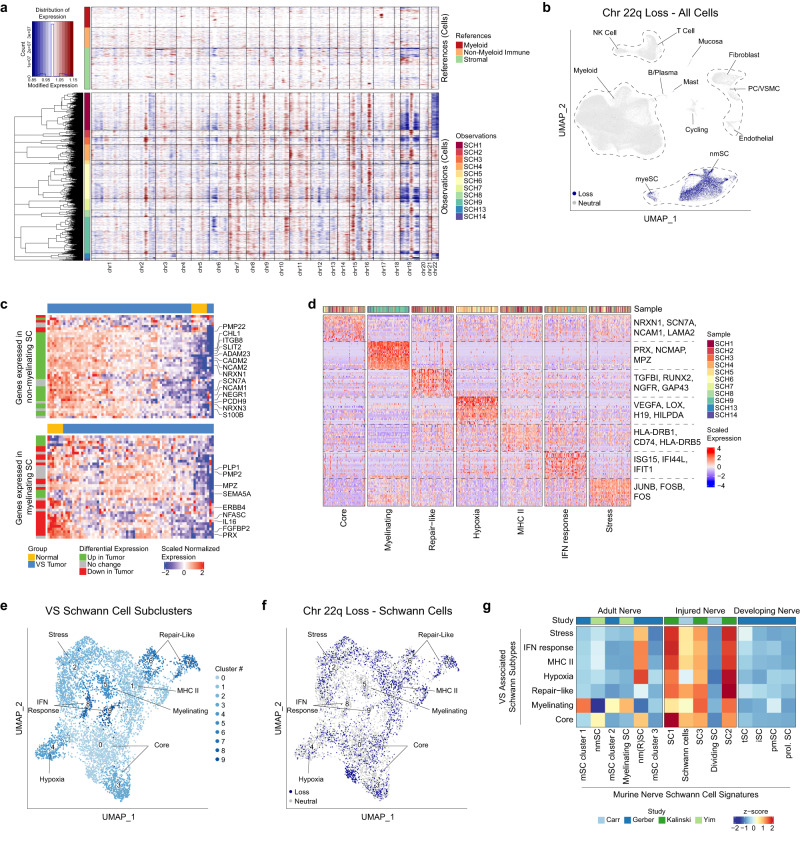
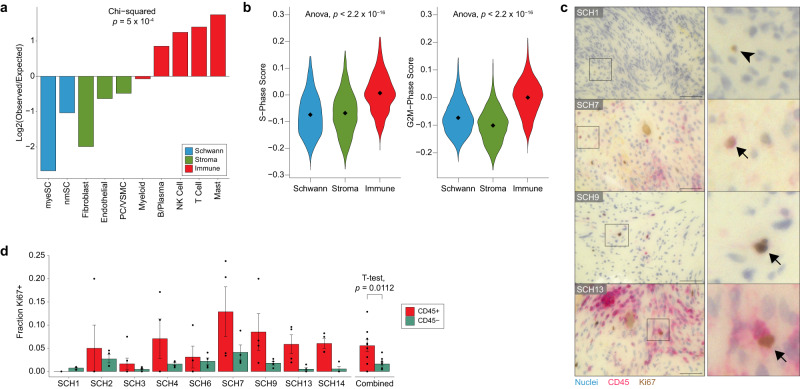
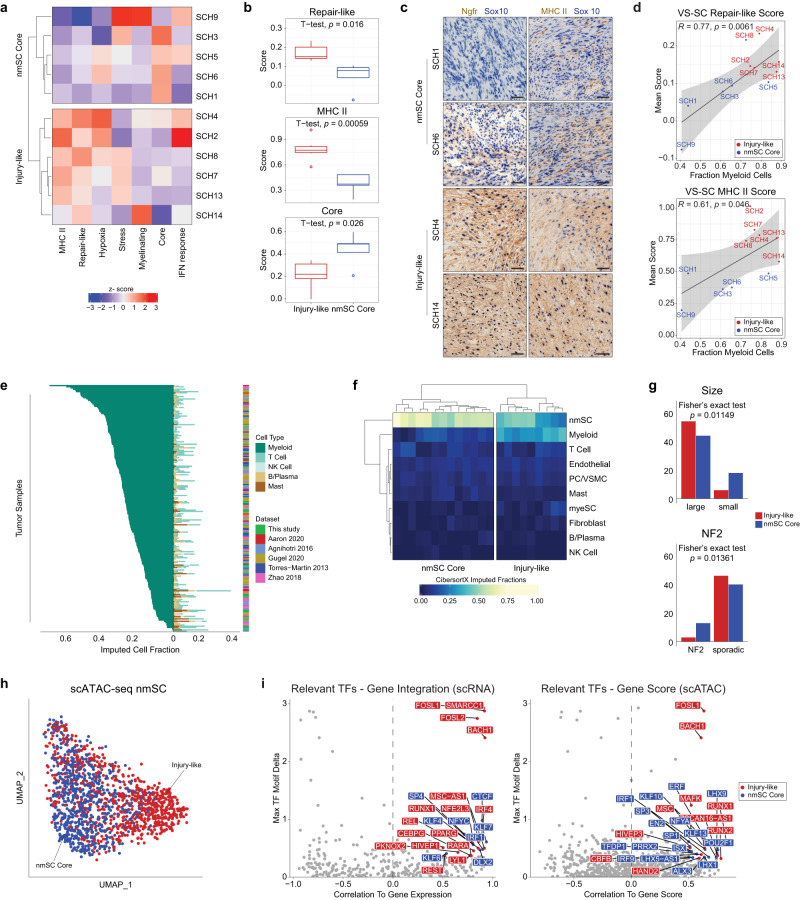
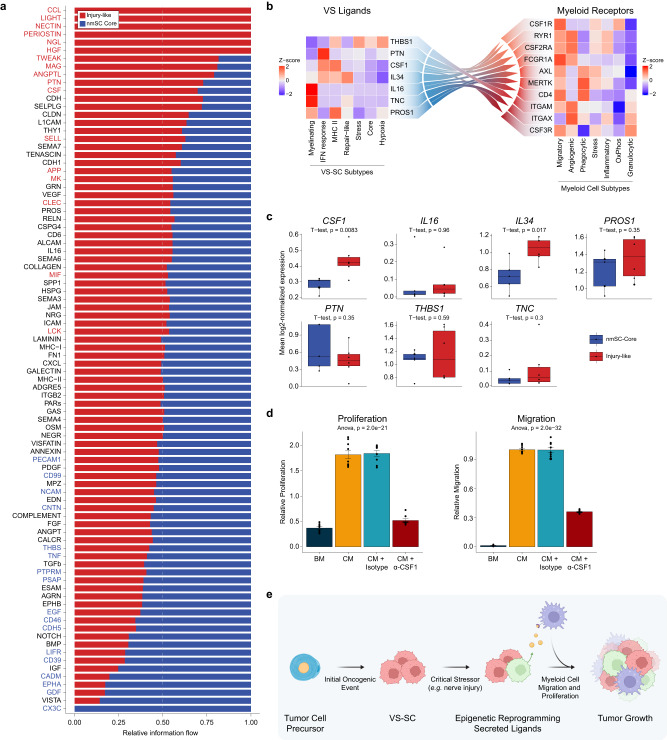
Vestibular schwannomas (VS) are benign tumors that lead to significant neurologic and otologic morbidity. How VS heterogeneity and the tumor microenvironment (TME) contribute to VS pathogenesis remains poorly understood. In this study, we perform scRNA-seq on 15 VS, with paired scATAC-seq (n = 6) and exome sequencing (n = 12). We identify diverse Schwann cell (SC), stromal, and immune populations in the VS TME and find that repair-like and MHC-II antigen-presenting SCs are associated with myeloid cell infiltrate, implicating a nerve injury-like process. Deconvolution analysis of RNA-expression data from 175 tumors reveals Injury-like tumors are associated with larger tumor size, and scATAC-seq identifies transcription factors associated with nerve repair SCs from Injury-like tumors. Ligand-receptor analysis and in vitro experiments suggest that Injury-like VS-SCs recruit myeloid cells via CSF1 signaling. Our study indicates that Injury-like SCs may cause tumor growth via myeloid cell recruitment and identifies molecular pathways that may be therapeutically targeted.


Conflict of interest statement

Regarding potential conflicts of interest, A.H.K. is a consultant for Monteris Medical and has received non-related research grants from Stryker and Collagen Matrix for study of a dural substitute. C.C.W. is a consultant for Stryker and Cochlear Ltd. C.A.B. is a consultant for Advanced Bionics, Cochlear, Envoy, and IotaMotion, and also has equity interest in Advanced Cochlear Diagnostics L.L.C. The remaining authors declare no competing interests.

Figures

Fig. 1
Fig. 1. scRNA-seq and scATAC-seq atlas of vestibular schwannoma (VS).
a Schematic of study design. b Clinical and molecular characteristics of tumors included in scRNA-seq and scATAC-seq datasets. Discrete values for patient characteristics are provided in Supplementary Table 1. See also Supplementary Fig. 1a for additional copy number alteration data derived from exome sequencing and Supplementary Table 2 for detailed annotation of NF2 mutations. WES, whole exome seq; CN, copy number; AAO-HNS Hearing, American Association of Otolaryngology Head and Neck hearing score; EOR, extent of resection; FN, facial nerve. Size, greatest axial dimension in cm. c UMAP plot of cell types identified in the VS TME via scRNA-seq analysis. NK, natural killer cells; VSMC, vascular smooth muscle cells; nmSC, non-myelinating Schwann cells; myeSC, myelinating Schwann cells. Colors correspond to clusters identified using Seurat. d UMAP plot of cell types identified in the VS TME via scATAC-seq. NK, natural killer cells; VSMC, vascular smooth muscle cells; nmSC, non-myelinating Schwann cells; myeSC, myelinating Schwann cells. Colors correspond to clusters identified using ArchR. e Dot plot of expression levels of selected marker genes (x-axis) for each VS cell subpopulation depicted in c (y-axis). f Heatmap of meta-signature scores from gene signatures of previously published mouse peripheral nerve studies (see also Supplementary Fig. 1b). Source data are provided as a Source Data file.
Fig. 2
Fig. 2. VS-SC have heterogeneous transcriptional profiles.
a InferCNV residual gene expression heatmap of VS-SC from freshly dissociated samples showing decreased expression of genes on chromosome 22q (chr22q), indicative of chr22q loss, in VS-SC from three tumors (SCH1, SCH2, SCH13). See also Supplementary Fig. 3a for a heatmap of VS-SC from frozen samples which were analyzed independently. Rows represent cells and columns represent genes arranged by chromosomal position. b UMAP demonstrating cells with inferred chr22q loss are only present in the nmSC and myeSC clusters. c Heatmaps comparing expression of top 50 differentially expressed genes (DEGs) in nmSC (top) and myeSC (bottom) to expression observed in microarray data of normal nerve and VS tumors from Gugel et al. (GSE141801). See also Supplementary Fig. 3b. d Heatmap of expression of DEGs from each SC meta-cluster. Two hundred randomly sampled cells from each meta-cluster are displayed. e UMAP representation of VS Schwann cells subset from the scRNA-seq data with meta-clusters labeled. See also Supplementary Fig. 3e for a similar UMAP representation of frozen sample VS-SC subclusters. f UMAP plot of scRNA-seq VS-SC highlighting cells with inferred chr22q loss. Cells with chr22q loss do not form a discrete cluster but instead cluster with cells without chr22q loss that share the same metaprogram. See also Supplementary Fig. 3e for a similar UMAP plot for frozen sample Schwann cells. g Heatmap depicting scoring of each VS-SC cluster using signatures from murine adult normal nerve, adult injured nerve and developing nerve scRNA-seq atlases. Source data are provided as a Source Data file.
Fig. 3
Fig. 3. Immune cells are disproportionately cycling in the VS TME.
a Cycling cells (Fig. 1c) were scored based on gene signatures of all other cell types in the VS TME (e.g., nmSC, T cells, etc.) and assigned to the cell type for which they scored highest. Frequencies of each cell type observed in this cluster were compared to expected rates. b Violin plots of G2M and S-phase scores for Schwann, stromal, and immune cells. c Double-stain IHC of representative high-power field (HPF) from VS tumor FFPE samples. Cycling cells are labeled Ki67 and immune cells are labeled with CD45. Arrowhead indicates a representative CD45-Ki67+ cell. Arrows indicate representative CD45 + Ki67+ cells (scale bar = 50 μm). d Barplot showing the fraction of CD45+ (red) and CD45- (green) cells that are Ki67+ within available samples (left) and averaged across all samples (right). Error bars on left show standard error for quantification of each group across 3–6 HPF. Error bars on the right represent standard error of mean measurements across samples (n = 9 samples). Two-sided t-test was used for comparison. Source data are provided as a Source Data file.
Fig. 4
Fig. 4. Injury-like VS tumors are associated with increased myeloid cell infiltrate.
a Heatmap displaying results of hierarchical clustering of VS-SC subtype mean signature scores shows two distinct groups of tumors (“Injury-like” and “nmSC Core”). b Box-and-whisker plot comparing mean scores of repair-like, MHC II, and Core signatures in Injury-like (n = 6) and nmSC Core (n = 5) tumors (groups defined in a.) Two-sided t-testing was performed with correction for multiple comparisons via BH method with FDR of 0.2. Center lines of the boxplots reflect the mean, upper and lower borders reflect the 75th and 25th percentiles, respectively, whiskers are the highest and lowest points at most 1.5 times the inter-quartile range from the hinge, and outliers are represented as dots. See the Source Data file for exact values. c Double-stain IHC images show VS classified as Injury-like have enriched staining for Ngfr (Repair-like SC) and MHC II (MHC II SC), while these markers are largely absent from tumors classified as nmSC Core. Sox10 (blue) labels tumor cells. DAB stains Ngfr (left column) and MHC II (right column). Scale bar = 100 μm. Four HPFs were evaluated from each available patient sample. d Scatterplots with Pearson linear regression demonstrate strong correlation of mean repair-like (left) and MHC II (right) scores with fraction of myeloid cells across samples. Error bands represent 95% confidence interval of the linear model. There was no correction for multiple comparisons. e Barplot of imputed cell-type fractions from 175 VS tumors shows high variability in degree of myeloid cell composition. Only fractions of immune cells are displayed. f Representative heatmap demonstrating classification of our cohort of 22 VS tumors into Injury-like and nmSC Core categories based on hierarchical clustering of imputed cell fractions. Remaining results shown in Supplementary Fig. 5b–f. g Bar plots showing number of tumor samples classified as Injury-like or nmSC Core and clinically classified by size (n = 122) and NF2-syndrome status (n = 89). Two-sided Fischer’s exact test used for comparison. h UMAP of all VS-SC from the scATAC-seq dataset with cells colored based on the type of VS, Injury-like (red) and nmSC Core (blue), from which they arose as determined by clustering in (A). i Scatter plot depicting transcription factor (TF) motif deviation delta between Injury-like and nmSC Core VS-SC and correlation to gene expression (left) and gene score based on accessibility (right). Relevant TFs (correlation > 0.5, adjusted p < 0.01 and max delta > 75th percentile of all max deltas) are labeled and colored. Source data are provided as a Source Data file.
Fig. 5
Fig. 5. Ligand-receptor interactions in the VS-TME distinguish Injury-like from nmSC Core tumors, and promote myeloid cell proliferation and migration.
a Bar plot showing the relative information flow of select signaling pathways. Pathway names in red are enriched in Injury-like VS and those in blue are enriched in Core VS. Information flow is defined as the sum of communication probability among all pairs of cell groups in each inferred network. See Supplementary Data 9. b Heatmap showing relative expression of VS-SC ligands (left) with receptors expressed on myeloid cells (right). c Box-and-whisker plots showing the mean log-normalized expression of candidate ligands in VS-SC from Fig. 5b. CSF1 expression is higher in Injury-like VS (two-sided t-test, multiple testing correction with Benjamini Hochberg Method and FDR of 20%. Inury-like (n = 6) and nmSC Core (n = 5) groups defined in (a). Center lines of the boxplots reflect the mean, upper and lower borders reflect the 75th and 25th percentiles, respectively, whiskers are the highest and lowest points at most 1.5 times the inter-quartile range from the hinge, and outliers are represented as dots. See the Source Data file for exact values. d Bar plots showing relative proliferation (left) and transwell migration (right) of CD14+ monocytes from healthy donors in Basal Media (BM), HSC Conditioned Media (CM), CM with isotype IgG control, and CM with anti-CSF1. Each bar represents the normalized mean of all technical replicates (n = 3 per assay) across biological replicates (n = 3) and error bars are SEM. e Model of Injury-like VS. VS-SC undergo a critical stressor that triggers subpopulations to adopt repair-like and antigen presenting states. Myeloid cells are recruited to the VS TME and proliferate locally, leading to tumor progression. Source data are provided as a Source Data file.

References

    1. Carlson ML, Link MJ. Vestibular Schwannomas. N. Engl. J. Med. 2021;384:1335–1348. doi: 10.1056/NEJMra2020394. - DOI - PubMed
    1. Plotkin SR, et al. Updated diagnostic criteria and nomenclature for neurofibromatosis type 2 and schwannomatosis: An international consensus recommendation. Genet. Med. 2022;24:1967–1977. doi: 10.1016/j.gim.2022.05.007. - DOI - PubMed
    1. Starnoni D, et al. Systematic review and meta-analysis of the technique of subtotal resection and stereotactic radiosurgery for large vestibular schwannomas: a “nerve-centered” approach. Neurosurg. Focus. 2018;44:E4. doi: 10.3171/2017.12.FOCUS17669. - DOI - PubMed
    1. Yang I, et al. A comprehensive analysis of hearing preservation after radiosurgery for vestibular schwannoma: Clinical article. JNS. 2010;112:851–859. doi: 10.3171/2009.8.JNS0985. - DOI - PubMed
    1. Coughlin AR, Willman TJ, Gubbels SP. Systematic Review of Hearing Preservation After Radiotherapy for Vestibular Schwannoma. Otol. Neurotol. 2018;39:273–283. doi: 10.1097/MAO.0000000000001672. - DOI - PMC - PubMed