. 2024 Jan 12;15(1):40.
doi: 10.1038/s41419-023-06417-4.

The E3 ubiquitin ligase Itch regulates death receptor and cholesterol trafficking to affect TRAIL-mediated apoptosis

Affiliations

The E3 ubiquitin ligase Itch regulates death receptor and cholesterol trafficking to affect TRAIL-mediated apoptosis

James Holloway et al. Cell Death Dis. .

Abstract

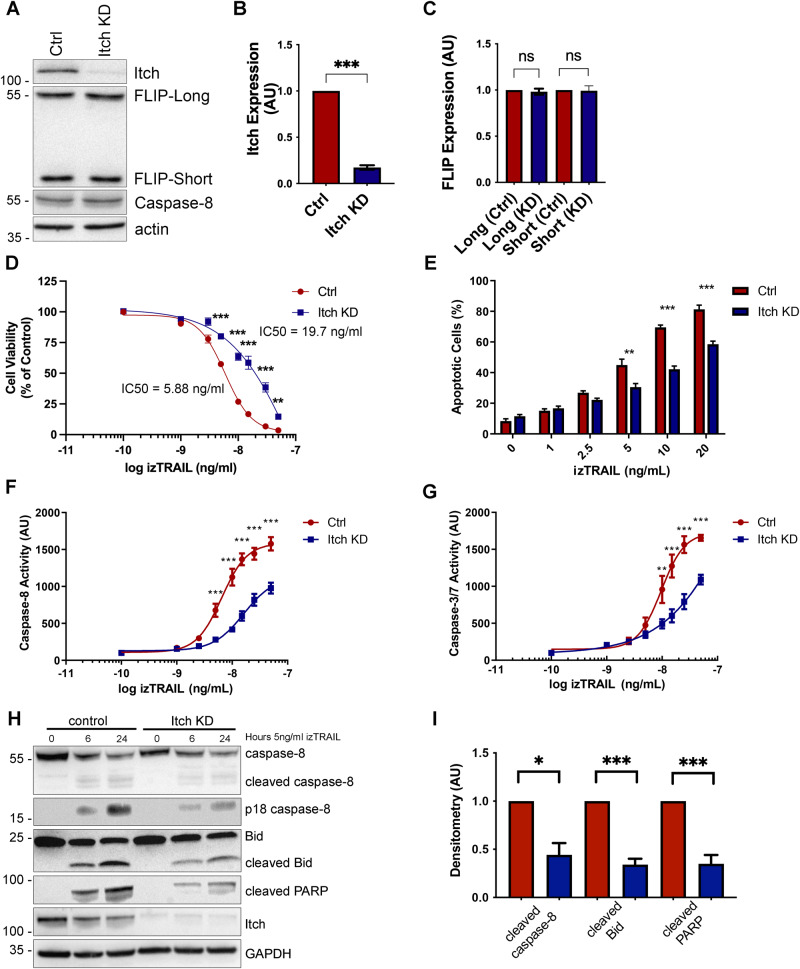
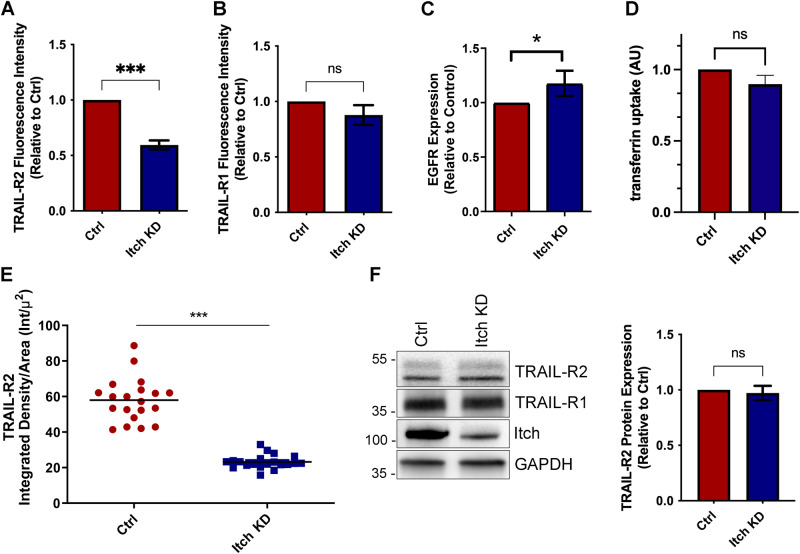
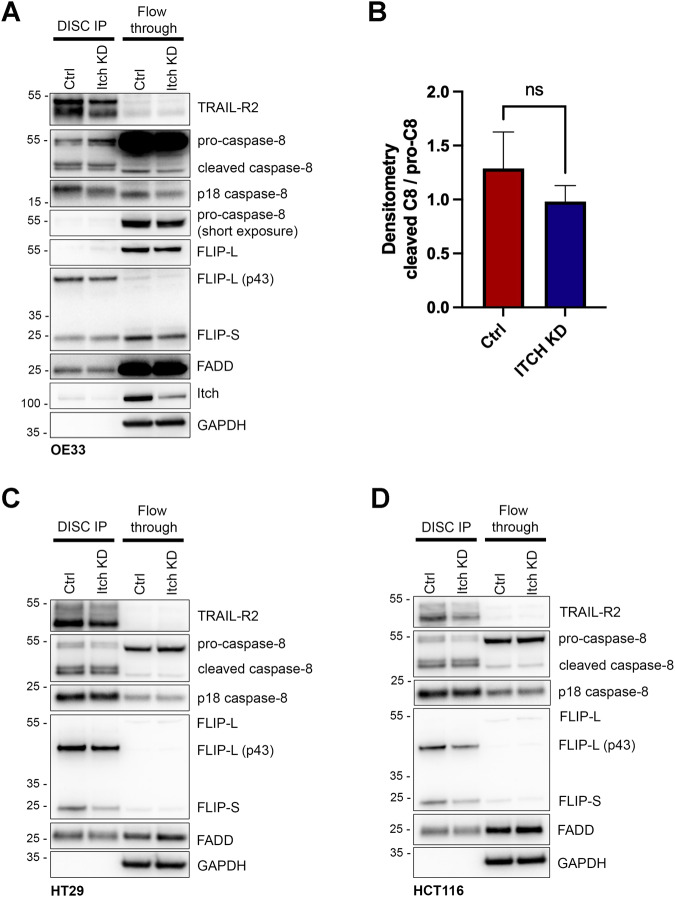
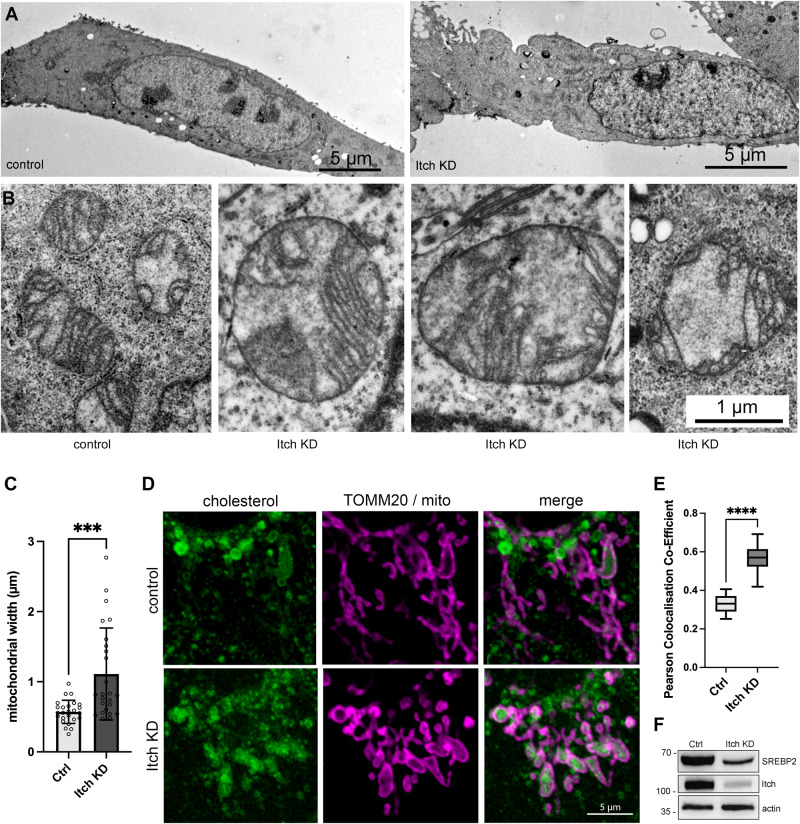
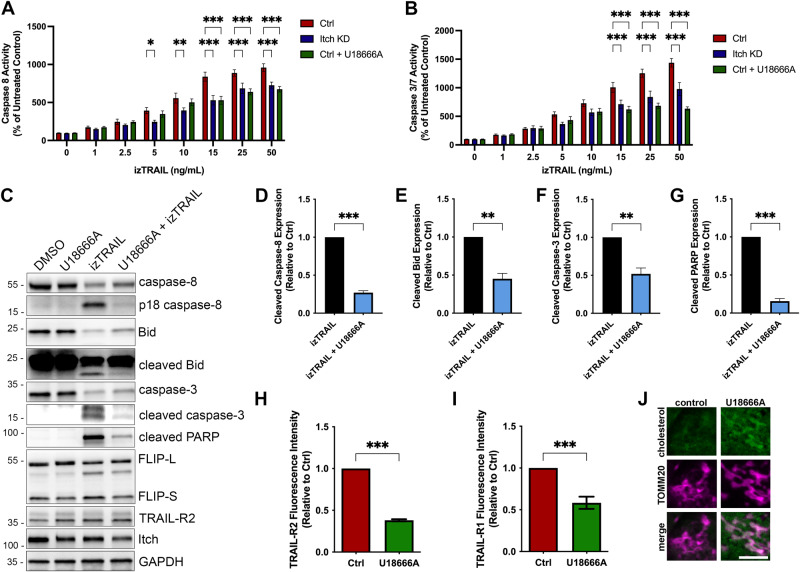
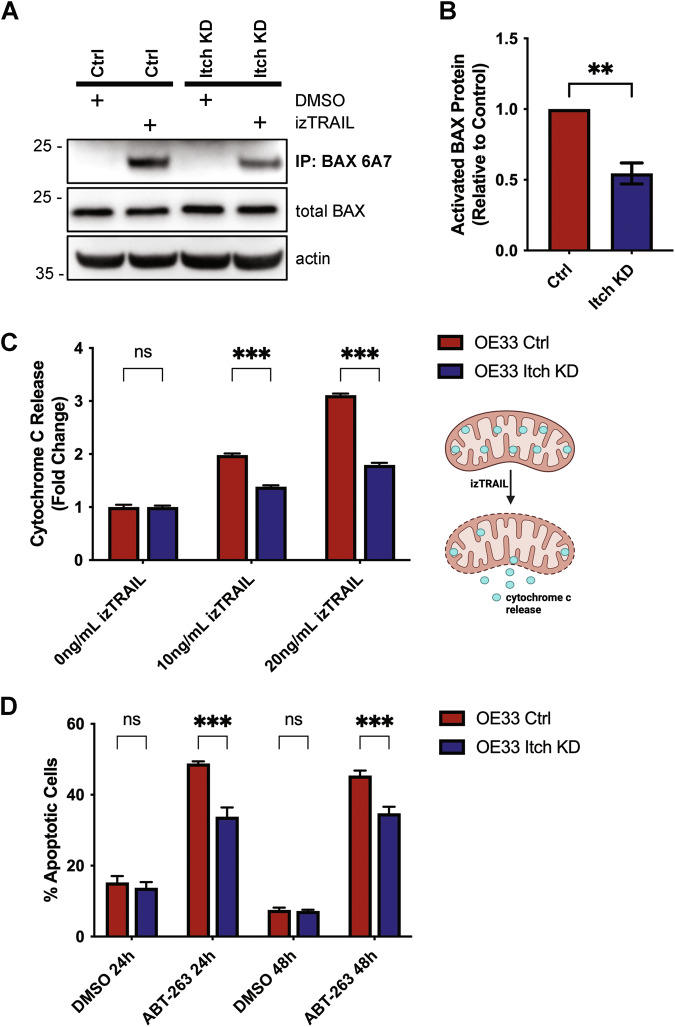
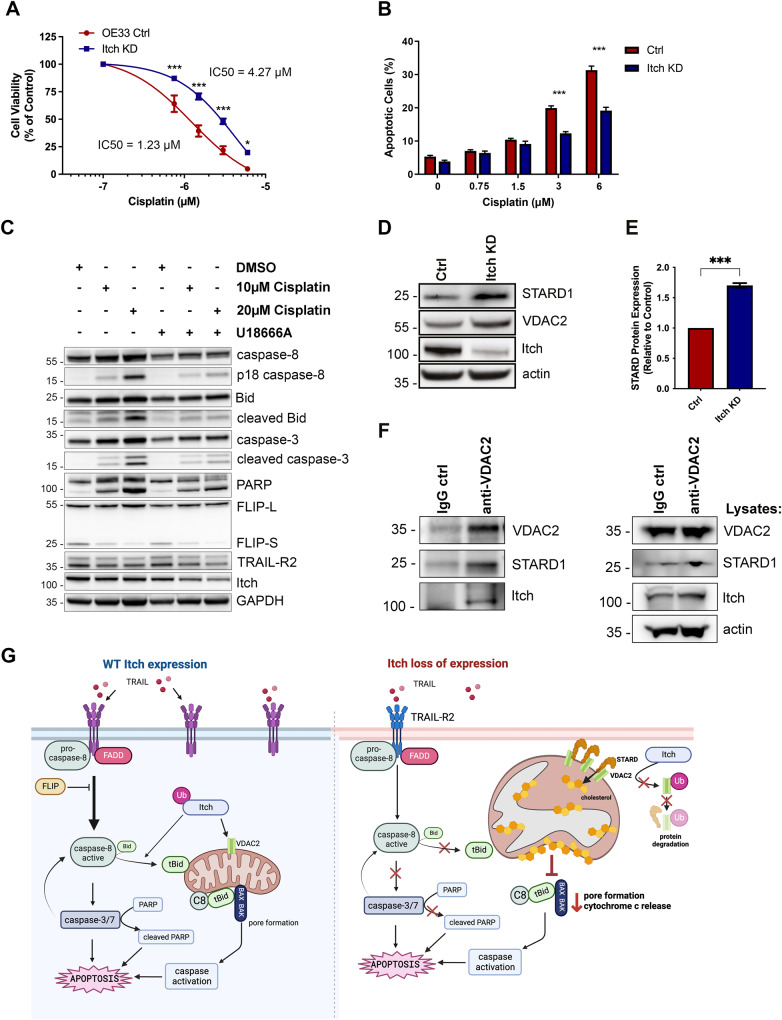
The activation of apoptosis signalling by TRAIL (TNF-related apoptosis-inducing ligand) through receptor binding is a fundamental mechanism of cell death induction and is often perturbed in cancer cells to enhance their cell survival and treatment resistance. Ubiquitination plays an important role in the regulation of TRAIL-mediated apoptosis, and here we investigate the role of the E3 ubiquitin ligase Itch in TRAIL-mediated apoptosis in oesophageal cancer cells. Knockdown of Itch expression results in resistance to TRAIL-induced apoptosis, caspase-8 activation, Bid cleavage and also promotes cisplatin resistance. Whilst the assembly of the death-inducing signalling complex (DISC) at the plasma membrane is not perturbed relative to the control, TRAIL-R2 is mis-localised in the Itch-knockdown cells. Further, we observe significant changes to mitochondrial morphology alongside an increased cholesterol content. Mitochondrial cholesterol is recognised as an important anti-apoptotic agent in cancer. Cells treated with a drug that increases mitochondrial cholesterol levels, U18666A, shows a protection from TRAIL-induced apoptosis, reduced caspase-8 activation, Bid cleavage and cisplatin resistance. We demonstrate that Itch knockdown cells are less sensitive to a Bcl-2 inhibitor, show impaired activation of Bax, cytochrome c release and an enhanced stability of the cholesterol transfer protein STARD1. We identify a novel protein complex composed of Itch, the mitochondrial protein VDAC2 and STARD1. We propose a mechanism where Itch regulates the stability of STARD1. An increase in STARD1 expression enhances cholesterol import to mitochondria, which inhibits Bax activation and cytochrome c release. Many cancer types display high mitochondrial cholesterol levels, and oesophageal adenocarcinoma tumours show a correlation between chemotherapy resistance and STARD1 expression which is supported by our findings. This establishes an important role for Itch in regulation of extrinsic and intrinsic apoptosis, mitochondrial cholesterol levels and provides insight to mechanisms that contribute to TRAIL, Bcl-2 inhibitor and cisplatin resistance in cancer cells.


Conflict of interest statement

The authors declare no competing interests.

Figures

Fig. 1
Fig. 1. Itch knockdown increases resistance to TRAIL-mediated apoptosis in OE33 cells and impairs caspase-8 cleavage and activity.
A Western blot analysis of basal expression of FLIP(L), FLIP(S), FADD, Procaspase-8, TRAIL-R1, TRAIL-R2 in OE33 Ctrl (shCTRL) and Itch knockdown (KD) cells stably expressing shRNA targeting ITCH. B Bar graph showing the densitometry of Western blot analysis of Itch expression normalised to the actin loading control in five independent experiments. C Bar graph showing the quantification for FLIP-Long and -Short expression in control shRNA and Itch knockdown (KD) cell lines. N = 5 independent experiments. D OE33 Ctrl and Itch KD cell lines were subjected to treatment with increasing doses of izTRAIL for 24 h (0–50 ng/mL). Cell viability was measured using the CellTiterGlo Assay. Data was normalised to an untreated control. E OE33 Ctrl and Itch KD cells were treated with 0–20 ng/mL TRAIL for 24 h and then stained with FITC-conjugated Annexin V and propidium iodide to assess the number of apoptotic cells under each treatment condition. Bar graph showing the percentage of apoptotic cells (Annexin V-positive cells) of the population. F Caspase -8 and (G) Caspase -3/-7 activity in OE33 Ctrl and Itch KD cell lines was measured following treatment with increasing concentrations of izTRAIL (0–50 ng/mL). Activity was measured 6 h post treatment using the Caspase -3/-7 or the Caspase -8 Glo assays. H Western blot analysis of cleaved Caspase-8, Bid and PARP in OE33 Ctrl and Itch KD cell lines following treatment for 6 or 24 h with 5 ng/ml izTRAIL. I Densitometry of the experiment in (C) in four independent repeats. Error bars represent the standard error of the mean. Statistical significance was measured by Student’s t test. *p < 0.05, **p < 0.01, ***p < 0.001.
Fig. 2
Fig. 2. Itch knockdown cells show reduced surface expression of TRAIL-R2 in OE33 cells.
FACS analysis of cell surface expression of (A) TRAIL-R2 and (B) TRAIL-R1 cell surface expression in OE33 Ctrl and Itch KD cell lines. Bar graphs showing the mean fluorescence intensity of cell surface staining of TRAIL-R2 in OE33 control and Itch KD cells in three independent experiments (n = 10,000 cells per experiment). C FACS analysis of cell surface expression of EGFR in serum starved cells normalised to the control cell line in three independent experiments. D FACS analysis of fluorescent transferrin uptake in serum starved cells. Three independent experiments were performed where 10,000 cells were analysed per experiment. E TRAIL-R2 cell surface expression was measured using confocal microscopy. Alexa488-tagged wheat germ agglutinin stain was used to identify the plasma membrane and anti-DR5 antibody stain was used to determine the intensity of TRAIL-R2 at the plasma membrane. Receptor expression is expressed as the Integrated Density of the stain at the plasma membrane divided by the area. N = 20. F Western blot showing the total expression levels of TRAIL-R2 and -R1 in control and Itch KD OE33 cells. Error bars represent the standard error of the mean. Statistical significance was calculated by Student’s t test; ns, not significant, *p < 0.05, ***p < 0.001.
Fig. 3
Fig. 3. Itch is found at the death-inducing signalling complex (DISC) but does not regulate its composition or cleavage of caspase-8.
A Immunoprecipitation of the DISC using an activating TRAIL-R2 antibody from OE33 cells with a stable Itch knockdown (KD) or a control. Cells were treated for 1 h to induce formation of the DISC. Proteins were separated by size on a SDS-PAGE gel prior to Western blot analysis. B Densitometry of cleaved caspase-8 normalised to the pro-caspase-8 in the DISC IP from OE33 cells from three independent experiments. C Immunoprecipitation of the DISC in HT29 cells treated with control or ITCH siRNA using the TRAIL-R2 antibody. D Immunoprecipitation of the DISC in HCT116 cells treated with control or ITCH siRNA using the TRAIL-R2 antibody. Statistical significance was measured by Student’s t test, ns represents a non-significant difference.
Fig. 4
Fig. 4. Itch knockdown leads to an accumulation of mitochondrial cholesterol.
A Transmission electron micrographs illustrating the morphology of control and Itch KD cells. Scale bars, 5 µm. B Electron micrographs illustrating the morphology and size of mitochondria in control and Itch KD cells. Scale bar, 1 µm for all images. C Quantification of mitochondrial width from 25 cells. Mean ± SD. D Confocal images illustrating the accumulation of free cholesterol by Filipin-III staining together with outer mitochondrial membrane marker TOM20. Scale bar, 5 µm. E Tukey box plot displaying the Pearson colocalization co-efficient of TOM20 and Filipin staining to compare levels of mitochondrial cholesterol in control and Itch KD cell lines. N = 14 per group. F Western blot analysis of cell lysates showing the expression of nuclear SREBP2 (cleaved) protein in the Itch KD compared to control. Statistical significance was measured by Student’s t test. ***p < 0.001, ****p < 0.0001.
Fig. 5
Fig. 5. Cholesterol homoeostasis is an important resistance mechanism for TRAIL-induced apoptosis.
A Caspase-8 activity and (B) Caspase-3/-7 activity was measured following treatment with increasing concentrations of izTRAIL (0–50 ng/mL). Activity was measured 6 h post treatment using the Caspase-3/-7 or the Caspase-8 Glo assays. Cells were treated with U18666A (1 ng/ml) for 24 h. C Western blot analysis of cell lysates after treatment with U18666A and izTRAIL for key apoptotic proteins; caspase-8, -3, Bid and PARP. D–G Quantification of an inhibition of apoptosis in OE33 cells treated with U18666A (1 ng/ml) in combination with izTRAIL, showing a significant loss of cleavage of caspase-8, -3, Bid, and PARP in three independent experiments. H Bar graph showing the mean fluorescence of cell surface expression of TRAIL-R2 stained control and cells treated with U18666A in three independent experiments. I Bar graph showing the mean fluorescence intensity of cell surface expression of TRAIL-R1 in control and U18666A-treated (1 ng/ml) OE33 cells in three independent experiments (n = 10,000 cells per experiment). J Fluorescence images of OE33 cells showing the accumulation of cholesterol, stained with Filipin-III, in mitochondria after U18666A treatment. Scale bar, 5 µm. Statistical significance was measured by Student’s t test. *p < 0.05, **p < 0.01, ***p < 0.001.
Fig. 6
Fig. 6. Itch regulates intrinsic apoptosis, Bax activation and cytochrome release.
A Western blot analysis of an immunoprecipitation experiment using the Bax 6A7 antibody that specifically recognises the activated form of the protein. Total Bax and actin from the OE33 detergent extracts are shown below. Cells were treated with 50 ng/ml izTRAIL for 6 h. B Quantification of three independent experiments shown in (A). Statistical analysis was performed using Student’s t test. **p < 0.01. C Flow analysis of cytochrome c release from OE33 control and Itch KD cell lines following stimulation with 10–20 ng/ml izTRAIL for 6 h. In total, 10,000 cells per sample were analysed in three independent experiments. Statistical analysis was performed using 2-way ANOVA. ***p < 0.001. D The percentage apoptotic cells were assessed post-treatment with 5 µM Navitoclax (ABT-263) at the indicated time points. Statistical analysis was performed using 2-way ANOVA. ***p < 0.001.
Fig. 7
Fig. 7. Cisplatin-mediated apoptosis is regulated by Itch expression and mitochondrial cholesterol.
A Cell viability assay of the Itch KD cell line in response to Cisplatin treatment for 72 h at 0–6 µg/ml. B Apoptosis assay using the Itch KD cell line treated with 0–6 µg/ml Cisplatin for 72 h. Data was expressed as a percentage of control. C Analysis of apoptotic markers in whole cell lysates from cells treated with Cisplatin in U18666A. D Western blot analysis of total expression levels of STARD1 and VDAC2 (dimers) in control and Itch KD OE33 cell lines. Error bars represent the standard error of the mean. Statistical significance was calculated by Student’s t test. E Quantification of STARD1 band intensity normalised to the loading control in three independent experiments. Statistical analysis was performed using Student’s t test, ***p < 0.001. F Immunoprecipitation of VDAC2 from OE33 detergent extract. The samples were incubated overnight with a control IgG and the VDAC2 antibody and washed four times. Co-immunoprecipitated proteins were separated by SDS-PAGE electrophoresis and STARD1 and Itch were detected by Western blotting. G A schematic image illustrating the suggested model for Itch in regulation of extrinsic and intrinsic apoptosis. A reduction in TRAIL-R at the cell surface impairs downstream apoptotic signalling, which moreover is not further amplified at the mitochondria. Loss of Itch expression results in an increase in mitochondrial cholesterol which impairs membrane fluidity, binding of caspase-8, subsequent activation of Bid and Bax. Together, this results in reduced pore formation in the outer mitochondrial membrane and reduced cytochrome c release. Mechanistically loss of Itch expression results in reduced ubiquitination and degradation of the STARD1/VDAC2 lipid transfer complex that mediates cholesterol import to mitochondria. A stabilisation of STARD1/VDAC2 promotes import of mitochondrial cholesterol which is anti-apoptotic. Statistical significance; *p < 0.05, ***p < 0.001.

References

    1. Shah SS, Kumar S. Adaptors as the regulators of HECT ubiquitin ligases. Cell Death Differ. 2021;28:455–72. doi: 10.1038/s41418-020-00707-6. - DOI - PMC - PubMed
    1. Yin Q, Han T, Fang B, Zhang G, Zhang C, Roberts ER, et al. K27-linked ubiquitination of BRAF by ITCH engages cytokine response to maintain MEK-ERK signaling. Nat Commun. 2019;10:1870. doi: 10.1038/s41467-019-09844-0. - DOI - PMC - PubMed
    1. Azakir BA, Desrochers G, Angers A. The ubiquitin ligase Itch mediates the antiapoptotic activity of epidermal growth factor by promoting the ubiquitylation and degradation of the truncated C‐terminal portion of Bid. FEBS J. 2010;277:1319–30. doi: 10.1111/j.1742-4658.2010.07562.x. - DOI - PubMed
    1. Clorennec CL, Lazrek Y, Dubreuil O, Sampaio C, Larbouret C, Lanotte R, et al. ITCH-dependent proteasomal degradation of c-FLIP induced by the anti-HER3 antibody 9F7-F11 promotes DR5/caspase 8-mediated apoptosis of tumor cells. Cell Commun Signal. 2019;17:106. doi: 10.1186/s12964-019-0413-8. - DOI - PMC - PubMed
    1. Chang L, Kamata H, Solinas G, Luo J-L, Maeda S, Venuprasad K, et al. The E3 ubiquitin ligase itch couples JNK activation to TNFalpha-induced cell death by inducing c-FLIP(L) turnover. Cell. 2006;124:601–13. doi: 10.1016/j.cell.2006.01.021. - DOI - PubMed

Publication types

MeSH terms