. 2024 Jan 12;15(1):494.
doi: 10.1038/s41467-023-43854-3.

Global emergence of a hypervirulent carbapenem-resistant Escherichia coli ST410 clone

Affiliations

Global emergence of a hypervirulent carbapenem-resistant Escherichia coli ST410 clone

Xiaoliang Ba et al. Nat Commun. .

Abstract

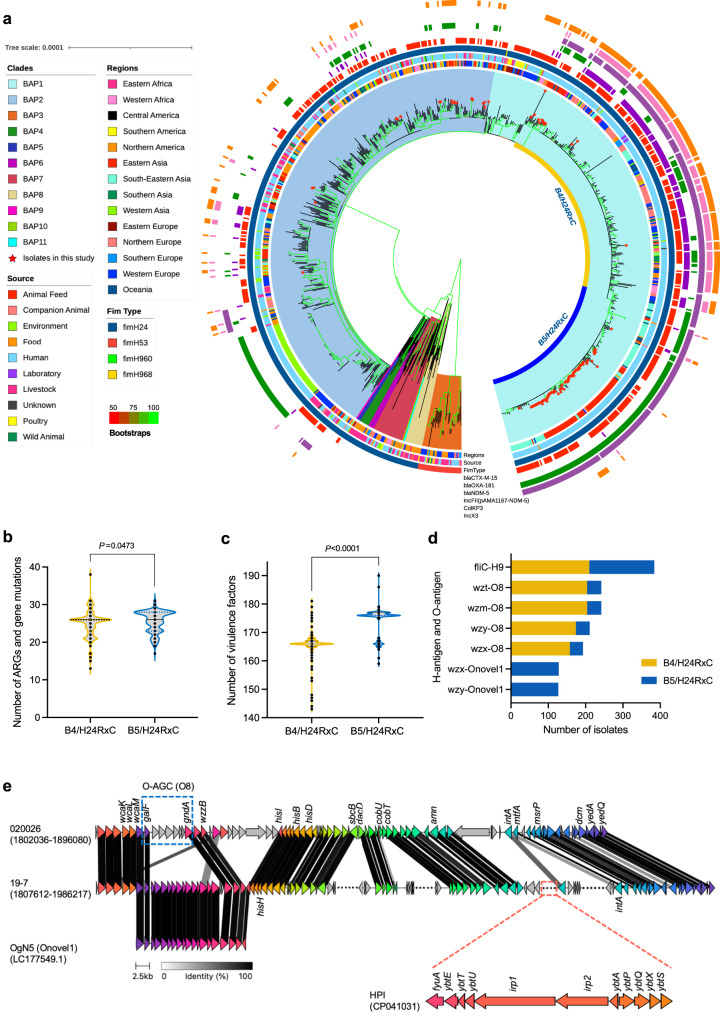
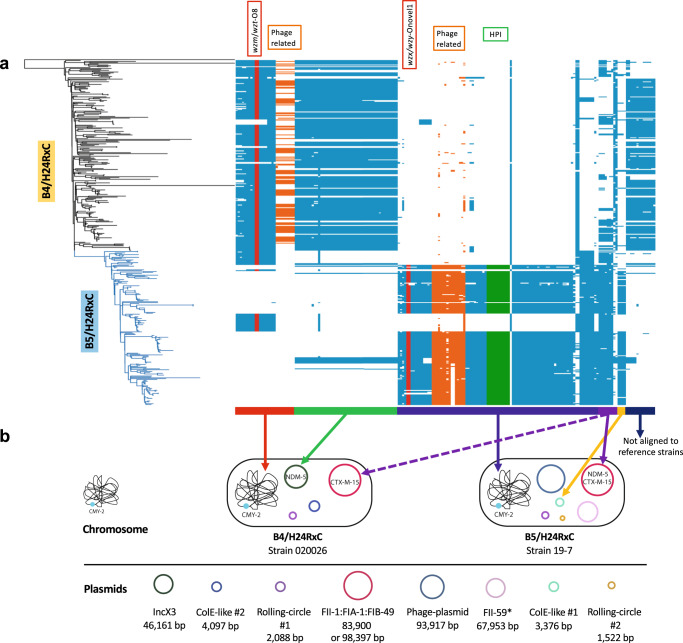
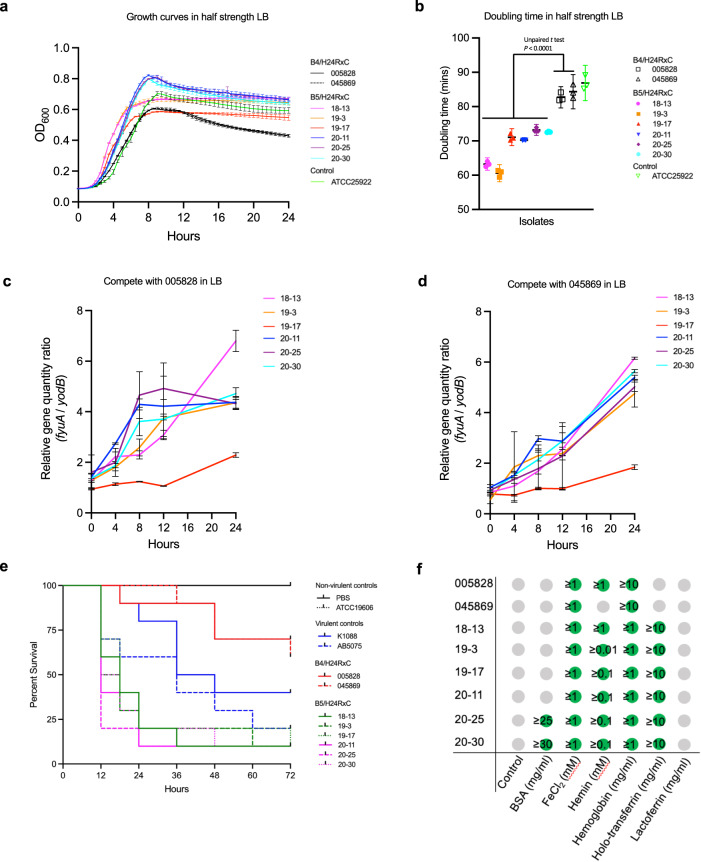
Carbapenem-resistant Escherichia coli (CREC) ST410 has recently emerged as a major global health problem. Here, we report a shift in CREC prevalence in Chinese hospitals between 2017 and 2021 with ST410 becoming the most commonly isolated sequence type. Genomic analysis identifies a hypervirulent CREC ST410 clone, B5/H24RxC, which caused two separate outbreaks in a children's hospital. It may have emerged from the previously characterised B4/H24RxC in 2006 and has been isolated in ten other countries from 2015 to 2021. Compared with B4/H24RxC, B5/H24RxC lacks the blaOXA-181-bearing X3 plasmid, but carries a F-type plasmid containing blaNDM-5. Most of B5/H24RxC also carry a high pathogenicity island and a novel O-antigen gene cluster. We find that B5/H24RxC grew faster in vitro and is more virulent in vivo. The identification of this newly emerged but already globally disseminated hypervirulent CREC clone, highlights the ongoing evolution of ST410 towards increased resistance and virulence.


Conflict of interest statement

The authors declare no competing interests.

Figures

Fig. 1
Fig. 1. Characteristics of CREC isolates (n = 388) from Chinese hospitals.
a The geographical distribution of the CREC isolates collected in this study shown on the map of P. R. China. b Bar chart showing the various types of clinical samples used in this study for the isolation of CREC. c Bar chart showing the distribution of isolation years. d Bar chart showing the 10 most identified STs in this CREC collection. e Bar chart showing identified carbapenem-resistant genes in this CREC collection. f Violin plot showing the distribution of MICs of imipenem, meropenem and ertapenem for the CREC isolates, the median MIC for each carbapenem antibiotics is represented with a black line. The plot for ertapenem MIC was generated based on data for isolates (n = 168) in the Guangzhou Medical University (GMU) collection. Source data are provided as a Source Data file.
Fig. 2
Fig. 2. Outbreaks of a ST410 lineage in a children’s hospital.
a Gantt plot showing the length of hospital stay of the patients in the children’s hospital in eastern China. Patient ID are presented on the y axis and the length of stay of each patient is represented with coloured bars. A black dot within the coloured bars indicates the time of the isolation of the isolates. b Bar chart showing the age distribution of the patients. c Maximum-likelihood core-genome SNP phylogeny of the 49 ST410 CREC isolates in the children’s hospital. Colours indicates the SNP distance to the reference genome 19-7. Bootstrap values are represented by gradient colours. Source data are provided as a Source Data file.
Fig. 3
Fig. 3. Phylogeny of a global ST410 collection.
a Midpoint rooted maximum-likelihood phylogeny of 956 global ST410 was constructed using a core-genome SNP alignment generated by Snippy v4.6.0 with ST410 isolate YD786 (GenBank accession CP013112.1) as the reference. Branch support was performed with 1000 bootstrap replicates. Bootstrap values are represented with gradient colours. Isolates from this study are indicated with a red star. b Violin plot showing the distribution of total number of ARGs and mutations that confer resistance in B4/H24RxC and B5/H24RxC clones. Statistical difference between the two clones was assessed with two-tailed unpaired Student’s t test. c Violin plot showing distribution of total number of virulence factors in B4/H24RxC and B5/H24RxC clones. Statistical difference was assessed with two-tailed unpaired Student’s t test. d Bar plot showing the presence of the lipopolysaccharide (O) and flagellar (H) surface antigens in B4/H24RxC and B5/H24RxC clones. e Comparison of the recombination regions in strain 020026 and 19-7 identified the O-antigen switch from O8 in B4/H24RxC to Onovel1 (OgN5) in B5/H24RxC and the HPI gene cluster in B5/H24RxC clone. Source data are provided as a Source Data file.
Fig. 4
Fig. 4. FII-1:FIA-1:FIB-49 plasmids analysis.
a Comparison of the backbone of the F-type plasmids in the B4/H24RxC and B5/H24RxC clones. b Comparison of resistance regions found in F-type plasmids. Genbank accessions for plasmids: pCTXM15_020026 (CP034956), pE22P1 (CP123037), p18-4P1 (CP123014), p19-7P2 (CP123019), p20-20P2 (CP123031).
Fig. 5
Fig. 5. Core-genome genes associated with the B5/H24RxC MDR clone.
a Presence and absence of the genes positively and negatively associated with the B5/H24RxC clone mapped to the phylogeny. Genes are aligned and ordered against the complete genomes of the reference strains 020026 (Genbank: CP034954 to CP034958) and 19-7 (CP123017 to CP123023). Genes located in phage regions are shaded in orange, genes found in the high pathogenicity island (HPI) are in green and O-group genes are in red. b Schematic representation of the chromosome and plasmids in the reference strains 020026 and 19-7. Colour bars and arrows indicate the location of the genes in the genomes of the reference strains. blaCMY-2 was chromosomally integrated in B4/H24RxC as reported previously and in B5/H24RxC. Source data are provided as a Source Data file.
Fig. 6
Fig. 6. Coalescence-based analysis of E. coli ST410.
a A time-calibrated phylogeny was reconstructed using BEAST2.0 based on the nonrecombinant SNPs for the 500 selected E. coli ST410. The MDR clone B4/H24RxC and B5/H24RxC are coloured in orange and blue, respectively. b The Bayesian skyline plot illustrates the predicted demographic changes of the ST410 clades. The thick solid line represents the median estimate of the effective population size, with 95% confidence interval shown in lighter blue area. c An enlarged phylogenetic tree showing the B4/H24RxC and B5/H24/RxC clones.
Fig. 7
Fig. 7. Phenotypic comparison of B4/H24RxC and B5/H24RxC clones.
a Growth curves in half strength LB for strains of both clones. Strain ATCC 25922 was included as a growth control. Data are shown as mean ± SD from n = 3 biological replicates. b Doubling time in half strength LB for isolates of both clones. Strain ATCC 25922 was included as a growth control. Data are shown as mean ± SD from n = 3 biological replicates. Statistical difference was assessed with two-tailed unpaired Student’s t test. c, d qPCR-based competition assay for strains of both clones. The figures show the relative quantity ratio of gene fyuA in B5/H24RxC strains to gene yodB in B4/H24RxC strains 005828 and 045869. Data are shown as mean ± SD from n = 3 biological replicates. Statistical difference was assessed with two-tailed unpaired Student’s t test. e Survival curves for wax moth larvae (G. mellonella) infected with ~2 × 106 CFU of different isolates in the B4/H24RxC and B5/H24RxC clones. Hypervirulent Klebsiella pneumoniae strain K1088 and hypervirulent Acinetobacter baumannii strain AB5075 were used as positive controls while Acinetobacter baumannii ATCC 19606 and PBS were used as negative controls. The curves represent the mean of three biological repeats. f The ability to utilise different iron sources by B4/H24RxC and B5/H24RxC clones. Green circles indicate growth and the numbers inside show the lowest tested concentration of the iron sources needed for the isolates to grow. Grey circles indicate no growth was observed at any concentration of the iron sources used. n = 2 biological independent experiments with the same result. Source data are provided as a Source Data file.

References

    1. Murray C. J. L. et al. Global burden of bacterial antimicrobial resistance in 2019: a systematic analysis. Lancet399, 629–655 (2022). - PMC - PubMed
    1. Hickman R. A. et al. Exploring the antibiotic resistance burden in livestock, livestock handlers and their non-livestock handling contacts: a one health perspective. Front. Microbiol.12, 651461 (2021). - PMC - PubMed
    1. Magiorakos AP, et al. Multidrug-resistant, extensively drug-resistant and pandrug-resistant bacteria: an international expert proposal for interim standard definitions for acquired resistance. Clin. Microbiol. Infect. 2012;18:268–281. doi: 10.1111/j.1469-0691.2011.03570.x. - DOI - PubMed
    1. Papp-Wallace KM, Endimiani A, Taracila MA, Bonomo RA. Carbapenems: past, present, and future. Antimicrob. Agents Chemother. 2011;55:4943–4960. doi: 10.1128/AAC.00296-11. - DOI - PMC - PubMed
    1. Meletis G. Carbapenem resistance: overview of the problem and future perspectives. Ther. Adv. Infect. Dis. 2016;3:15–21. - PMC - PubMed

MeSH terms

LinkOut - more resources