. 2024 Mar;20(3):187-216.
doi: 10.1038/s44320-023-00007-4. Epub 2024 Jan 12.

Basal MET phosphorylation is an indicator of hepatocyte dysregulation in liver disease

Affiliations

Basal MET phosphorylation is an indicator of hepatocyte dysregulation in liver disease

Sebastian Burbano de Lara et al. Mol Syst Biol. 2024 Mar.

Abstract

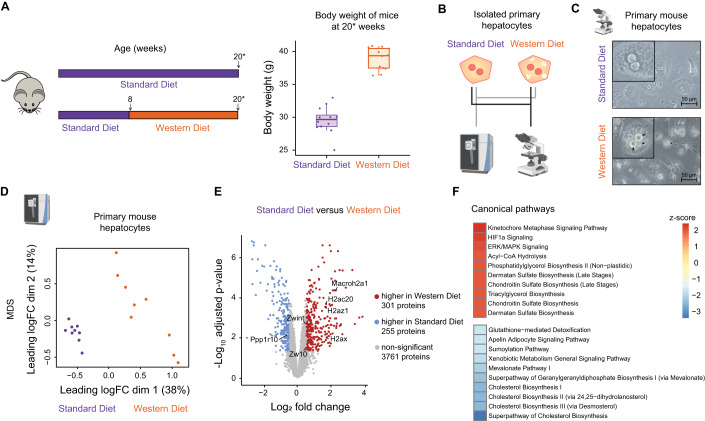
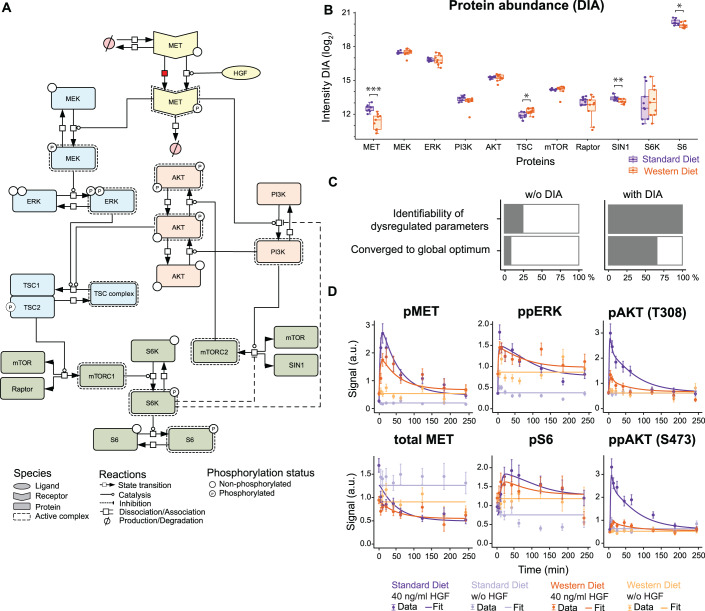
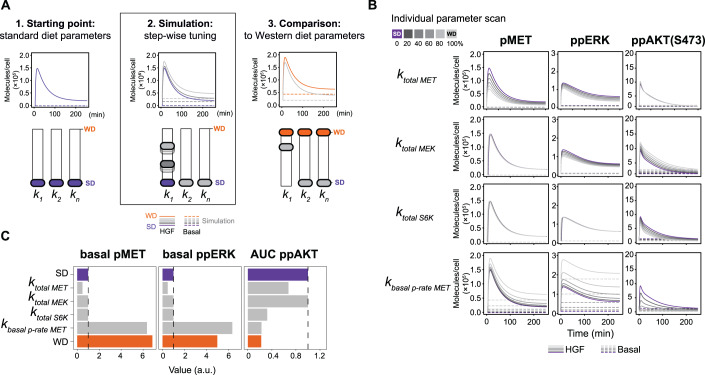
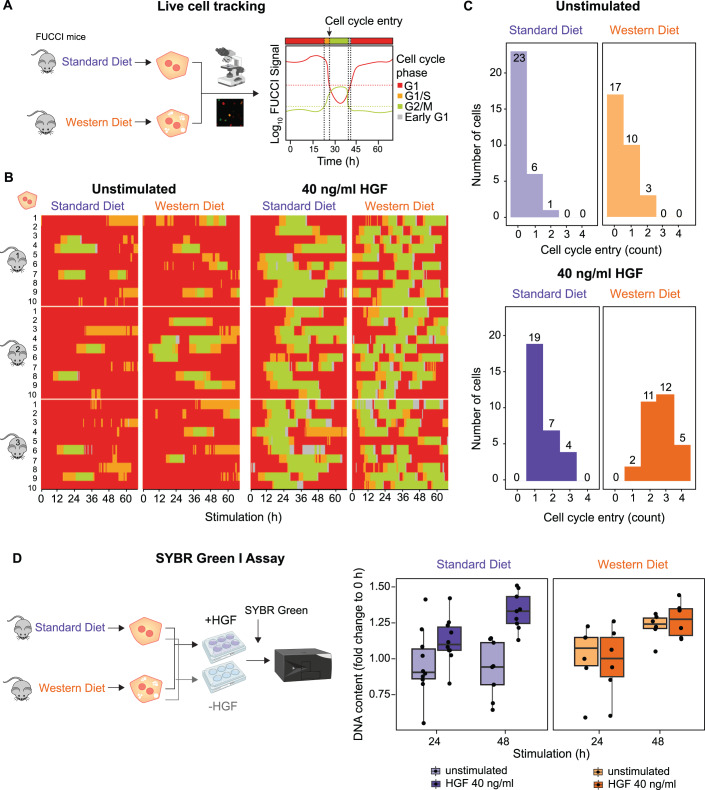
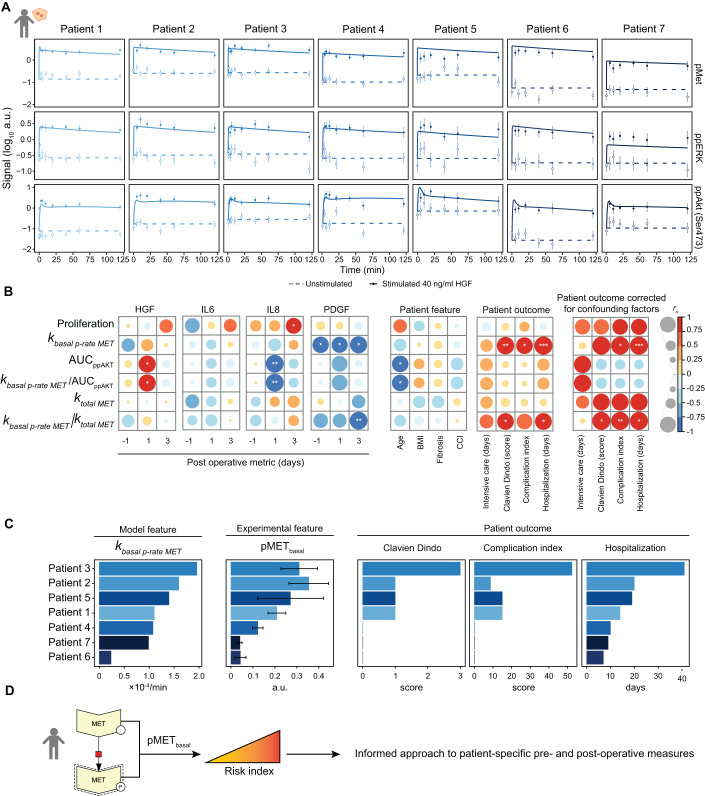
Chronic liver diseases are worldwide on the rise. Due to the rapidly increasing incidence, in particular in Western countries, metabolic dysfunction-associated steatotic liver disease (MASLD) is gaining importance as the disease can develop into hepatocellular carcinoma. Lipid accumulation in hepatocytes has been identified as the characteristic structural change in MASLD development, but molecular mechanisms responsible for disease progression remained unresolved. Here, we uncover in primary hepatocytes from a preclinical model fed with a Western diet (WD) an increased basal MET phosphorylation and a strong downregulation of the PI3K-AKT pathway. Dynamic pathway modeling of hepatocyte growth factor (HGF) signal transduction combined with global proteomics identifies that an elevated basal MET phosphorylation rate is the main driver of altered signaling leading to increased proliferation of WD-hepatocytes. Model-adaptation to patient-derived hepatocytes reveal patient-specific variability in basal MET phosphorylation, which correlates with patient outcome after liver surgery. Thus, dysregulated basal MET phosphorylation could be an indicator for the health status of the liver and thereby inform on the risk of a patient to suffer from liver failure after surgery.

Keywords: Dynamic Pathway Modeling; Fatty Liver Disease; HGF Signal Transduction; Hepatocyte Dysregulation; Western Diet.


Conflict of interest statement

The authors declare no competing interests. UK is an editorial advisory board member. This has no bearing on the editorial consideration of this article for publication.

Figures

Figure 1
Figure 1. Western diet-induced proteome alterations.
(A) Schematic representation of the experimental setup. Mice were fed with standard diet (SD) for eight weeks and then switched to Western diet (WD) for 12–13 weeks or continued to receive SD as control. The body weight of SD mice is shown as boxplot with the center line indicating median (29.65 g); box limits indicate 25th (28.58 g) to 75th percentile (30.33 g). The lower and upper whiskers extend from the hinge to the smallest (28.0 g) or largest value (32.0) at most 1.5× interquartile range of the hinge. The body weight of WD mice is shown as boxplot with the center line indicating median (39.35 g); box limits indicate 25th (37.48 g) to 75th percentile (40.45 g). The lower and upper whiskers extend from the hinge to the smallest (36.3 g) or largest value (40.8) at most 1.5× interquartile range of the hinge. The dots represent data of single mice (n = 9 per diet). 20*: mice have an age of 20 or 21 weeks. (B) Primary mouse hepatocytes from SD and WD mice were isolated by liver perfusion, cultivated and characterized employing mass spectrometry and bright field imaging. (C) Exemplary bright field images from isolated primary mouse hepatocytes depict lipid droplet formation in hepatocytes derived from WD-fed mice, but not SD-fed mice. Arrows point to lipid droplets. (D) Multidimensional scaling analysis of the mass spectrometry-based hepatocyte proteome derived from SD and WD mice. Each dot represents the sample from one mouse (n = 9 per diet). (E) Up- and downregulated proteins in primary mouse hepatocytes derived from SD and WD mice were identified using the limma package by log fold change calculation and analysis of the adjusted p value (limma-voom (Law et al, 2014)) as depicted in the volcano plot. Proteins with fold change <−0.5 and adjusted p value <0.05, describing a downregulation in WD, are indicated in blue, proteins with fold change >0.5 and adjusted p value < 0.05, representing an upregulation in WD, are indicated in red (n = 9 per diet). (F) The top 10 up- and downregulated pathways in WD primary mouse hepatocytes in comparison to SD primary mouse hepatocytes are depicted as identified by Ingenuity pathway analysis (Krämer et al, 2014). Source data are available online for this figure.
Figure 2
Figure 2. HGF-induced activation of signal transduction in SD and WD hepatocytes.
(A) Experimental design of HGF stimulation experiments in primary mouse hepatocytes. Isolated cells were seeded and stimulated with hepatocyte growth factor (HGF). HGF-induced signal transduction was analyzed by quantitative immunoblotting. (B) HGF dose dependency of MET, ERK and AKT phosphorylation in SD and WD primary mouse hepatocytes. Cells were stimulated with indicated doses of HGF and phosphorylation of MET, ERK and AKT was quantified by immunoblotting after 10 min. Signal is shown in arbitrary units (a.u.). Data points are displayed as dots with error bars representing 1σ confidence interval estimated from biological replicates (n = 3–9 per diet and dose) using a combined scaling and error model. Dashed curves represent linear interpolations. The dose of 40 ng/ml HGF is indicated as a vertical dashed line. (C) Time course measurements of HGF-induced signal transduction in primary mouse hepatocytes of SD and WD mice. Cells were stimulated with 40 ng/ml HGF for up to 4 h and the phosphorylation as well as the abundance of MET, ERK and AKT was quantified by immunoblotting. Signal is shown in arbitrary units (a.u.). Data points are displayed as dots with error bars representing 1σ confidence interval estimated from biological replicates (n = 3–9 per diet and time point) using a combined scaling and error model. Dashed curves represent linear interpolations. Horizontal dashed lines indicate basal and peak signal levels. The 10 min time point is indicated by a vertical dashed line. Source data are available online for this figure.
Figure 3
Figure 3. Modeling WD-induced alterations in HGF signal transduction.
(A) The structure of the mathematical model capturing HGF-induced signal transduction via the MAPK cascade (blue), the PI3K pathway (red) and mTOR signaling (green) is displayed according to Systems Biology Graphical Notation (Le Novere et al, 2009). All parameter values were implemented as identical for WD and SD hepatocytes except for the basal MET phosphorylation rate, indicated by the red box, and protein abundances. (B) Measurements of protein abundances derived from primary mouse hepatocytes. Lysates of unstimulated hepatocytes were subjected to data-independent mass spectrometry analysis. Resulting data was LFQ normalized and represented as boxplot: center line indicates median; box limits indicate 25th to 75th percentiles. The lower and upper whiskers extend from the hinge to the smallest or largest value at most 1.5× interquartile range of the hinge. Dots represent data of single mice (n = 9 per diet). p values were calculated using two-tailed t test (MET ***0.0002, TSC *0.01, SIN1 **0.006, S6 *0.01). (C) Impact of the DIA data on parameter identifiability and convergence of the mathematical model. The identifiability of the twelve dysregulated parameters increases from 25% to 100% upon DIA data incorporation, while the convergence to the global optimum during optimization increases from 9% to 66%. (D) Model calibration with time-resolved immunoblot measurements for MET, ERK, S6 and AKT phosphorylation and MET abundance upon stimulation with 40 ng/ml HGF. Data points are displayed as dots along with error bars representing 1σ confidence interval estimated from biological replicates (n = 3–9 per diet and time point) using a combined scaling and error model. Model trajectories are depicted as solid lines.
Figure 4
Figure 4. Influence of dysregulated parameters on protein dynamics.
(A) Schematic overview of the simulation analysis for diet-specific parameters. 1. All parameters were fixed to the estimates for SD hepatocytes. 2. Step-wise tuning of one dysregulated parameter at a time until it reached the value estimated for WD hepatocytes. 3. Model simulations were compared to the WD signaling dynamics. (B) Individual parameter scan of one dysregulated parameter at a time (ktotal MET, ktotal MEK, ktotal S6K, kbasal p-rate MET). The value for the indicated parameter was gradually shifted from the SD estimate (purple) to the WD estimate (light gray) as described in (A). The model simulations for the phosphorylation dynamics of MET, ERK and AKT are displayed in molecules/cell. Solid lines indicate model trajectories after HGF stimulation and dashed lines indicate basal levels. (C) Quantitative analysis of the ability of dysregulated parameters to reproduce WD-specific features (basal pMET, basal ppERK, AUC ppAKT). We reoptimized each dysregulated parameter individually in the range between SD and WD estimates to determine the best fit for the three features. Colored bars represent the feature value as determined from the original model fit for SD and WD. Gray bars indicate the optimized feature value for dysregulated parameters. Source data are available online for this figure.
Figure 5
Figure 5. Altered proliferation of WD hepatocytes.
(A) SD and WD mice carrying the Fucci2 cell cycle reporter were used to track cell cycle entries of primary mouse hepatocytes via live cell imaging. Cells were transduced with adeno-associated viral vectors encoding Histone2B–mCerulean. The FUCCI signal indicates the cell cycle phase of a cell at a given time and enables tracking of cell cycle entry. (B) Primary mouse hepatocytes of mice carrying the Fucci2 cell cycle reporter were stimulated with 40 ng/ml HGF or left untreated. Live cell microscopy of hepatocytes from SD and WD mice was performed with sampling rate of 15 min for up to 65 h. Ten exemplary hepatocytes of three SD and three WD mice each were tracked. The time course of cell cycle phases G1, G1/S, and G2/M and early G1 are displayed for each cell. (C) Quantification of cell cycle entries per cell. A cell cycle entry was considered if cells transited from S to G2-phase as indicated in (B). Shown are the number of cell cycle entries as a histogram indicating the number of cells that underwent a certain amount of cell cycle entries in each condition. (D) Primary mouse hepatocytes from SD and WD wildtype mice were stimulated with 40 ng/ml HGF or left untreated. Using SYBR Green I Assay, the DNA content of cells was measured at 0 h and after 24 h and 48 h. The DNA content as fold-change (FC) to 0 h is displayed as a boxplot: center line indicates median; box limits indicate 25th to 75th percentiles. The lower and upper whiskers extend from the hinge to the smallest or largest value at most 1.5× interquartile range of the hinge. Dots represent data of single mice (n = 9 for SD and n = 6 for WD). Source data are available online for this figure.
Figure 6
Figure 6. Basal pMET levels in primary human hepatocytes correlate to patient outcome.
(A) Time-resolved immunoblot measurements and model fits for pMET, pERK and ppAKT in primary human hepatocytes derived from seven patients. Cells were stimulated with 40 ng/ml HGF or left untreated. Signal is shown in log10 arbitrary units (a.u.). Data points are displayed as dots along with error bars representing 1σ confidence interval estimated from technical replicates (n = 1–3 per patient) using a combined scaling and error model. Model trajectories are depicted as lines. (B) Spearman correlation of hepatocyte proliferation and model features with post-operative blood metrics, patient-specific features and outcome. Significance levels were calculated using the algorithm AS89 (Best and Roberts, 1975) and are indicated as *p < 0.05, **p < 0.01, ***p < 0.001. BMI body mass index, CCI Charlson comorbidity index. In addition, partial correlation coefficients were calculated for the patient outcome correcting for the confounding factors age, BMI, fibrosis and CCI. (C) The patient-specific basal phosphorylation rate of MET as estimated by the model is depicted in comparison to the experimentally measured basal pMET levels, obtained as mean of all unstimulated pMET measurements per patient in arbitrary units (a.u.). In comparison, the clinical metrics Clavien Dindo, complication index and hospitalization are shown. Patients are sorted by the basal phosphorylation rate of MET, colors indicate patient number. Error bars represent the standard deviation of 7–9 replicates. (D) The basal phosphorylation of MET as an informative metric in patients for liver disease burden and patient recovery after liver surgery. The proposed use as risk index gives an informed approach to patient-specific pre- and post-operative measures. Source data are available online for this figure.
Figure EV1
Figure EV1. Quantitative data for calibration of the mouse model.
(A) Model calibration with HGF dose-resolved signal transduction measurements in primary mouse hepatocytes of SD and WD mice. Cells were stimulated with indicated doses of HGF for 10 min and phosphorylation of MET, ERK and AKT was quantified by immunoblotting. Signal is shown in arbitrary units (a.u.). Data points are displayed as dots with error bars representing 1σ confidence interval estimated from biological replicates (n = 3–9 per diet and dose) using a combined scaling and error model. Model trajectories are represented by solid lines. (B) Model calibration with HGF time-resolved signal transduction measurements in primary mouse hepatocytes of SD and WD mice. Immunoblot measurements for ERK, AKT and S6 abundance upon stimulation with 40 ng/ml HGF. Data points are displayed as dots along with error bars representing 1σ confidence interval estimated from biological replicates (n = 3–9 per diet and time point) using a combined scaling and error model. Model trajectories are depicted as solid lines. (C) A Bayesian information criterion (BIC) analysis was performed to determine the diet-specific parameters needed to describe the experimental data. The threshold for rejection was set to ∆BIC = 10 as suggested (Lorah and Womack, 2019). H0 including 64 parameters could be reduced to H2.1.2 including 61 parameters, suggesting that only the basal phosphorylation rate of the HGF receptor MET was dysregulated between diets. (D) Correlation of basal MET phosphorylation and MET abundance at time point 0 h. Dots display the respective values for each mouse (n = 9 per diet). Correlation coefficient and p value were calculated using a simple linear regression (p value = 0.19).
Figure EV2
Figure EV2. Impact of the DIA data on identifiability and convergence.
(A) The profile likelihood as a measure of parameter identifiability (Raue et al, 2009) is depicted for all dysregulated parameters before implementation of the DIA data. If the negative log likelihood reaches a statistical threshold in both directions, the parameter has defined confidence bounds and is therefore called identifiable. If this limit is not reached on both sides, the parameter is classified as unidentifiable. Solid lines indicate the profile likelihood of dysregulated parameters for SD (purple) and WD (orange) along with the optimal parameter values as dots. Dashed lines depict thresholds for the confidence interval assessment. (B) The profile likelihood as a measure of parameter identifiability is depicted for all dysregulated parameters after implementation of the DIA data. (C) The convergence of the optimization before implementation of the DIA data is assessed based on a waterfall plot (Raue et al, 2013). This plot depicts the results of 250 optimization runs starting from randomly selected parameter sets sorted by the negative log likelihood. The global optimum, indicated in blue, was reached in 22 of the 250 cases. (D) The convergence of the optimization after implementation of the DIA data is assessed based on a waterfall plot. The global optimum, indicated in blue, was reached in 164 out of 250 cases.
Figure EV3
Figure EV3. Absolute quantification of AKT and model-based estimations of total protein abundance.
(A) Absolute number of molecules of AKT per primary mouse hepatocyte was determined by quantitative immunoblotting. Based on a dilution curve of recombinant AKT, the number of molecules of AKT in 1 µg lysate was determined. This value was converted with the total protein content per primary mouse hepatocyte into the number of molecules of AKT per cell. (B) Measurements of protein abundances derived from primary mouse hepatocytes were implemented in model calibration. Lysates of unstimulated hepatocytes were subjected to data-independent mass spectrometry analysis. Resulting data was LFQ normalized and represented as boxplot: center line indicates median; box limits indicate 25th to 75th percentiles. The lower and upper whiskers extend from the hinge to the smallest or largest value at most 1.5× interquartile range of the hinge. Dots represent the model fit (n = 9 per diet). (C) A list of Hallmark mTORC1 signaling genes was downloaded from Gene Set Enrichment Analysis (GSEA) and used to filter full proteomes of SD and WD mice. Out of 200 listed proteins, 129 were quantified in all samples and used to cluster samples based on protein abundance using the R package pheatmap.
Figure EV4
Figure EV4. Influence of dysregulated parameters on protein dynamics.
Individual parameter scan of one dysregulated parameter at a time as explained in Fig. 4A. The value for the indicated parameter was gradually shifted from the SD estimate (purple) to the WD estimate (light gray). The model simulations for the phosphorylation dynamics of MET, ERK and AKT are displayed in molecules/cell. Solid lines indicate model trajectories after HGF stimulation and dashed lines indicate basal levels.
Figure EV5
Figure EV5. Signal transduction in primary human hepatocytes from steatotic patients.
(A) Isolated primary human hepatocytes from patients with different levels of steatosis were analyzed using quantitative immunoblotting. The ratio of basal MET phosphorylation to MET abundance without HGF stimulation was quantified. Error bars represent one standard deviation (n = 3). (B) Primary human hepatocytes from patients with different levels of steatosis were stimulated with 40 ng/ml HGF. Phosphorylation of AKT was quantified by immunoblotting after 10 min. p values were calculated using a two-tailed t test (pMET/tMET *0.011, AKT *0.018). Error bars represent one standard deviation (n = 3).
Figure EV6
Figure EV6. Quantitative data for calibration of the human model.
(A) Proliferation measurements in isolated primary human hepatocytes from patients. Cells were stimulated with 40 ng/ml HGF. DNA content was measured at time point 0 h and after 48 h by staining with SYBRGreen I. (B) Time-resolved immunoblot measurements and model fits for pS6K as well as MET, AKT, ERK and S6K abundance in primary human hepatocytes derived from seven patients. Cells were stimulated with 40 ng/ml HGF or left untreated. Signal is shown in log10 arbitrary units (a.u.). Data points are displayed as dots along with error bars representing 1σ confidence interval estimated from technical replicates (n = 1–3 per patient) using a combined scaling and error model. Model trajectories are depicted as lines. (C) Measurements for protein abundances derived from primary patient hepatocytes were included as additional data for model calibration. Lysates of unstimulated hepatocytes were subjected to data-independent mass spectrometry analysis (n = 1–3 per patient). Resulting data was normalized using label-free quantification and represented as boxplot: center line indicates the patient median; box limits are defined as 1σ, calculated based on the mean spread of the cohort per protein. The lower and upper whiskers extend from the center line by 3σ. Model fits are represented as black dots.

References

    1. Abe T, Sakaue-Sawano A, Kiyonari H, Shioi G, Inoue K-i, Horiuchi T, Nakao K, Miyawaki A, Aizawa S, Fujimori T. Visualization of cell cycle in mouse embryos with Fucci2 reporter directed by Rosa26 promoter. Development. 2013;140:237–246. doi: 10.1242/dev.084111. - DOI - PubMed
    1. Adlung L, Kar S, Wagner MC, She B, Chakraborty S, Bao J, Lattermann S, Boerries M, Busch H, Wuchter P, et al. Protein abundance of AKT and ERK pathway components governs cell type-specific regulation of proliferation. Mol Syst Biol. 2017;13:904. doi: 10.15252/msb.20167258. - DOI - PMC - PubMed
    1. Afgan E, Baker D, van den Beek M, Blankenberg D, Bouvier D, Cech M, Chilton J, Clements D, Coraor N, Eberhard C, et al. The Galaxy platform for accessible, reproducible and collaborative biomedical analyses: 2016 update. Nucleic Acids Res. 2016;44:W3–W10. doi: 10.1093/nar/gkw343. - DOI - PMC - PubMed
    1. Allaire M, Gilgenkrantz H (2018) The impact of steatosis on liver regeneration. Horm Mol Biol Clin Investig. 10.1515/hmbci-2018-0050 - PubMed
    1. Best DJ, Roberts DE. Algorithm AS 89: the upper tail probabilities of Spearman’s rho. J R Stat Soc Ser C (Appl Stat) 1975;24:377–379.

MeSH terms

Substances