. 2024 Jan 12;22(1):48.
doi: 10.1186/s12967-024-04860-1.

Single-cell sequencing reveals the heterogeneity of B cells and tertiary lymphoid structures in muscle-invasive bladder cancer

Affiliations

Single-cell sequencing reveals the heterogeneity of B cells and tertiary lymphoid structures in muscle-invasive bladder cancer

Hao Yuan et al. J Transl Med. .

Abstract

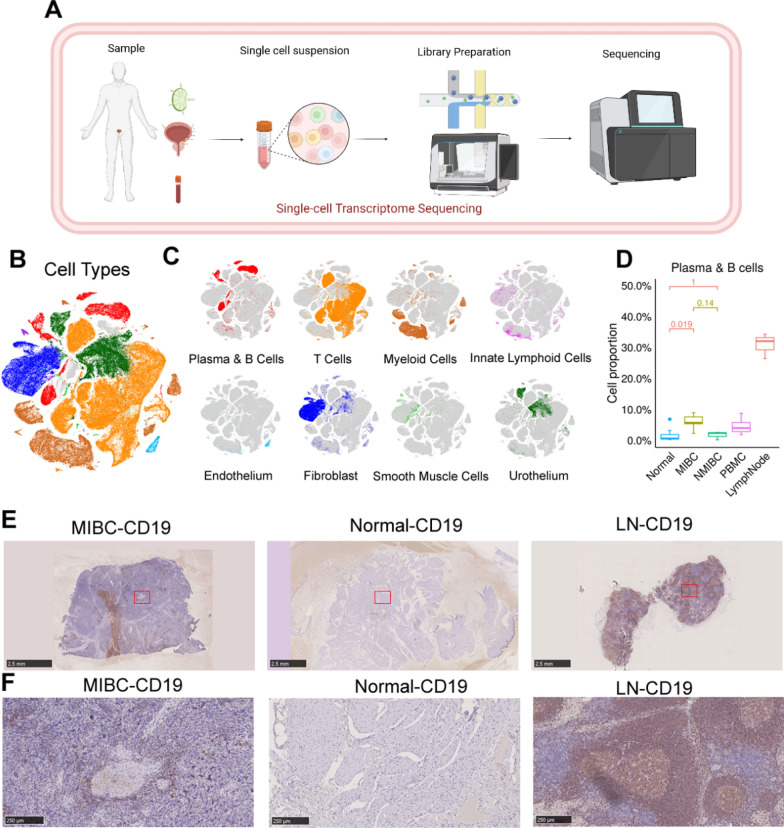
Background: Muscle-invasive bladder cancer (MIBC) is a highly aggressive disease with a poor prognosis. B cells are crucial factors in tumor suppression, and tertiary lymphoid structures (TLSs) facilitate immune cell recruitment to the tumor microenvironment (TME). However, the function and mechanisms of tumor-infiltrating B cells and TLSs in MIBC need to be explored further.

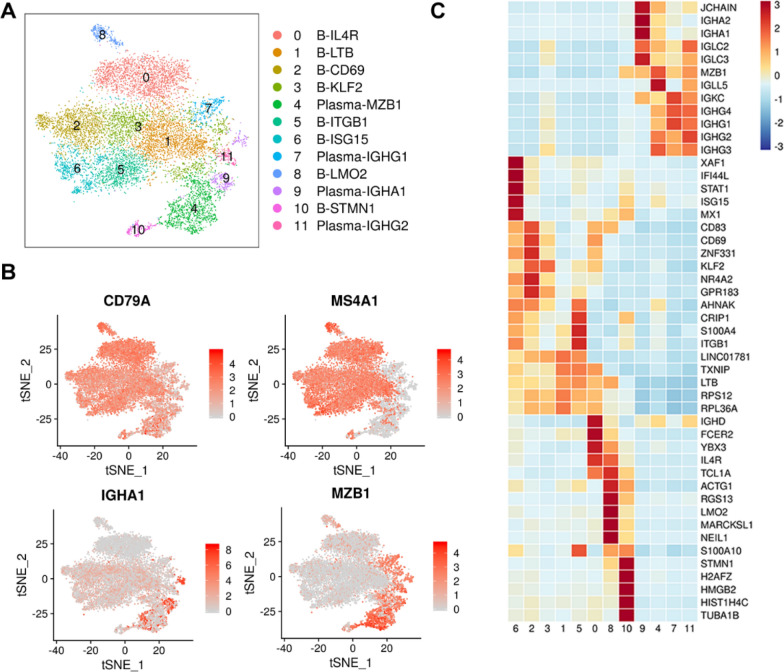
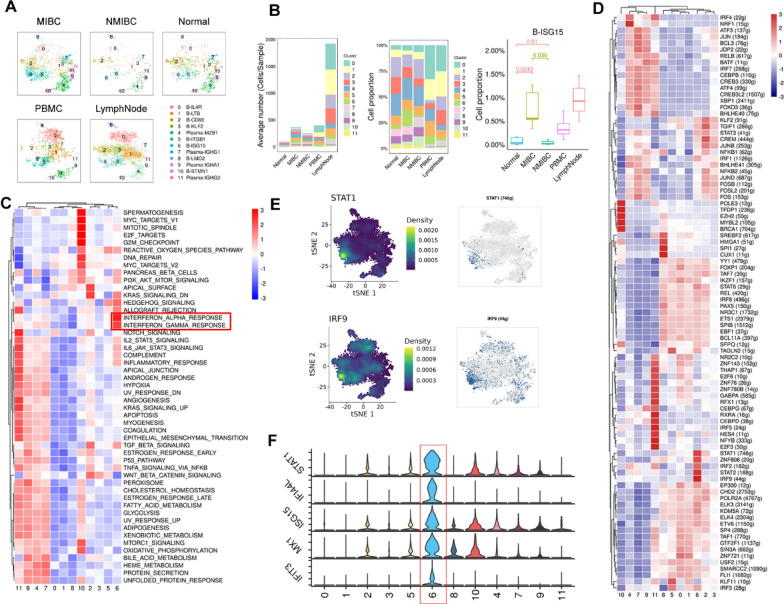
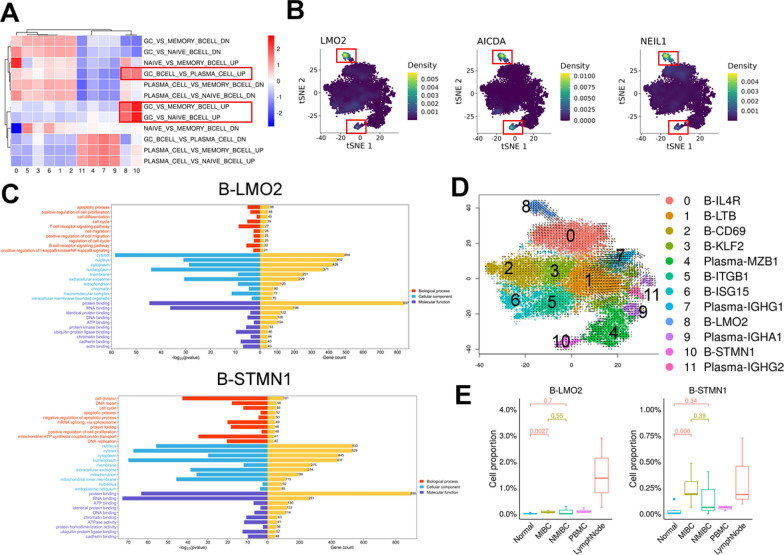
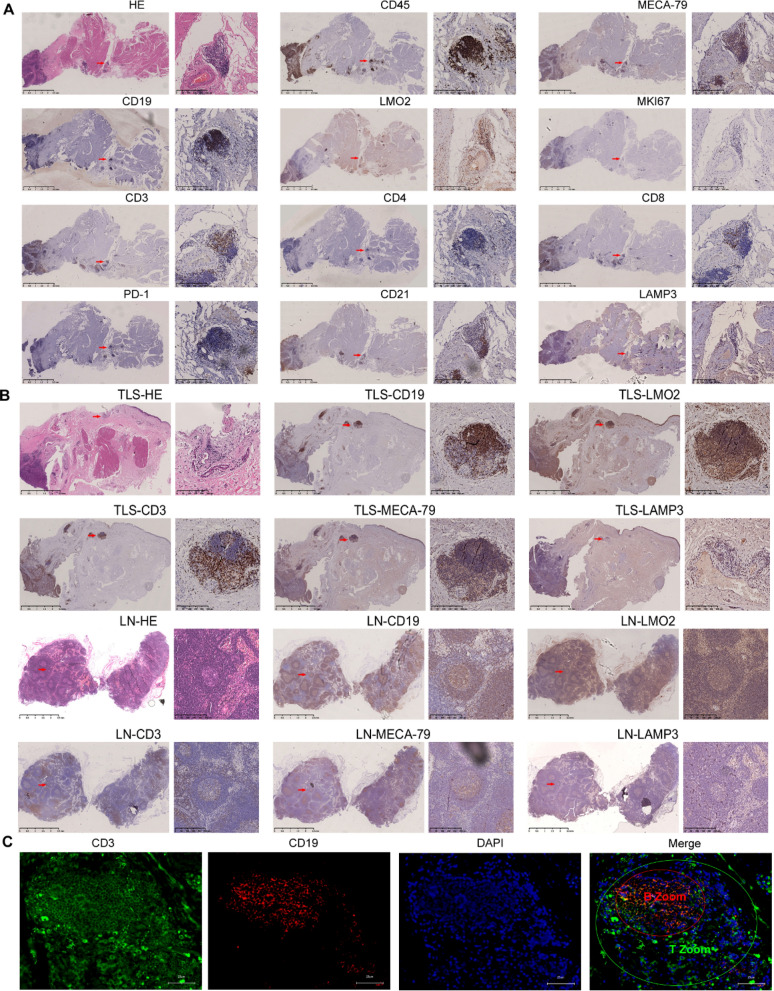
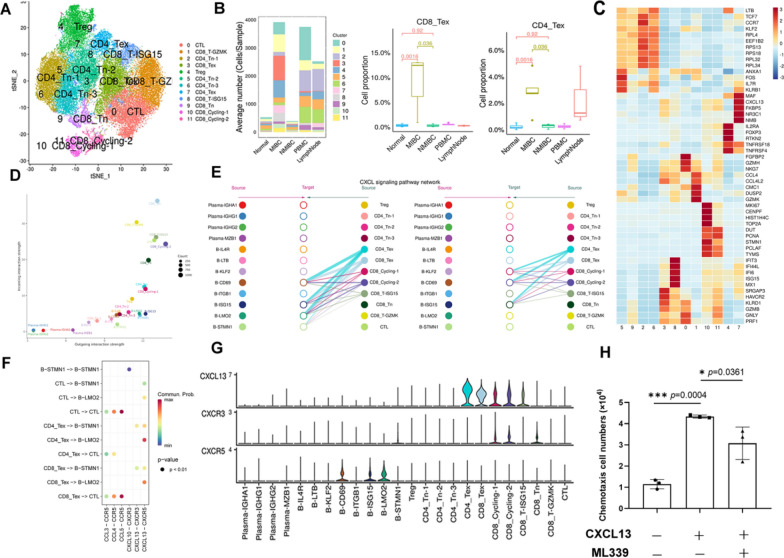
Methods: We performed single-cell RNA sequencing analysis of 11,612 B cells and 55,392 T cells from 12 bladder cancer patients and found naïve B cells, proliferating B cells, plasma cells, interferon-stimulated B cells and germinal center-associated B cells, and described the phenotype, gene enrichment, cell-cell communication, biological processes. We utilized immunohistochemistry (IHC) and immunofluorescence (IF) to describe TLSs morphology in MIBC.

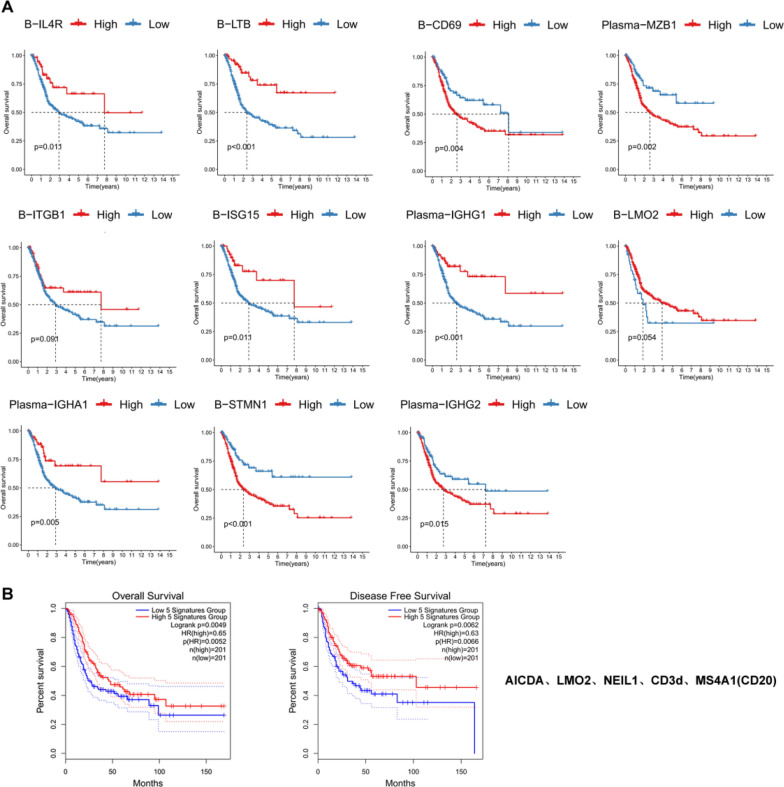
Results: The interferon-stimulated B-cell subtype (B-ISG15) and germinal center-associated B-cell subtypes (B-LMO2, B-STMN1) were significantly enriched in MIBC. TLSs in MIBC exhibited a distinct follicular structure characterized by a central region of B cells resembling a germinal center surrounded by T cells. CellChat analysis showed that CXCL13 + T cells play a pivotal role in recruiting CXCR5 + B cells. Cell migration experiments demonstrated the chemoattraction of CXCL13 toward CXCR5 + B cells. Importantly, the infiltration of the interferon-stimulated B-cell subtype and the presence of TLSs correlated with a more favorable prognosis in MIBC.

Conclusions: The study revealed the heterogeneity of B-cell subtypes in MIBC and suggests a pivotal role of TLSs in MIBC outcomes. Our study provides novel insights that contribute to the precision treatment of MIBC.

Keywords: B cells; CXCL13; Muscle-invasive bladder cancer; Single-cell sequencing; Tertiary lymphoid structures.


Conflict of interest statement

The authors declare no competing interests.

Figures

Fig. 1
Fig. 1
Single-cell transcriptional profiles of bladder cancer tissues and adjacent lymph nodes. A Schematic of the workflow. B The t-distributed stochastic neighbor embedding (tSNE) plot displays the cellular profiles of individual cells, which have been characterized by their dominant cell types. C tSNE plot of single cells profiled by dominant cell types (B cells). D Box plot showing the proportion of B cells and plasma cells from MIBC, NMIBC, normal tissue, PBMC, and lymph node samples. MIBC, n = 7; NMIBC, n = 3; Normal, n = 9; PBMC, n = 4; lymph nodes, n = 3. E, F Immunohistochemical staining of CD19 showing B-cell infiltration in tumor (left), normal tissue, and lymph node (right) samples. Scale bar: 2.5 mm in panoramic images and 250 μm in magnified images
Fig. 2
Fig. 2
B cells in MIBC. A tSNE plot showing the subclustering of 11,612 B cells from 12 patients with bladder cancer. Each cluster is shown in a different color. Twelve clusters are shown in each plot. B The tSNE map shows the distribution of B-cell characteristic genes CD79A and MS4A1 and plasma cell characteristic genes IGHA1 and MZB1. C Heatmap showing the expression levels of functional markers of B-cell subtypes
Fig. 3
Fig. 3
Interferon-stimulated B cells are enriched in MIBC. A tSNE plots of B cells in MIBC; n = 7; NMIBC, n = 3; normal, n = 9; PBMC, n = 4; lymph nodes, n = 3. Each cluster is shown in a different color. B The bar plots depict the mean cell count of each B-cell subtype in each sample on the left. In the middle, the bar plots illustrate the proportion of each B-cell subtype in each sample. On the right, a box plot displays the proportion of B-ISG15 in each sample.; MIBC, n = 7; NMIBC, n = 3; Normal, n = 9; PBMC, n = 4; lymph nodes, n = 3. C Heatmap shows the GSEA score of a set of hallmark genes enriched in B-cell subtypes. D Heatmap showing the activity of SCENIC transcription factor regulons in each B-cell subtype. E Expression levels of STAT1 and IRF9 marker genes illustrated in tSNE plots in each B-cell subtype. F The violin plots depict the expression patterns of IFN-γ genes, colors as in (A)
Fig. 4
Fig. 4
Germinal center-associated B-cell subtypes present in MIBC. A Heatmap shows GSVA scores of enriched germinal center-associated gene sets. B tSNE plot showing the expression densities of the LMO2, AICDA, and NEIL1 genes in B-cell subtypes. C The Gene Ontology (GO) terms of genes that exhibited significant enrichment in B-LMO2 (top) and B-STMN1 (bottom) were determined through the application of Fisher's test for statistical analysis. D RNA velocity of B-cell subtypes. It shows the transformation of B-cell subtypes. E Box plot showing the proportions of B-LMO2 (left) and B-STMN1 (right) in MIBC, NMIBC, normal tissue, PBMC, and lymph node samples
Fig. 5
Fig. 5
TLSs in MIBC. A HE staining shows TLSs (red squares) in MIBC, and IHC staining shows the following markers of TLSs (red squares): CD45, CD19, CD3, MKI67, CD4, CD8, PD-1, CD21, LAMP3, MECA79A and LMO2. Scale bar: 2.5 mm in panoramic images and 100 μm in magnified images. B H&E staining and IHC for the indicated markers for representative LNs (two columns below) and TLSs (two columns above). Scale bar: 2.5 mm in panoramic images and 100 μm in magnified images. C mIF for the indicated markers for representative TLSs. The following markers are shown in individual and merged channels: CD3 (green), T-cell marker; CD19 (red), B-cell marker; DAPI (blue), nuclear marker. Scale bar: 25 μm
Fig. 6
Fig. 6
Transcriptome analysis revealed that T cells recruit B cells via CXCL13-CXCR5 in MIBC. A tSNE plot showing T-cell subtypes. B Average cell numbers of T-cell subtypes in original samples (left). Box plot showing the proportions of CD8_Tex (middle) and CD4_Tex (right) cells in the original samples. C Heatmap indicating the scaled expression of T-cell marker genes. D Bubble plot indicating cell roles: The color of the dots represents different cell groups, the size of the dots is proportional to the number of ligands and receptors inferred for each cell group, and the x and y axes indicate the strength of the cell group as a signal sender and receiver, respectively. E Hierarchy diagram: “Source” represents the cell class that sends the signal, “target” represents the cell class that receives the signal, and the circle color represents the cell class. F The signaling pathway relationship to the bubble diagram shows significant interactions between the ligand‒receptor (L-R) pairs of subpopulations. G The violin diagram shows the expression levels of genes involved in signaling pathways. H Migration of CXCR5 + B cells treated with (middle) or without (left) CXCL13 and the CXCR5 antagonist (right)
Fig. 7
Fig. 7
Prognostic value of B-cell subtypes and TLSs in MIBC. A The Kaplan‒Meier method was used to analyze the effect of different B-cell subtypes on the survival rate of patients with MIBC (p < 0.05). B The Kaplan‒Meier method was used to analyze the effect of MS4A1 (CD20), CD3d, LMO2, AICDA and NEIL1 gene combination expression on the survival rate of patients with MIBC (p < 0.05)

References

    1. Sung H, Ferlay J, Siegel RL, Laversanne M, Soerjomataram I, Jemal A, Bray F. Global cancer statistics 2020: GLOBOCAN estimates of incidence and mortality worldwide for 36 cancers in 185 countries. Ca Cancer J Clin. 2021;71:209–249. doi: 10.3322/caac.21660. - DOI - PubMed
    1. Tran LD, Xiao JF, Agarwal N, Duex JE, Theodorescu D. Advances in bladder cancer biology and therapy. Nat Rev Cancer. 2021;21:104–121. doi: 10.1038/s41568-020-00313-1. - DOI - PMC - PubMed
    1. Robertson AG, Kim J, Al-Ahmadie H, Bellmunt J, Guo GW, Cherniack AD, Hinoue T, Laird PW, Hoadley KA, Akbani R, et al. Comprehensive molecular characterization of muscle-invasive bladder cancer. Cell. 2017;174:1033. doi: 10.1016/j.cell.2018.07.036. - DOI - PMC - PubMed
    1. Sanli O, Dobruch J, Knowles MA, Burger M, Alemozaffar M, Nielsen ME, Lotan Y. Bladder cancer. Nat Rev Dis Primers. 2017;3:17022. doi: 10.1038/nrdp.2017.22. - DOI - PubMed
    1. Anderson NM, Simon MC. The tumor microenvironment. Curr Biol. 2020;30:R921–R925. doi: 10.1016/j.cub.2020.06.081. - DOI - PMC - PubMed

Publication types