. 2024 Jan 12;25(1):16.
doi: 10.1186/s13059-023-03149-8.

RNA-binding protein RBM5 plays an essential role in acute myeloid leukemia by activating the oncogenic protein HOXA9

Affiliations

RNA-binding protein RBM5 plays an essential role in acute myeloid leukemia by activating the oncogenic protein HOXA9

Mengli Zhang et al. Genome Biol. .

Abstract

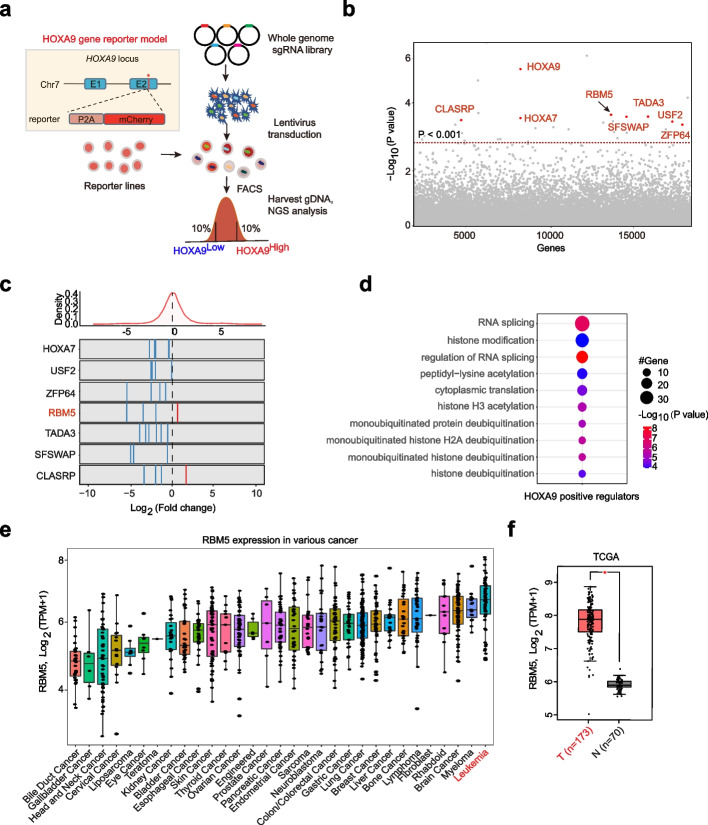
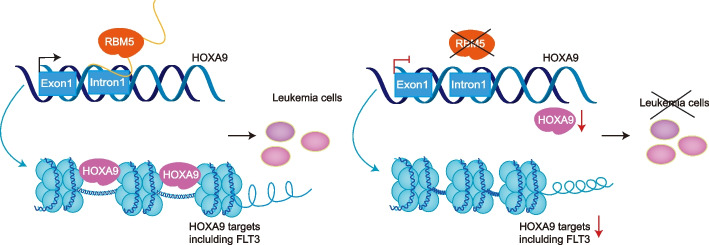
Background: The oncogenic protein HOXA9 plays a critical role in leukemia transformation and maintenance, and its aberrant expression is a hallmark of most aggressive acute leukemia. Although inhibiting the upstream regulators of HOXA9 has been proven as a significant therapeutic intervention, the comprehensive regulation network controlling HOXA9 expression in leukemia has not been systematically investigated.

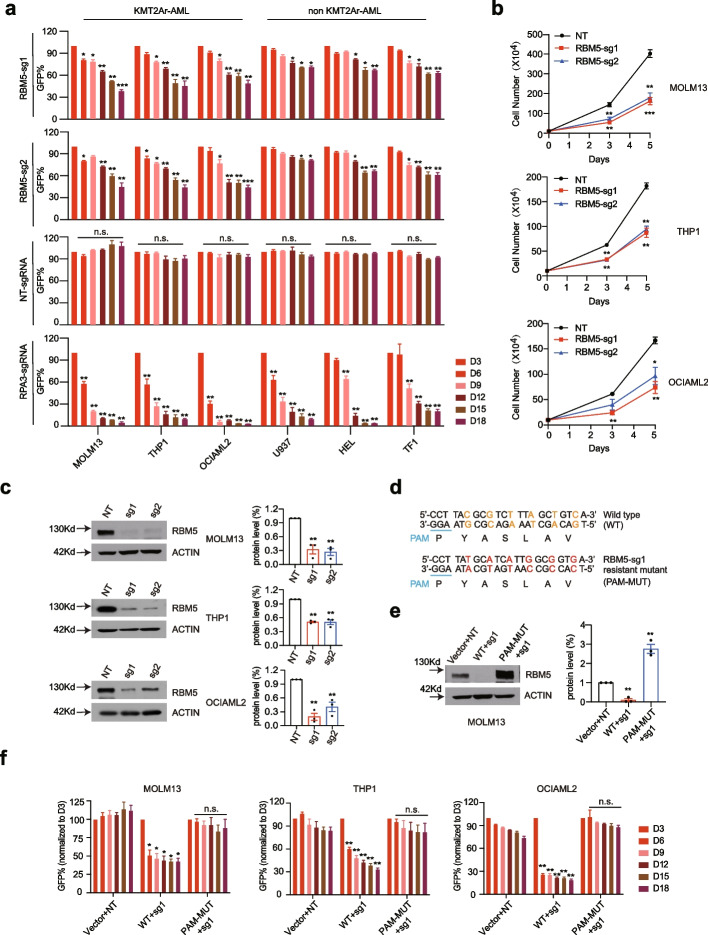
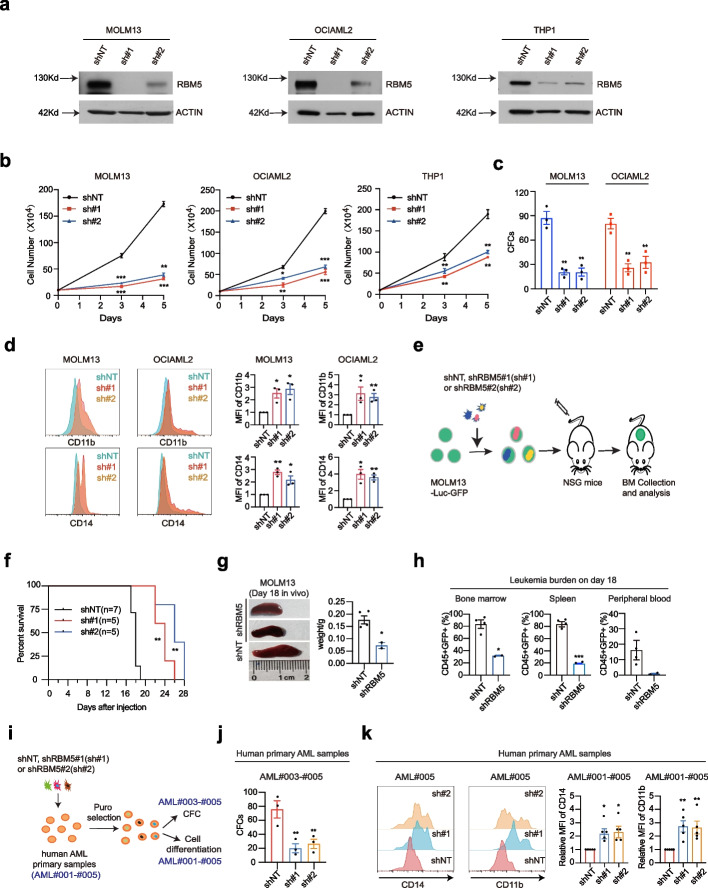
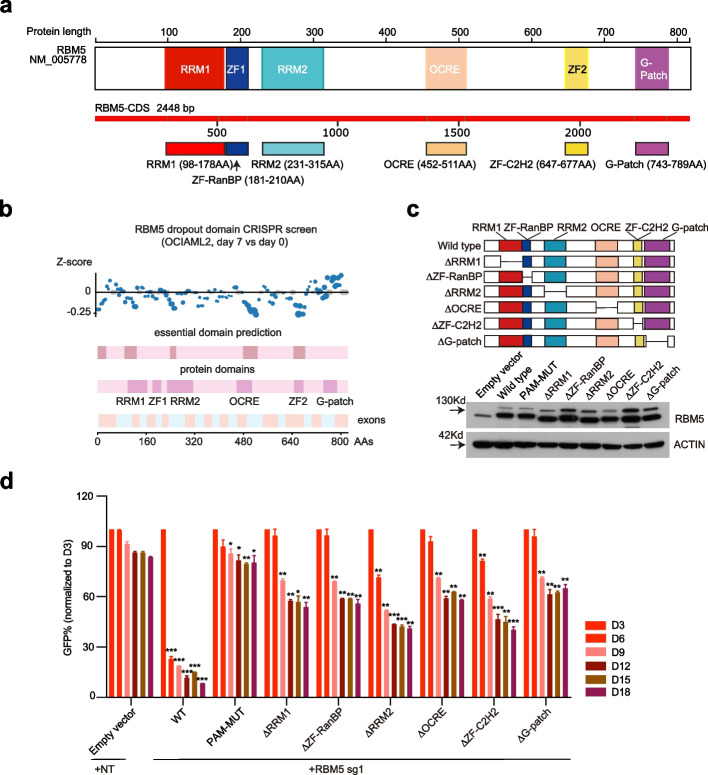
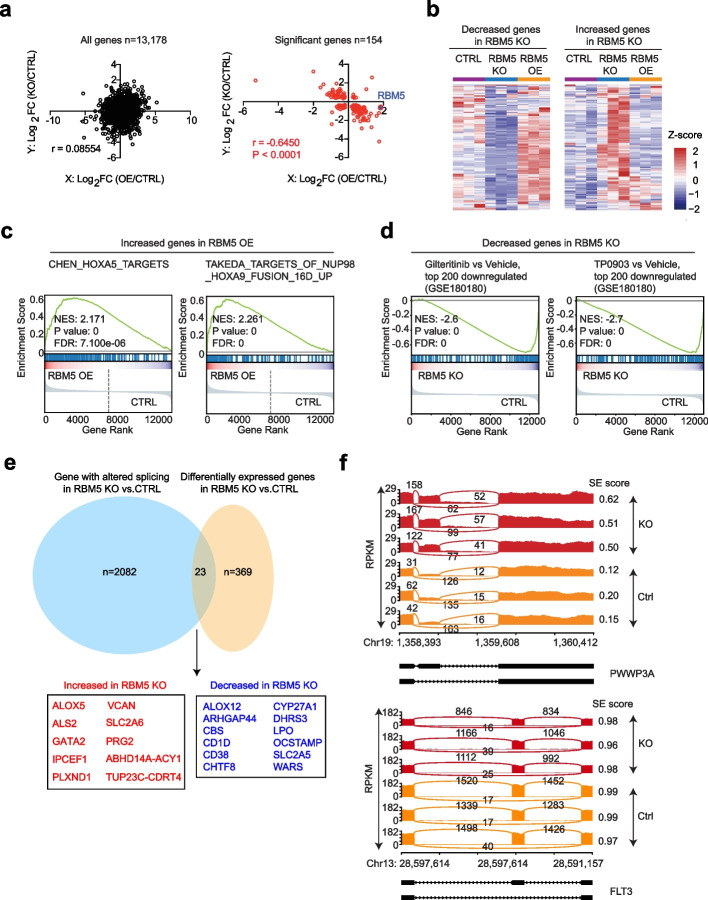
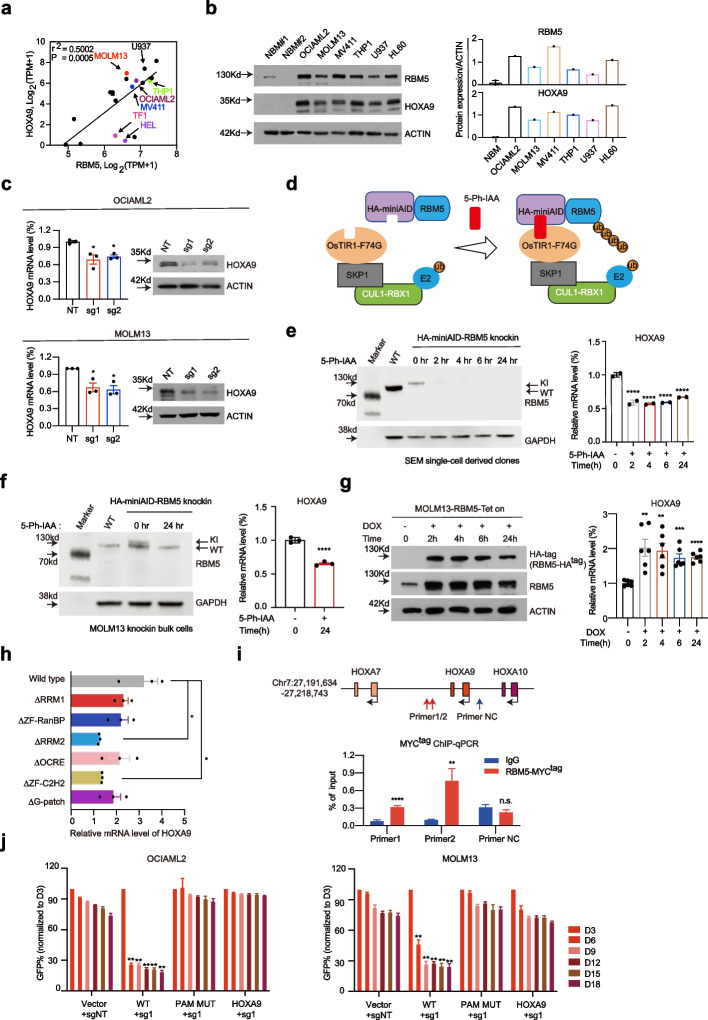
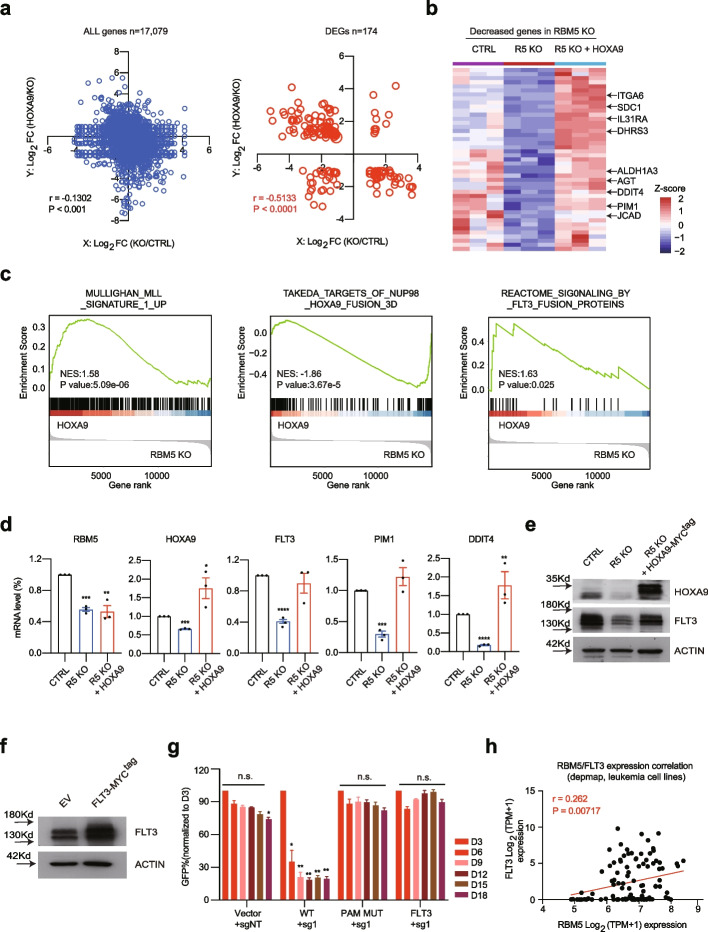
Results: Here, we perform genome-wide CRISPR/Cas9 screening in the HOXA9-driven reporter acute leukemia cells. We identify a poorly characterized RNA-binding protein, RBM5, as the top candidate gene required to maintain leukemia cell fitness. RBM5 is highly overexpressed in acute myeloid leukemia (AML) patients compared to healthy individuals. RBM5 loss triggered by CRISPR knockout and shRNA knockdown significantly impairs leukemia maintenance in vitro and in vivo. Through domain CRISPR screening, we reveal that RBM5 functions through a noncanonical transcriptional regulation circuitry rather than RNA splicing, such an effect depending on DNA-binding domains. By integrative analysis and functional assays, we identify HOXA9 as the downstream target of RBM5. Ectopic expression of HOXA9 rescues impaired leukemia cell proliferation upon RBM5 loss. Importantly, acute protein degradation of RBM5 through auxin-inducible degron system immediately reduces HOXA9 transcription.

Conclusions: We identify RBM5 as a new upstream regulator of HOXA9 and reveal its essential role in controlling the survival of AML. These functional and molecular mechanisms further support RBM5 as a promising therapeutic target for myeloid leukemia treatment.

Keywords: Acute myeloid leukemia; CRISPR screen; Genome editing; HOXA9; RBM5.


Conflict of interest statement

Dr. Chunliang Li is an editorial board member for Genome Biology. The other authors declare that they have no competing interests.

Figures

Fig. 1
Fig. 1
Genome-wide CRISPR/Cas9 screening identifies RNA splicing factor RBM5 as a novel regulator for HOXA9 expression in acute leukemia. a Schematic diagram of a working flow of loss-of-function CRISPR screening targeting whole genome gene. b The whole-genome-wide CRISPR/Cas9 screen results. Bubble plots show the 19,063 genes identified, genes are known to regulate HOXA9 (HOXA9, HOXA7, ZFP64, USF2), and the novel hits RBM5, TADA3, SFSWAP, and CLASRP are highlighted in red. The P-values were calculated using the RSA algorithm. c The count ratio for all sgRNAs targeting the HOXA7, USF2, ZFP64, RBM5, TADA3, SFSWAP, and CLASRP is shown between HOXA9High and HOXA9Low sorted populations. The DEseq2 score of each gene was calculated by Log2[fold change (HOXA9High/HOXA9Low)]. d Gene Ontology (GO) analysis was performed on the significant genes that positively regulate HOXA9 expression from the screening results. e RBM5 mRNA expression level in various cancer cell types from CCLE (Cancer Cell Line Encyclopedia). TPM, transcripts per million. T, tumor/cancer. f Box plot comparing the RBM5 mRNA expression level between AML samples (from TCGA dataset) and matched normal samples (from TCGA and GTEx projects). The plot is drawn by using the GEPIA online server. TPM, transcripts per million. T, tumor/cancer. N, normal bone marrow. *P < 0.05, unpaired Student’s t-test
Fig. 2
Fig. 2
Disruption of RBM5 delays the growth of leukemia cells in vitro. a Competitive proliferation assay (CPA) was conducted in Cas9 stably expressed AML cells lines, including MOLM13, THP1, OCIAML2, U937, HEL, and TF1 after transduced with GFP reporter-based lentiviral sgRNAs (NT, RPA3, RBM5-sg1, RBM5-sg2) at about ~ 50% efficiency. The GFP% was quantified at days 3, 6, 9, 12, 15, and 18 by flow cytometry to evaluate the growth disadvantage. The guide RNA targeting the survival essential gene RPA3 was included as a positive control, and the guide RNA targeting the non-target (NT) gene was included as a negative control. Data shown are means ± SEM from three independent experiments. *P < 0.05, **P < 0.01, ***P < 0.001, unpaired Student’s t-test. b The proliferation ability of AML cells was monitored by cell counting assay in MOLM13, THP1, and OCIAML2 with stably expressed Cas9 after transduced by two respective sgRNAs targeting RBM5 (RBM5-sg1, sg2) and one non-targeting sgRNA. The guide RNA targeting non-target gene (NT) was used as a negative control. Data shown are means ± SEM from three independent experiments. *P < 0.05, **P < 0.01, ***P < 0.001, unpaired Student’s t-test. c Immunoblotting of RBM5 in RBM5 sgRNAs targeted cells. The bands were scanned and statistically analyzed. Data shown are means ± SEM from three independent experiments. *P < 0.05, **P < 0.01, ***P < 0.001, unpaired Student’s t-test. The β-ACTIN was used as a reference. d Schematic diagram of the sgRNA-resistant cDNA mutagenesis. The 22 bp DNA sequence and corresponding amino acids close to the sgRNA PAM region (blue) in RBM5 wild-type (WT) and RBM5-sg1-resistant mutant (PAM-MUT) cDNA are shown with the non-sensed mutated nucleotides highlighted in different colors (red and orange). e Immunoblotting was conducted by infecting MOLM13 cells overexpressing ectopic Venus empty vector, RBM5-wild-type cDNA (WT), RBM5-sgRNA1-resistant mutant cDNA (PAM-MUT) with lentiviral-sgRNAs against non-target gene (NT), and RBM5 (RBM5-sg1), and the bands were scanned and statistically analyzed. Data shown are means ± SEM from three independent experiments. *P < 0.05, **P < 0.01, ***P < 0.001, unpaired Student’s t-test. The β-ACTIN was used as a reference. f Competition-based proliferation assays comparing the impact of sgRNAs on MOLM13, THP1, and OCIAML2 cell fitness, in the context of co-transduction with Venus empty vector control, RBM5-wild-type cDNA (WT), RBM5-sgRNA1-resistant mutant cDNA (PAM-MUT) (all monitored by Venus reporter). Data shown are means ± SEM from three independent experiments. *P < 0.05, **P < 0.01, ***P < 0.001, unpaired Student’s t-test
Fig. 3
Fig. 3
RBM5 knockdown impairs in vivo myeloid leukemia engraftment. a Western blot of RBM5 expression in MOLM13, OCIAML2, and THP1 cells after transduced with shNT (non-targeting control), sh#1 (shRBM5#1), and sh#2 (shRBM5#2) 6-day post-viral transduction. The β-ACTIN was used as a reference. b Cell counting assay was conducted on the sh#1, sh#2, and shNT targeted MOLM13, OCIAML2, and THP1 to monitor the ability of proliferation of AML cells. shNT was used as a negative control. Data shown are means ± SEM from three independent experiments. *P < 0.05, **P < 0.01, ***P < 0.001, unpaired Student’s t-test. c Count of colonies formed by 300 MOLM13 and 500 OCIAML2 cells after shNT, sh#1, and sh#2 transduction. Data shown are means ± SEM from three independent experiments. **P < 0.01, unpaired Student’s t-test. d Surface expression of CD11b and CD14 after lentiviral transduction of shRNA against control shNT and shRNAs targeting RBM5 (sh#1 and sh#2) in MOLM13 and OCIAML2 cells. MFI, mean fluorescence intensity. *P < 0.05, **P < 0.01, unpaired Student’s t-test. e Schematic of in vivo transplantation of MOLM13-Luc-GFP cells infected with control shNT and shRNAs targeting RBM5 (sh#1 and sh#2). f Kaplan–Meier survival curves of recipient mice transplanted with MOLM13 cells transduced with shNT (n = 7), sh#1 (n = 5), and sh#2 (n = 5). The P-value was determined by a log-rank Mantel-Cox test. **P < 0.01. g The spleens of mice in the shNT (n = 4) and shRBM5 (n = 2, merged sh#1 and sh#2) groups were photographed and weighed 18-day post-transplantation. *P < 0.05, unpaired Student’s t-test. h Flow cytometry analysis of the percentage of human CD45+ and GFP+ leukemia cells in bone marrow, spleen, and peripheral blood of recipient mice in the shNT (n = 4) and shRBM5 (n = 2) groups sacrificed after 18-day post-transplantation. Statistical analysis (P-value) was performed using an unpaired Student’s t-test. *P < 0.05, ***P < 0.001. i Schematic diagram of the AML primary sample for CFC and cell differentiation assay. j Count of colonies formed by human primary AML cells after shNT, sh#1(shRBM5#1), and sh#2(shRBM5#2) transduction. **P < 0.01, unpaired Student’s t-test. k Representative flow cytometry analysis of myeloid differentiation marker (CD14 and CD11b), in which AML primary samples were treated with lentiviral transduction of shRNA against control gene (shNT) and shRNAs targeting RBM5 (sh#1 and sh#2). MFI, mean fluorescence intensity. *P < 0.05, **P < 0.01, unpaired Student’s t-test
Fig. 4
Fig. 4
RRM and zinc finger domains of RBM5 are essential in AML. a RBM5 protein structure. The illustration shows the major canonical functional domains in the human RBM5 protein. The amino acid distance spanning each functional domain is indicated in the colorful pane below. RNA recognition domain (RRM), zinc-finger domain (ZF), octamer repeat (OCRE) domain, glycine-rich region (G-patch) domain. b CRISPR dropout screen by tilling the sgRNAs targeting the RBM5 exons in OCIAML2 cells at day 7. The known protein domains (including RRM1, RRM2, ZF-RanBP, ZF-C2H2, OCRE, and G-patch) were highlighted in purple boxes, while the predicted essential domains were highlighted in brown boxes. The Z-score was calculated based on the average count of all sgRNAs targeting a 10-kb window in the genome. c Western blot analysis was conducted in OCIAML2 cells transduced with RBM5 cDNA wild-type (WT) or individual mutant (upper panel) to validate the expression of RBM5 (lower panel). The β-ACTIN was used as a reference. d Competition-based proliferation assay in OCIAML2 expressing the indicated individual RBM5 truncated mutant cDNAs, RBM5-wild-type cDNA (WT), RBM5-sgRNA1-resistant mutant cDNA (PAM-MUT), and empty vector (all monitored by Venus reporter), followed by transduction with RBM5 sg1 or non-targeted sgRNA (NT). Data shown are means ± SEM from three independent experiments. *P < 0.05, **P < 0.01, unpaired Student’s t-test
Fig. 5
Fig. 5
Identification of RBM5 downstream target genes in AML. a The transcriptome analysis in three groups of MOLM13 cells, including the CTRL group (control cells with NT sgRNA treated), RBM5 KO group (RBM5 knockout cells with RBM5-sg1 treated), and RBM5 OE group (RBM5 overexpressed cells by lentiviral RBM5-P2A-venus vector). Each group was performed with three biological replicates. Integrated scatter plot analysis for all genes from the RNA-seq dataset by comparing RBM5 OE vs. CTRL and RBM5 KO vs. CTRL in MOLM13 cells (left panel) (n = 13,178). The graph on the right panel shows the significant genes (n = 154). False discovery rate [FDR] < 0.05. b Heat map showing filtered genes whose expression is significantly differentially expressed after RBM5 loss in three groups of MOLM13 cells, including the CTRL, RBM5 KO, and RBM5 OE. c Leading edge plot from gene enrichment analysis (GSEA) showing the enrichment of indicated pathway for genes in RBM5 OE compared to control. Enrichment scores, P-values, and FDR (false-discovery rate) are calculated as shown in the plot. d Leading edge plot from gene enrichment analysis (GSEA) showing the enrichment of indicated pathway for the decreased genes in RBM5 KO cells relative to control. Enrichment scores, P-values, and FDR (false-discovery rate) are calculated as shown in the plot. e Venn diagram showing the overlap between genes differentially expressed and genes undergoing altered splicing events after RBM5 knockout (from RNA-seq). f Sashimi plots the example gene PWWP3A and FLT3 in RBM5 KO and CTRL group in MOLM13 cells
Fig. 6
Fig. 6
HOXA9 is a functional target gene of RBM5 in AML. a Scatter plot analysis comparing RBM5 mRNA levels and HOXA9 mRNA levels across acute myeloid leukemia cell lines (data was obtained from the Depmap). P-value is calculated by linear regression. b Immunoblotting of RBM5 and HOXA9 in various leukemia cell lines and normal bone marrow (NBM) samples (left panel). The bar chart displays the quantitative protein levels of RBM5 and HOXA9 in various cell lines depicted in the left panel (right panel). c Real-time-qPCR and immunoblotting analysis was conducted on the RBM5-sg1, RBM5-sg2, and sgNT targeted MOLM13 and OCIAML2 to monitor the expression of HOXA9. Data shown are means ± SEM from three independent experiments. *P < 0.05, unpaired Student’s t-test. d Diagram of auxin-induced degron (AID) system to degrade endogenous RBM5. Endogenous RBM5 N-terminus AID knock-in KMT2A-r leukemia lines (SEM homozygous clones and MOLM13 bulk cells) were followed by constitutively expressing OsTIR1(F74G). With the presence of small molecule 5-Ph-IAA, the OsTIR1(F74G), as a substrate receptor in Skp1, Cullin, and F-box (SCF) complex, could target and mediate specific AID-tagged RBM5 proteins for ubiquitination and degradation. e The protein level of endogenous HA-miniAID-RBM5 of SEM homozygous clones can be acutely degraded with 5-Ph-IAA through degron-mediated proteasome degradation after 2-h post-treatment (left panel). HOXA9 mRNA level was significantly reduced after 2 h, 4 h, 6 h, and 24 h of treatment in SEM cells (right panel). f After 24 h of treatment with 5-Ph-IAA in HA-miniAID-RBM5 knock-in MOLM13 cells, the protein level of HA-miniAID-RBM5 decreased (left panel), and there was also a significant reduction in HOXA9 mRNA level (right panel). g The doxycycline-Tet-On system for ectopic overexpression of RBM5-HA in the MOLM13 cell line, after a 2-h treatment with doxycycline, a significant upregulation in HOXA9 mRNA levels was observed (right panel), accompanied by an increase in RBM5 expression (left panel). h Real-time-qPCR analysis was conducted in OCIAML2 cells transduced with RBM5 cDNA wild-type (WT) or six individual truncated mutants to validate the expression of HOXA9. Data shown are means ± SEM from three independent experiments. *P < 0.05, unpaired Student’s t-test. i ChIP-qPCR with anti-MYC tag antibody near H3K4me3-bound HOXA9 downstream region (Chr7:27,199,969–27,200,853) in OCIAML2-RBM5-MYCtag cells (n = 3). The red arrows indicate the primer 1 and primer 2 located position, and the blue arrow indicates the negative control (NC) primer located position, where there is no H3K4me3 signal. Statistical analysis (P-value) was performed using an unpaired Student’s t-test. All error bars represent mean ± SEM. j Rescued competitive proliferation assay was conducted by infecting OCIAML2-Cas9 and MOLM13-Cas9 cells overexpressing ectopic RBM5-wild-type cDNA (WT), RBM5-sgRNA1-resistant mutant cDNA (PAM-MUT), and HOXA9 cDNA (linked to Venus reporter) with lentiviral-sgRNAs against non-target (sgNT) and RBM5 (RBM5-sg1) at about 50% efficiency (all monitored by Venus reporter). Data shown are means ± SEM from three independent experiments. **P < 0.01, unpaired Student’s t-test
Fig. 7
Fig. 7
HOXA9 partially restores the gene transcriptional defect in RBM5 null leukemia cells. a Integrated scatter plot analysis for all genes (P < 0.05) from the RNA-seq dataset by comparing HOXA9 vs. RBM5 KO and RBM5 KO vs. CTRL in MOLM13 cells (left panel) (n = 17,079). The graph at the right shows the differentially expressed genes (DEG) in RBM5 KO vs. CTRL (n = 174). False discovery rate [FDR] < 0.05. Pearson r and P-value are calculated by correlation. b Heat map of RNA-seq analysis shows the decreased genes after RBM5 loss respectively in CTRL, RBM5 KO, and RBM5 KO with HOXA9 overexpression groups. c Enrichment of target genes involved in MLL signature genes, NUP98-HOXA9 and FLT3 targets for the increased genes in RBM5 KO cells with HOXA9 overexpression relative to control, as shown by GSEA. d. Real-time-qPCR analysis was performed on samples of CTRL, RBM5 KO (R5 KO), and RBM5 KO MOLM13 cells with HOXA9 cDNA transduction (R5 KO + HOXA9) to validate the expression of RBM5, HOXA9, FLT3, PIM1, and DDIT4 genes. Data shown are means ± SEM from three independent experiments. ***P < 0.001, ****P < 0.0001, unpaired Student’s t-test. e Western blot of HOXA9 and FLT3 were performed on samples of CTRL, R5 KO, and RBM5 KO MOLM13 cells with HOXA9 cDNA transduction (R5 KO + HOXA9). The β-ACTIN was used as a reference. f Immunoblotting was conducted by infecting OCIAML2 cells overexpressing ectopic Venus empty vector and FLT3 cDNA. The β-ACTIN was used as a reference. g Rescued competitive proliferation assay was conducted by infecting OCIAML2-Cas9 cells overexpressing ectopic RBM5-wild-type cDNA (WT), RBM5-sgRNA1-resistant mutant cDNA (PAM-MUT), and FLT3 cDNA (linked to Venus reporter) with lentiviral-sgRNAs against non-target (sgNT) and RBM5 (RBM5-sg1) at about 50% efficiency (all monitored by Venus reporter). Data shown are means ± SEM from three independent experiments. **P < 0.01, unpaired Student’s t-test. h Scatter plot analysis comparing RBM5 mRNA levels and FLT3 mRNA levels across leukemia cell lines (data was obtained from the DepMap). P-value is calculated by linear regression
Fig. 8
Fig. 8
Model for the new regulatory axis RBM5-HOXA9 in AML. RBM5 directly regulates the transcriptional activity of the HOXA9 locus, which maintains proper downstream signaling transduction, including the FLT3-responsive targets in acute myeloid leukemia cells

Similar articles

References

    1. Kantarjian H, Kadia T, DiNardo C, Daver N, Borthakur G, Jabbour E, et al. Acute myeloid leukemia: current progress and future directions. Blood Cancer J. 2021;11:41. doi: 10.1038/s41408-021-00425-3. - DOI - PMC - PubMed
    1. Short NJ, Rytting ME, Cortes JE. Acute myeloid leukaemia. Lancet. 2018;392:593–606. doi: 10.1016/S0140-6736(18)31041-9. - DOI - PMC - PubMed
    1. Baccelli I, Gareau Y, Lehnertz B, Gingras S, Spinella J-F, Corneau S, et al. Mubritinib targets the electron transport chain complex I and reveals the landscape of OXPHOS dependency in acute myeloid leukemia. Cancer Cell. 2019;36:84–99.e8. doi: 10.1016/j.ccell.2019.06.003. - DOI - PubMed
    1. Lambert M, Alioui M, Jambon S, Depauw S, Van Seuningen I, David-Cordonnier MH. Direct and indirect targeting of HOXA9 transcription factor in acute myeloid leukemia. Cancers (Basel). 2019;11:837. doi: 10.3390/cancers11060837. - DOI - PMC - PubMed
    1. Collins CT, Hess JL. Deregulation of the HOXA9/MEIS1 axis in acute leukemia. Curr Opin Hematol. 2016;23:354–361. doi: 10.1097/MOH.0000000000000245. - DOI - PMC - PubMed

Publication types

MeSH terms