. 2024 Jan 12;16(1):11.
doi: 10.1186/s13073-024-01286-8.

Genomic and transcriptomic analysis of breast cancer identifies novel signatures associated with response to neoadjuvant chemotherapy

Affiliations

Genomic and transcriptomic analysis of breast cancer identifies novel signatures associated with response to neoadjuvant chemotherapy

Gengshen Yin et al. Genome Med. .

Abstract

Background: Neoadjuvant chemotherapy (NAC) has become a standard treatment strategy for breast cancer (BC). However, owing to the high heterogeneity of these tumors, it is unclear which patient population most likely benefit from NAC. Multi-omics offer an improved approach to uncovering genomic and transcriptomic changes before and after NAC in BC and to identifying molecular features associated with NAC sensitivity.

Methods: We performed whole-exome and RNA sequencing on 233 samples (including matched pre- and post-treatment tumors) from 50 BC patients with rigorously defined responses to NAC and analyzed changes in the multi-omics landscape. Molecular features associated with NAC response were identified and validated in a larger internal, and two external validation cohorts, as well as in vitro experiments.

Results: The most frequently altered genes were TP53, TTN, and MUC16 in both pre- and post-treatment tumors. In comparison with pre-treatment tumors, there was a significant decrease in C > A transversion mutations in post-treatment tumors (P = 0.020). NAC significantly decreased the mutation rate (P = 0.006) of the DNA repair pathway and gene expression levels (FDR = 0.007) in this pathway. NAC also significantly changed the expression level of immune checkpoint genes and the abundance of tumor-infiltrating immune and stroma cells, including B cells, activated dendritic cells, γδT cells, M2 macrophages and endothelial cells. Furthermore, there was a higher rate of C > T substitutions in NAC nonresponsive tumors than responsive ones, especially when the substitution site was flanked by C and G. Importantly, there was a unique amplified region at 8p11.23 (containing ADGRA2 and ADRB3) and a deleted region at 3p13 (harboring FOXP1) in NAC nonresponsive and responsive tumors, respectively. Particularly, the CDKAL1 missense variant P409L (p.Pro409Leu, c.1226C > T) decreased BC cell sensitivity to docetaxel, and ADGRA2 or ADRB3 gene amplifications were associated with worse NAC response and poor prognosis in BC patients.

Conclusions: Our study has revealed genomic and transcriptomic landscape changes following NAC in BC, and identified novel biomarkers (CDKAL1P409L, ADGRA2 and ADRB3) underlying chemotherapy resistance and poor prognosis, which could guide the development of personalized treatments for BC.

Keywords: Breast cancer; Genomic; Neoadjuvant chemotherapy; Pathological response; Prognosis; Transcriptomic.


Conflict of interest statement

The authors declare that they have no competing interests.

Figures

Fig. 1
Fig. 1
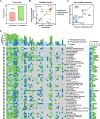
Study overview. A A schematic diagram of sample collection in the context of neoadjuvant chemotherapy (NAC), followed by whole exome sequencing (WES), RNA sequencing (RNA-seq), and data analyses. B The final number of samples in the NACBC sequencing set for analysis. All samples were acquired from 50 patients. In the pre-treatment group, there were 47 tumor samples for WES and 50 for RNA-seq. In the post-treatment group, there were 44 tumor samples for WES and 45 for RNA-seq. C Representative pathological images of tumors by hematoxylin–eosin staining from the responsive, middle responsive, and nonresponsive patients. Bar, 250 μm. D The distribution of patients with different Miller–Payne scores in the responsive, middle responsive, and nonresponsive groups
Fig. 2
Fig. 2
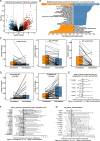
Changes in gene mutation, mutation burden, and the MSigDB pathway between the paired pre- and post-treatment tumor samples. Comparison of tumor purity (A) and mutation burden (B) between the 44 paired pre- and post-treatment tumors. P values are calculated based on the Wilcoxon signed-rank test. C The most frequently mutated genes before and after NAC. D Mutations associated with the MSigDB pathway in the pre- and post-treatment tumors. Bars on the top indicate the number of pathways affected in a given patient, and colored bars indicate if the variant was only found in the pre- or post-treatment tumors, or shared in both. P values in panels C and D are calculated based on the Pearson’s chi-square test; **P < 0.01, *P < 0.05
Fig. 3
Fig. 3
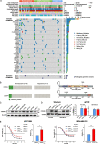
Changes in gene expression, tumor-infiltrating immune and stromal cell composition following NAC. A Volcano plots showing differentially expressed genes (DEGs) between the matched pre- and post-treatment tumors. Significant DEGs are shown as red (upregulated) and blue (downregulated) dots (fold change > 2, FDR < 0.05). B Significantly down­ and up-regulated pathways following NAC (FDR < 0.01). C, D The fractions of B cell, M2 macrophage, activated dendritic cell (aDC), endothelial cell, and gamma delta T (γδT) cell in the pre- and post-treatment tumors. P values are calculated based on the Wilcoxon signed-rank test. EG The expression of DEGs was significantly related to positive regulations of γδT cell activation (E), antigen processing and presentation (F), and angiogenesis (G) between the pre- and post-treatment tumors. Values are presented as paired fold changes of post-/pre-treatment. P values were calculated by the Wilcoxon signed-rank test. ***P < 0.001, **P < 0.01, *P < 0.05
Fig. 4
Fig. 4
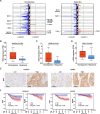
Mutation signatures in the pre-treatment tumors. Comparison of tumor mutation burden (A) and nucleotide substitutions (B) between the nonresponsive and responsive groups. C Distributions of the 10 main COSMIC signatures in the different NAC responsive groups across the 47 pre-treatment samples (left). Comparison of the relative weights of the signature 3 between the nonresponsive and responsive groups (right). D Heatmap comparison of the 22 genes statistically significantly related to the DNA repair pathway between the responsive and nonresponsive pre-treatment tumors. P values were calculated based on the Wilcoxon rank sum test. ***P < 0.001, **P < 0.01, *P < 0.05
Fig. 5
Fig. 5
CDKAL1P409L mutation decreased the sensitivity of cancer cells to docetaxel treatment. A Somatic and germline mutations in the 47 pre-treatment tumors and matched germline DNA. Samples were annotated for clinicopathological and molecular features (top panel). The types of somatic (middle panel) and germline (bottom panel) mutations of the indicated genes for each sample are displayed with colored squares. The histograms on the right-hand side show the accumulated number of alterations among the SMGs identified by the MuSiC2 (FDR < 0.1) or the pathogenic germline mutations classified in the ClinVar database. AJCC, The American Joint Committee on Cancer. B The distribution of potentially deleterious mutations in CDKAL1 and CENPT in the nonresponsive and responsive pre-treatment groups (left). Diagrams representing the protein domains of potentially deleterious mutations (right). The “lollipopPlots” were generated using the maftools R package and manually edited. C The CDKAL1 expression in different human breast cancer cell lines as indicated was examined by western blot. D The expression of CDKAL1WT and CDKAL1P409L in HCC1806 and MDA-MB-231 cells infected with empty vector, CDKAL1WT and CDKAL1P409L lentiviruses by western blot and quantitative real-time PCR (qPCR) analyses. E IC50 assays of docetaxel. The proliferation of HCC1806 and MDA-MB-231 cells as described in (D) were determined with a CCK-8 cell counting kit at an increasing dose of docetaxel as indicated. The significance of relative IC50 values between CDKAL1WT and CDKAL1P409L cells with that of CDKAL1WT cells as 1.0 were analyzed by paired t-test. Data represent mean ± SD (n = 3). *, P < 0.05; **, P < 0.01
Fig. 6
Fig. 6
High ADGRA2 or ADRB3 expression is associated with worse NAC response and prognosis of BC patients. A The SCNA signal profiles identified by the GISTIC2.0 in the nonresponsive and responsive pre-treatment tumors. The significantly altered chromosome regions (q < 0.01) and the gene loci (ADGRA2, ADRB3 and FOXP1) are annotated. The mRNA expression level of ADGRA2 (B), ADRB3 (C), and FOXP1 (D) in the nonresponsive and responsive pre-treatment tumors from the RNA-seq data were shown as transcripts per million (TPM). E Representative immunohistochemistry staining of tumors with low and high expression of ADGRA2 and ADRB3 in the NACBC validation set (n = 156). Magnification: 400 × ; Bar, 100 μm. F Kaplan–Meier analyses of the DFS and BCSS in the NACBC validation set. Patients were stratified as high and low protein expression of ADGRA2 and ADRB3. P values were calculated based on the log-rank test

References

    1. Sung H, Ferlay J, Siegel RL, Laversanne M, Soerjomataram I, Jemal A, et al. Global Cancer Statistics 2020: GLOBOCAN Estimates of Incidence and Mortality Worldwide for 36 Cancers in 185 Countries. CA Cancer J Clin. 2021;71(3):209–49. doi: 10.3322/caac.21660. - DOI - PubMed
    1. Cortazar P, Zhang L, Untch M, Mehta K, Costantino JP, Wolmark N, et al. Pathological complete response and long-term clinical benefit in breast cancer: the CTNeoBC pooled analysis. Lancet. 2014;384(9938):164–72. doi: 10.1016/S0140-6736(13)62422-8. - DOI - PubMed
    1. Pusztai L, Foldi J, Dhawan A, DiGiovanna MP, Mamounas EP. Changing frameworks in treatment sequencing of triple-negative and HER2-positive, early-stage breast cancers. Lancet Oncol. 2019;20(7):e390–390e396. 10.1016/S1470-2045(19)30158-5. - PubMed
    1. Fisher B, Bryant J, Wolmark N, Mamounas E, Brown A, Fisher ER, et al. Effect of preoperative chemotherapy on the outcome of women with operable breast cancer. J Clin Oncol. 1998;16(8):2672–85. doi: 10.1200/JCO.1998.16.8.2672. - DOI - PubMed
    1. Spring L, Greenup R, Niemierko A, Schapira L, Haddad S, Jimenez R, et al. Pathologic complete response after neoadjuvant chemotherapy and long-term outcomes among young women with breast cancer. J Natl Compr Canc Netw. 2017;15(10):1216–23. doi: 10.6004/jnccn.2017.0158. - DOI - PubMed

Publication types