. 2024 Jan 12;16(1):872-910.
doi: 10.18632/aging.205426. Epub 2024 Jan 12.

XRCC1: a potential prognostic and immunological biomarker in LGG based on systematic pan-cancer analysis

Affiliations

XRCC1: a potential prognostic and immunological biomarker in LGG based on systematic pan-cancer analysis

Guobing Wang et al. Aging (Albany NY). .

Abstract

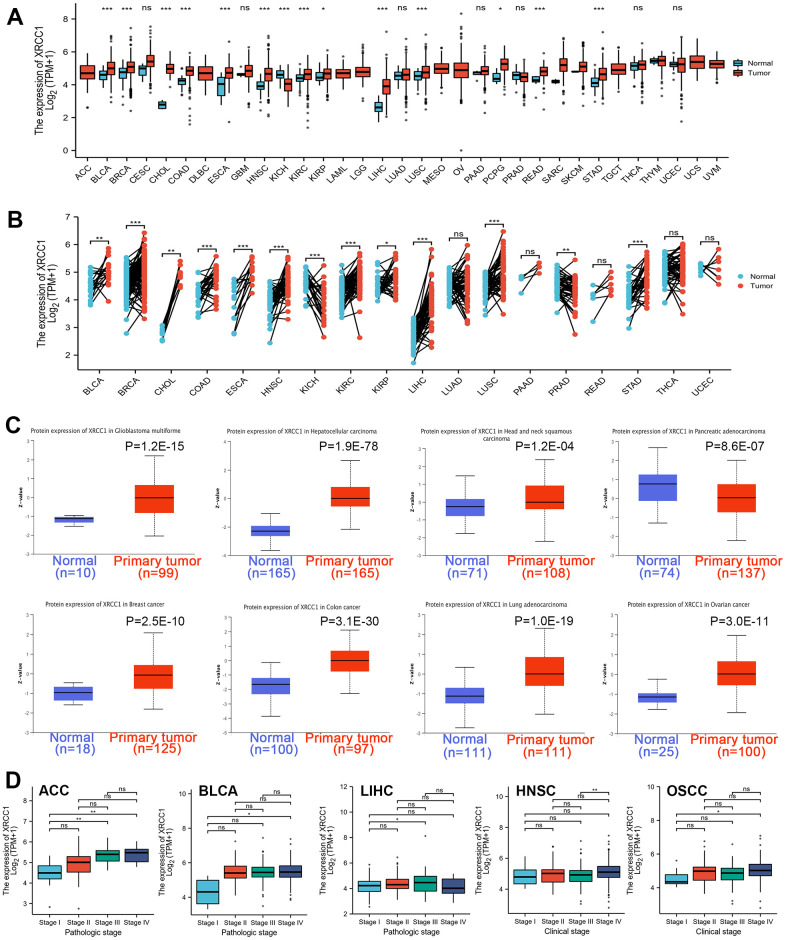
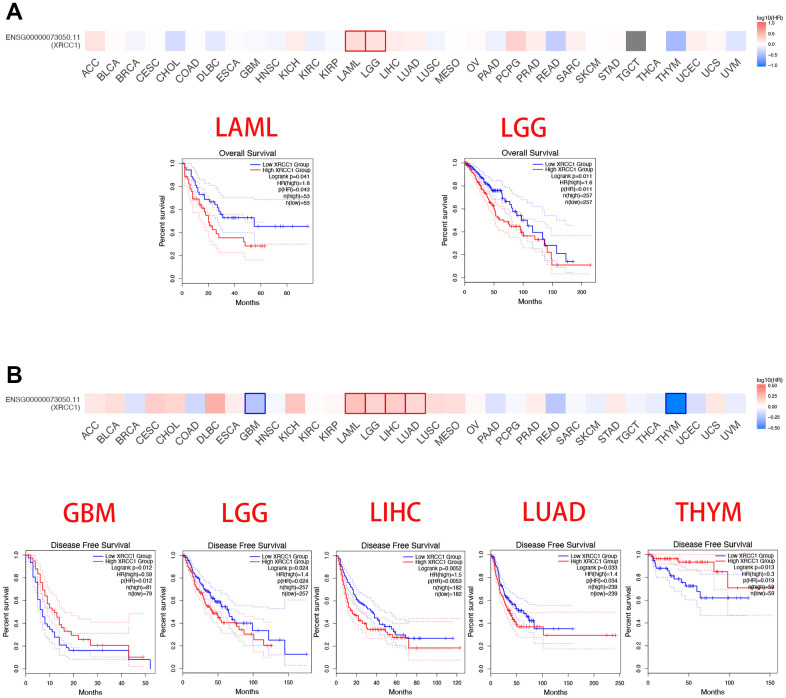
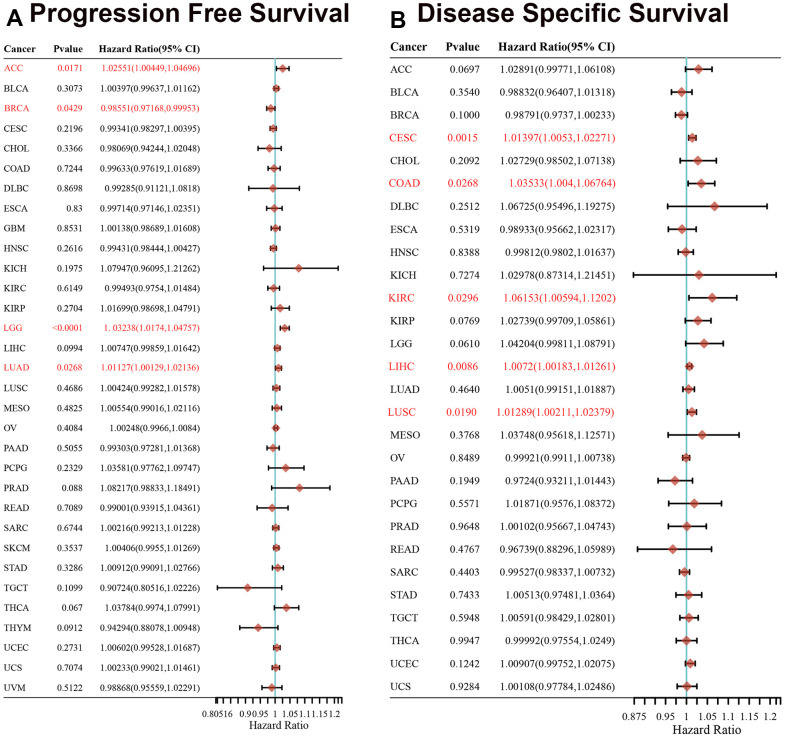
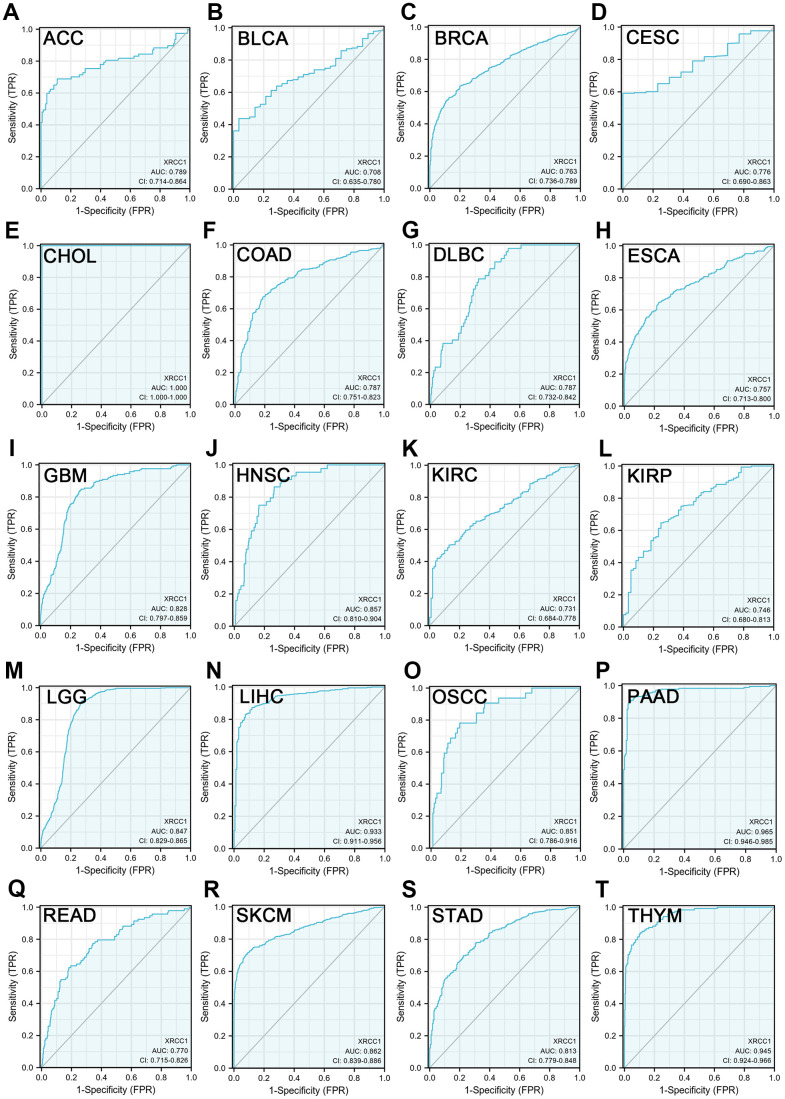
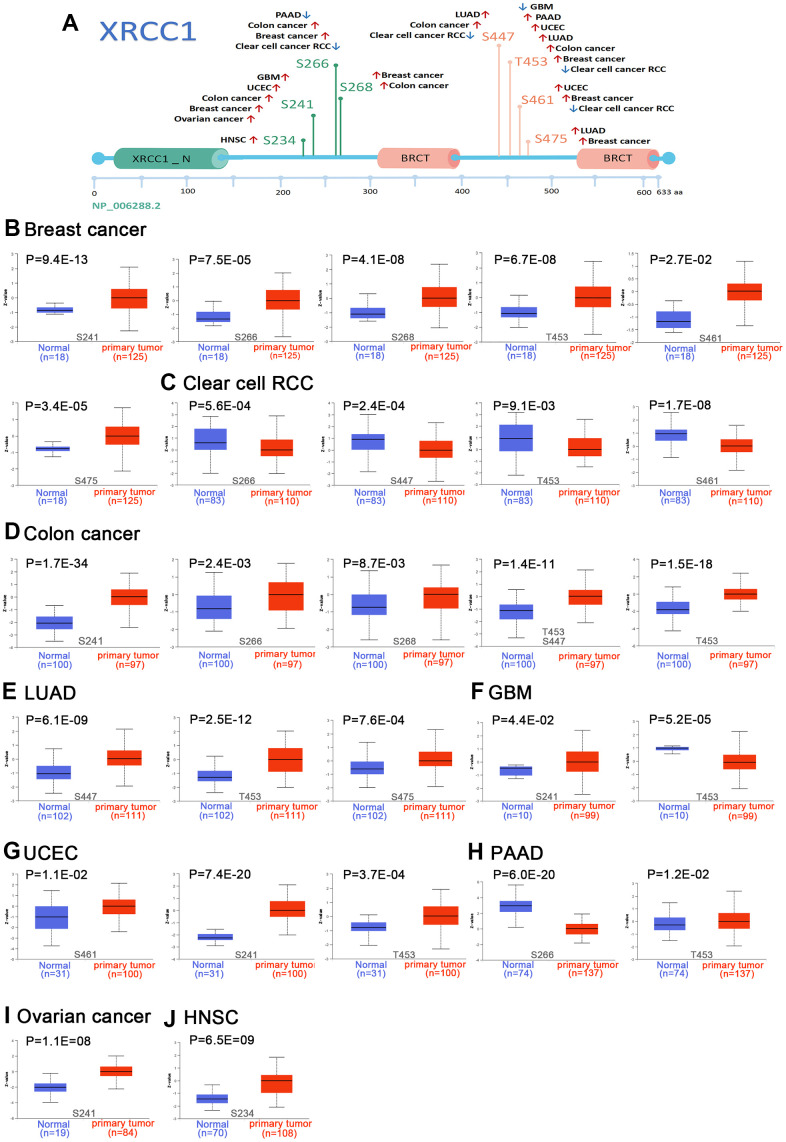
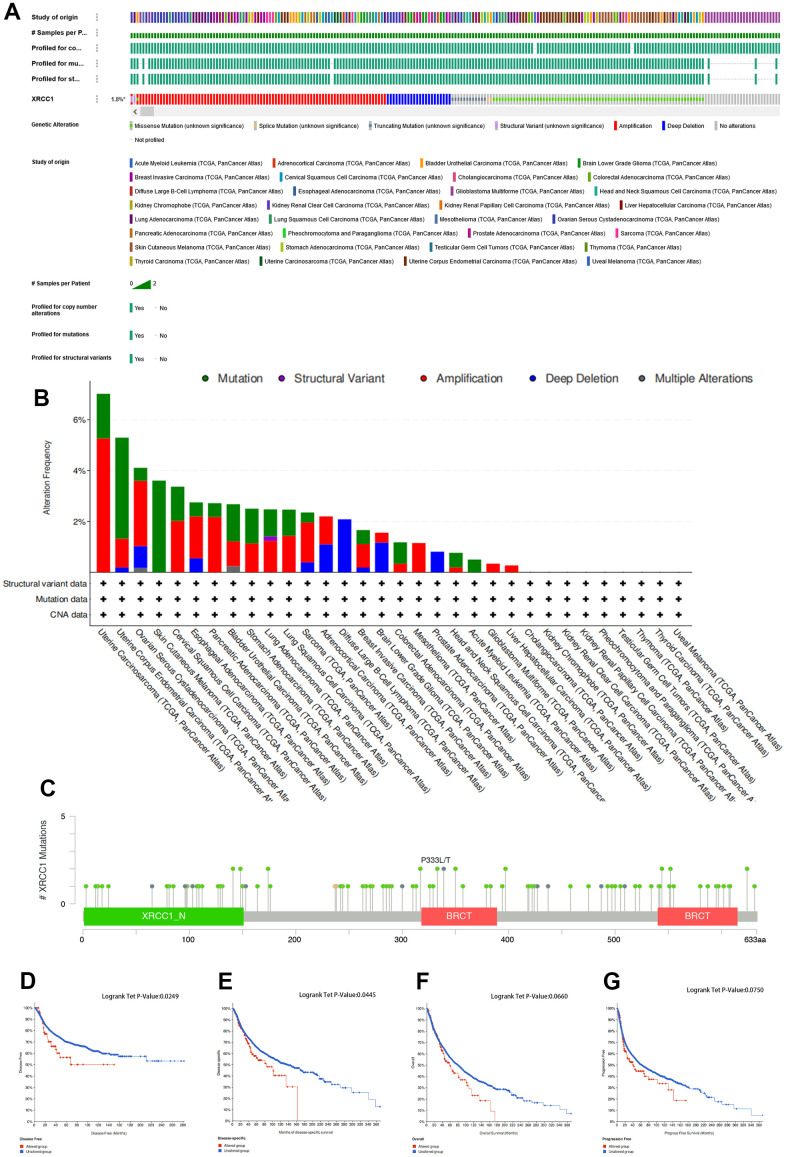
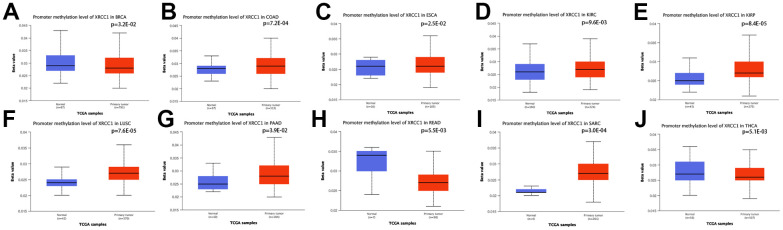
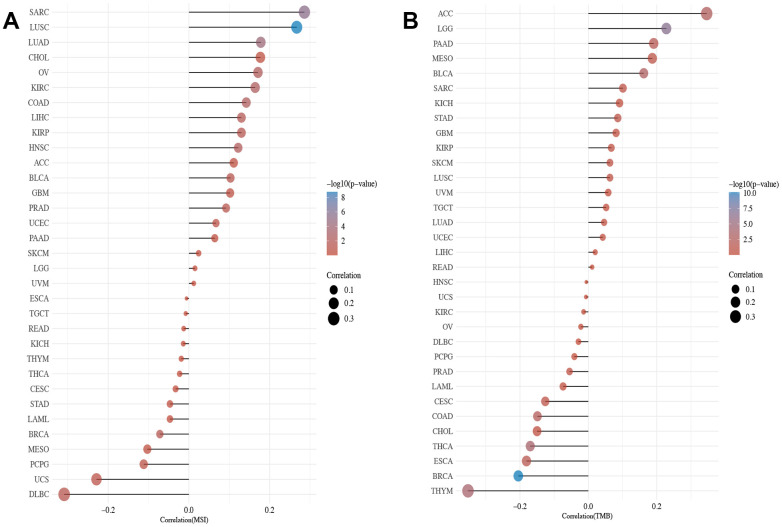
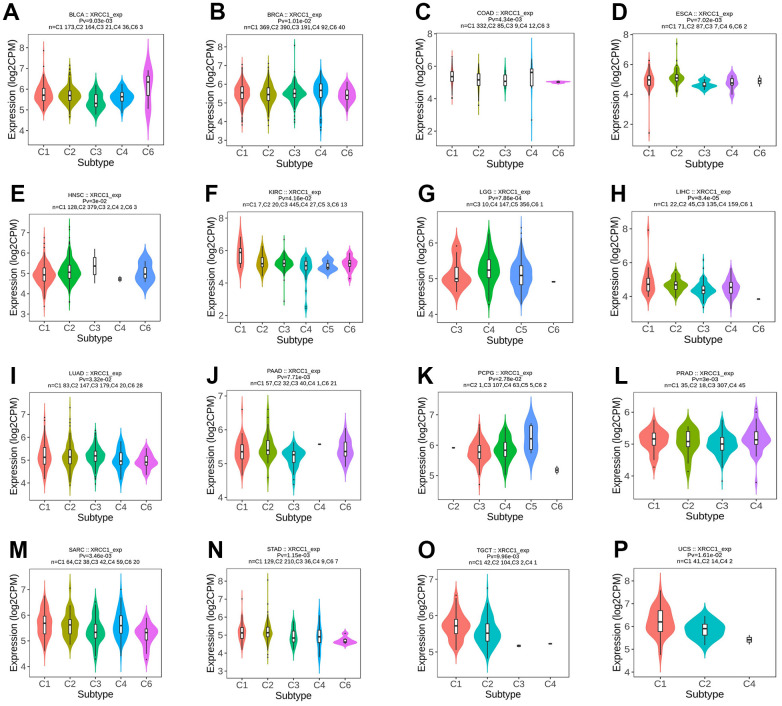
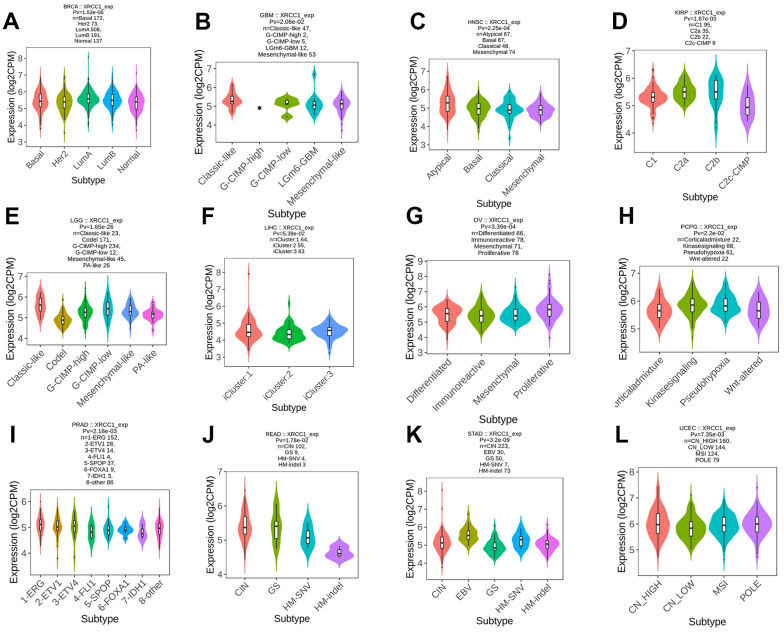
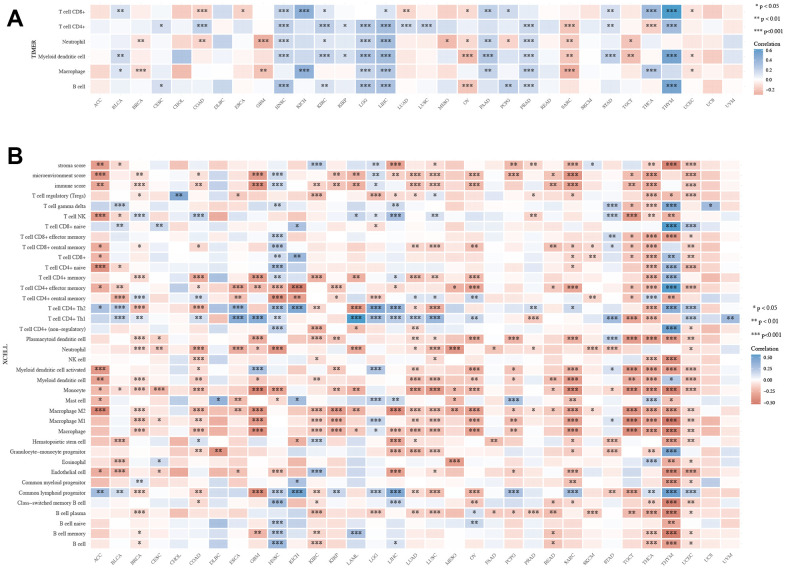
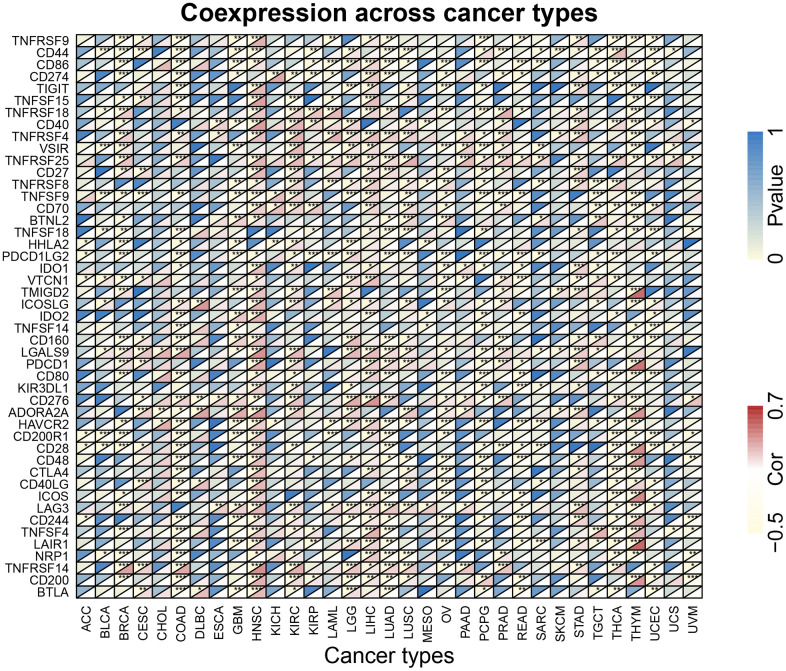
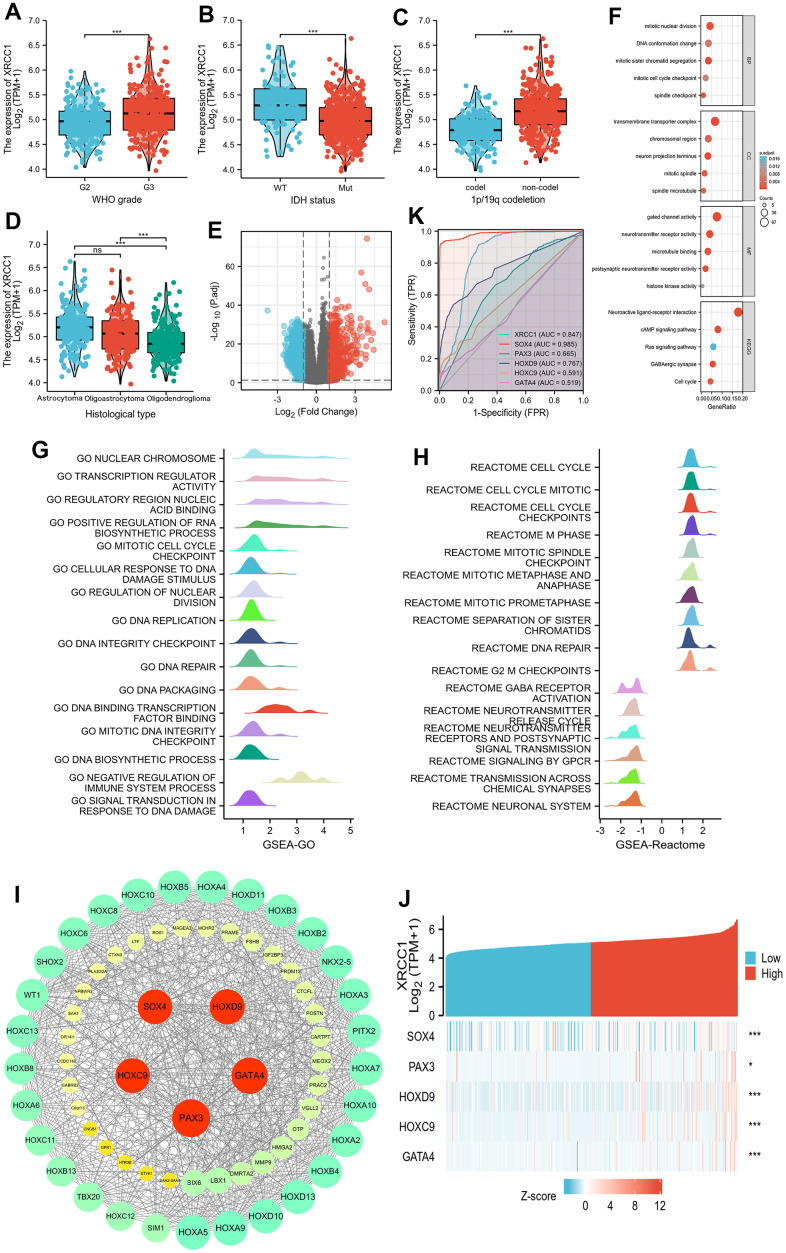
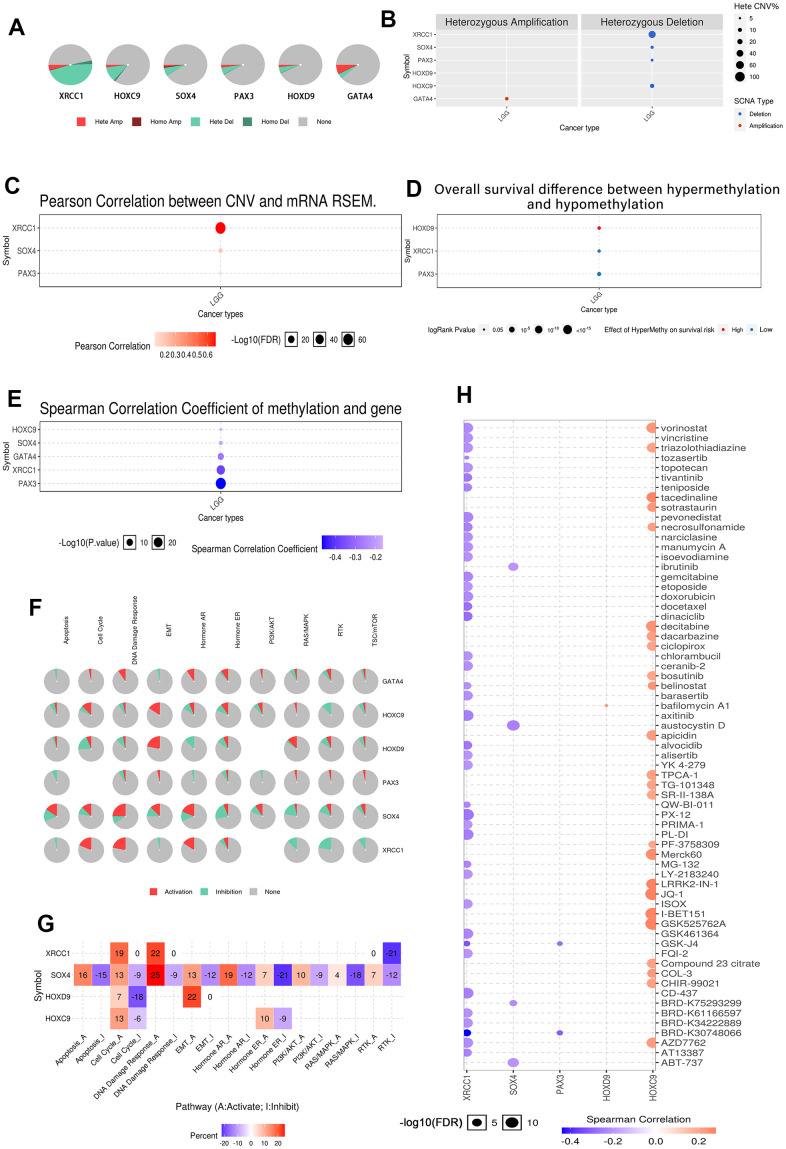
X-ray repair cross-complementation group 1 (XRCC1) is a pivotal contributor to base excision repair, and its dysregulation has been implicated in the oncogenicity of various human malignancies. However, a comprehensive pan-cancer analysis investigating the prognostic value, immunological functions, and epigenetic associations of XRCC1 remains lacking. To address this knowledge gap, we conducted a systematic investigation employing bioinformatics techniques across 33 cancer types. Our analysis encompassed XRCC1 expression levels, prognostic and diagnostic implications, epigenetic profiles, immune and molecular subtypes, Tumor Mutation Burden (TMB), Microsatellite Instability (MSI), immune checkpoints, and immune infiltration, leveraging data from TCGA, GTEx, CELL, Human Protein Atlas, Ualcan, and cBioPortal databases. Notably, XRCC1 displayed both positive and negative correlations with prognosis across different tumors. Epigenetic analysis revealed associations between XRCC1 expression and DNA methylation patterns in 10 cancer types, as well as enhanced phosphorylation. Furthermore, XRCC1 expression demonstrated associations with TMB and MSI in the majority of tumors. Interestingly, XRCC1 gene expression exhibited a negative correlation with immune cell infiltration levels, except for a positive correlation with M1 and M2 macrophages and monocytes in most cancers. Additionally, we observed significant correlations between XRCC1 and immune checkpoint gene expression levels. Lastly, our findings implicated XRCC1 in DNA replication and repair processes, shedding light on the precise mechanisms underlying its oncogenic effects. Overall, our study highlights the potential of XRCC1 as a prognostic and immunological pan-cancer biomarker, thereby offering a novel target for tumor immunotherapy.

Keywords: X-ray repair cross-complementation group 1; immune infiltration; pan-cancer; prognosis; tumor microenvironment.


Conflict of interest statement

CONFLICTS OF INTEREST: The authors declare that the research was conducted without any commercial or financial relationships that could be construed as a potential conflict of interest.

Figures

Figure 1
Figure 1
(A) Human XRCC1 gene expression status in various cancers from TCGA database. (B) Wilcoxon signed rank sum test was used to detect the differential expression of XRCC1 in tumor tissues and adjacent paracancerous tissues. (C) The protein expression level of the XRCC1 gene in glioblastoma multiforme, hepatocellular carcinoma, head and neck squamous carcinoma, pancreatic adenocarcinoma, breast cancer, ovarian cancer, colon cancer, lung adenocarcinoma, clear cell RCC. (D) The box plot of tumor pathological stages (stage I, stage II, stage III, stage IV) following ACC, BLCA, LIHC, and clinical stages (stage I, stage II, stage III, stage IV) of HNSC, OSCC. ns P≥0.05, *P<0.05, **P<0.01; ***P<0.001.
Figure 2
Figure 2
Summary of relativity between survival prognosis across cancer types in TCGA dataset and XRCC1 gene expression levels. The GEPIA database was utilized to plot overall survival (A) and disease-free survival (B) conditions across cancer types in TCGA dataset by XRCC1 gene expression. We observed that high XRCC1 gene expression was related to worse OS and DFS in almost all cancer types, except DFS in UCEC cohorts(n=160) and THYM cohorts(n=118). Only p-values < 0.05 were displayed.
Figure 3
Figure 3
Association between XRCC1 expression levels and cancer patients' PFS and DSS prognosis, using univariate survival analysis in various cancers. (A) Relevance of XRCC1 gene expression levels to PFS prognosis across cancer types in TCGA dataset. (B) Relevance of XRCC1 gene expression to DSS prognosis across cancer types in TCGA dataset. Red font indicated P-value < 0.05.
Figure 4
Figure 4
XRCC1 expression levels could distinguish between cancerous and normal tissues in pan-cancer. (A) ACC; (B) BLCA; (C) BRCA; (D) CESC; (E) CHOL; (F) COAD; (G) DLBC; (H) ESCA; (I) GBM; (J) HNSC; (K) KIRC; (L) KIRP; (M) LGG; (N) LIHC; (O) OSCC; (P) PAAD; (Q) READ; (R) SKCM; (S) STAD; (T) THYM. X-axis reveals the false positive rate, while Y-axis indicates the true positive rate.
Figure 5
Figure 5
We utilized the UALCAN tool to compare the expression status of XRCC1 phosphoprotein (NP_006288.2, S234, S241, S266, S268, S447, S461, S475, and T453 sites) between primary tissue of specific tumors and normal tissue from CPTAC database. The schematic diagram of XRCC1 protein (A) demonstrated the phosphoprotein sites with positive results. We also enriched the box plots with different tumors containing breast cancer (B), clear cell RCC (C), COAD (D), LUAD (E), GBM (F), UCEC (G), PAAD (H), ovarian cancer (I), HNSC (J).
Figure 6
Figure 6
Mutation feature of XRCC1 in pan-cancer of TCGA. (A) The cBioPortal database was used to analyze the proportion of patients with XRCC1 genomic alterations in pan-cancer. The frequency of mutation type (B) and mutation site (C) of XRCC1 in TCGA tumors was analyzed using the cBioPortal tool. The cBioPortal database was used to explore the impact of XRCC1 mutation status on OS (D), DFS (E), PFS (F), and DSS (G) of cancer patients.
Figure 7
Figure 7
Promoter methylation level of XRCC1 in pan-cancer. (A) in BRCA, (B) in COAD, (C) in ESCA, (D) in KIRC, (E) in KIRP, (F) in LUSC, (G) in PAAD, (H) in READ, (I) in SARC, (J) in THCA.
Figure 8
Figure 8
The relevance of XRCC1 gene expression levels to TMB and MSI across cancer types. (A) A bar chart reveals the relevance of XRCC1 gene expression levels to TMB in pan-cancer. (B) A bar chart shows the relationship between XRCC1 gene expression levels and MSI in multiple cancer types. The horizontal axis in the figure represents the correlation coefficient between genes and TMB/MSI, the ordinate is different tumors, the size of the dots in the figure represents the value of the correlation coefficient, and the different colours represent the degree of statistical significance. The bluer the colour, the smaller the p-value.
Figure 9
Figure 9
The relationship between XRCC1 expression and pan-cancer immune subtypes. (A) in BLCA, (B) in BRCA, (C) in COAD, (D) in ESCA, (E) in HNSC, (F) in KIRC, (G) in LGG, (H) in LIHC, (I) in LUAD, (J) in PAAD, (K) in PCPG, (L) in PRAD, (M) in SARC, (N) in STAD, (O) in TGCT, (P) in UCS.
Figure 10
Figure 10
The relationship between XRCC1 expression and pan-cancer molecular subtypes. (A) in BRCA, (B) in GBM, (C) in HNSC, (D) in KIRP, (E) in LGG, (F) in LIHC, (G) in OV, (H) in PCPG, (I) in PRAD, (J) in READ, (K) in STAD, (L) in UCEC.
Figure 11
Figure 11
The XRCC1 expression correlated with immune infiltration. (A) The expression of XRCC1 was strongly associated with the infiltration levels of various immune cells in the TIMER dataset. (B) Based on the XCELL database, we explored the significant correlation between the expression of XRCC1 and the infiltration levels of various immune cells. (*p < 0.05, **p < 0.01, and ***p < 0.001).
Figure 12
Figure 12
The association heatmaps between XRCC1 expression and immune checkpoint genes in pan-cancer. *P < 0.05, **P < 0.01, ***P < 0.001.
Figure 13
Figure 13
Associations between XRCC1 expression and different clinical characteristics in LGG. PPI network building and GO, KEGG, and GSEA analyses between XRCC1 high and low expression groups in LGG. Hub genes positively correlated with XRCC1 expression in LGG and hub genes' receiver operating characteristic (ROC) curve. (A) WHO grade. (B) IDH status. (C) 1p/19q codeletion. (D) Histological type (ns, p≥0.05, *p<0.05, **p<0.01, ***p<0.001). (E) volcano plot of DEGs (red: upregulation, blue: downregulation). (F) GO and KEGG analyses of DEGs. (G, H) significant GSEA results for DEGs, including GO terms and Reactome pathways. (I) PPI network. (J) the gene coexpression heatmap of the hub genes. (K) ROC curve of hub genes.
Figure 14
Figure 14
Analysis of genetic mutation and methylation levels of XRCC1 and hub-gene and pathway regulation in LGG. (A) Homozygous/heterozygous CNV of XRCC1 and its related genes in LGG. Homo Amp: homozygous amplification; Hete Amp: heterozygous amplification; Homo Del: homozygous deletion; Hete Del: heterozygous deletion; None: without CNV. (B) The heterozygous CNV of XRCC1 and (C) the correlation between CNV and mRNA RSEM. The heterozygous CNV of XRCC1 and the correlation between CNV and mRNA RSEM in LGG were plotted to utilize GSCALite. (D) The overall survival discrepancy between hypermethylation and hypomethylation of XRCC1 and its related genes in LGG. (E) In the correlation between methylation and gene expression in LGG, blue represented a negative correlation, while red represented a positive correlation. (F) XRCC1 and hub genes influence pathways that participate in the development, growth, and progression of LGG. (G) The inferred activity of the identified four target genes in pathways that participate in the development, growth, and progression of LGG. A and I to mark the active and inhibited pathways, respectively. (H) The correlation of XRCC1 expression and LGG drug sensitivity.

Similar articles

Cited by

References

    1. Bray F, Laversanne M, Weiderpass E, Soerjomataram I. The ever-increasing importance of cancer as a leading cause of premature death worldwide. Cancer. 2021; 127:3029–30. 10.1002/cncr.33587 - DOI - PubMed
    1. de Sá VK, Coelho JC, Capelozzi VL, de Azevedo SJ. Lung cancer in Brazil: epidemiology and treatment challenges. Lung Cancer (Auckl). 2016; 7:141–8. 10.2147/LCTT.S93604 - DOI - PMC - PubMed
    1. Dodgshun AJ, Fukuoka K, Edwards M, Bianchi VJ, Das A, Sexton-Oates A, Larouche V, Vanan MI, Lindhorst S, Yalon M, Mason G, Crooks B, Constantini S, et al.. Germline-driven replication repair-deficient high-grade gliomas exhibit unique hypomethylation patterns. Acta Neuropathol. 2020; 140:765–76. 10.1007/s00401-020-02209-8 - DOI - PubMed
    1. Elias-Rizk T, El Hajj J, Segal-Bendirdjian E, Hilal G. The long non coding RNA H19 as a biomarker for breast cancer diagnosis in Lebanese women. Sci Rep. 2020; 10:22228. 10.1038/s41598-020-79285-z - DOI - PMC - PubMed
    1. Jayaraj R, Raymond G, Krishnan S, Tzou KS, Baxi S, Ram MR, Govind SK, Chandramoorthy HC, Abu-Khzam FN, Shaw P. Clinical Theragnostic Potential of Diverse miRNA Expressions in Prostate Cancer: A Systematic Review and Meta-Analysis. Cancers (Basel). 2020; 12:1199. 10.3390/cancers12051199 - DOI - PMC - PubMed

Publication types

Substances