. 2024 Jan 13;81(1):43.
doi: 10.1007/s00018-023-05072-4.

Mechano-regulation by clathrin pit-formation and passive cholesterol-dependent tubules during de-adhesion

Affiliations

Mechano-regulation by clathrin pit-formation and passive cholesterol-dependent tubules during de-adhesion

Tithi Mandal et al. Cell Mol Life Sci. .

Abstract

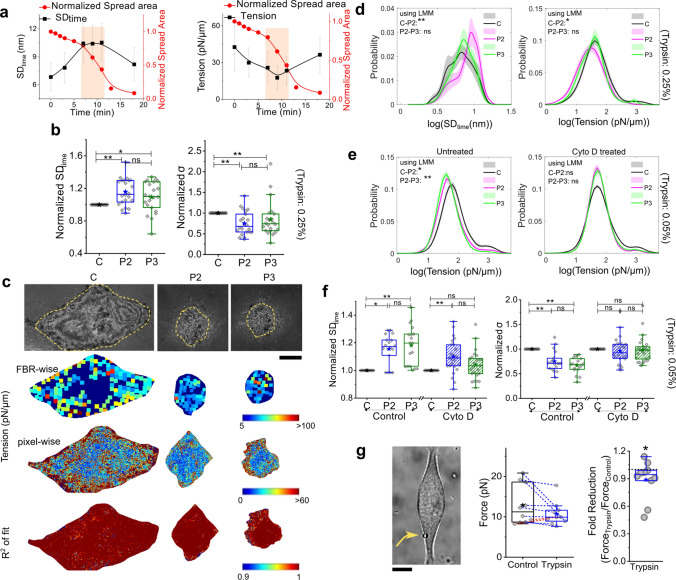
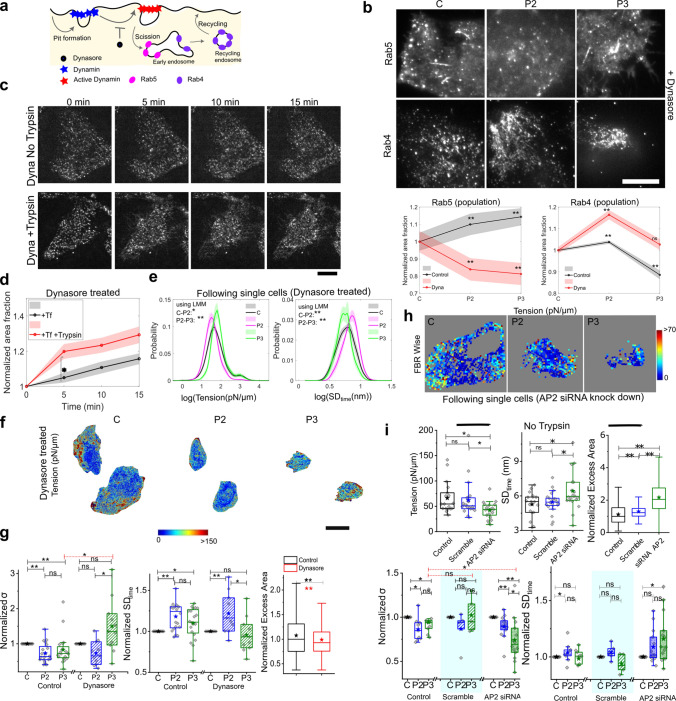
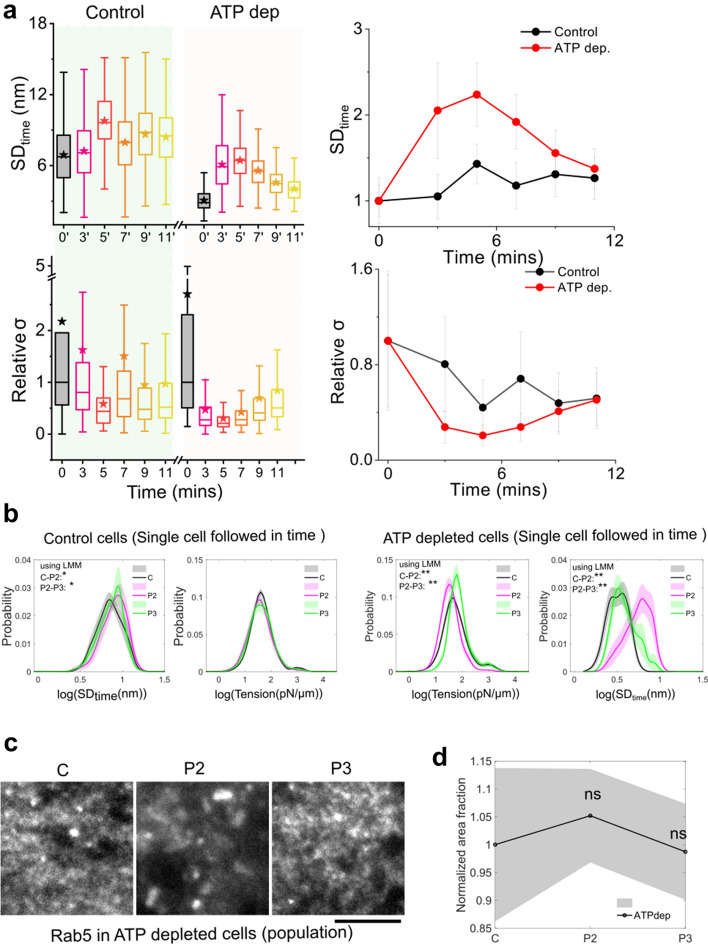
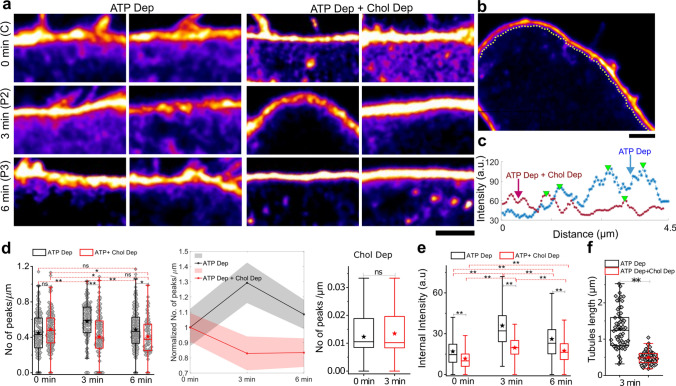
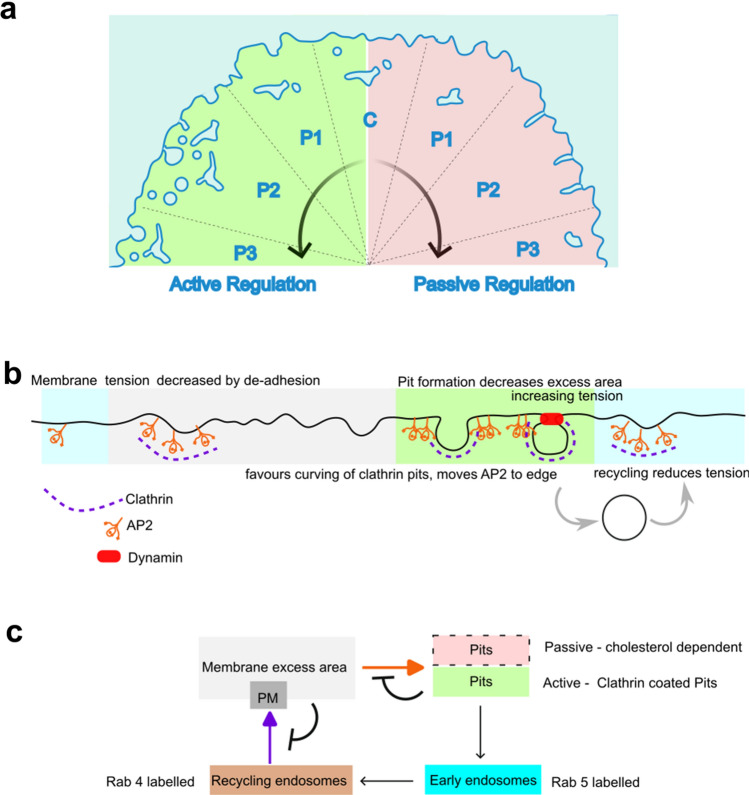
Adherent cells ensure membrane homeostasis during de-adhesion by various mechanisms, including endocytosis. Although mechano-chemical feedbacks involved in this process have been studied, the step-by-step build-up and resolution of the mechanical changes by endocytosis are poorly understood. To investigate this, we studied the de-adhesion of HeLa cells using a combination of interference reflection microscopy, optical trapping and fluorescence experiments. We found that de-adhesion enhanced membrane height fluctuations of the basal membrane in the presence of an intact cortex. A reduction in the tether force was also noted at the apical side. However, membrane fluctuations reveal phases of an initial drop in effective tension followed by saturation. The area fractions of early (Rab5-labelled) and recycling (Rab4-labelled) endosomes, as well as transferrin-labelled pits close to the basal plasma membrane, also transiently increased. On blocking dynamin-dependent scission of endocytic pits, the regulation of fluctuations was not blocked, but knocking down AP2-dependent pit formation stopped the tension recovery. Interestingly, the regulation could not be suppressed by ATP or cholesterol depletion individually but was arrested by depleting both. The data strongly supports Clathrin and AP2-dependent pit-formation to be central to the reduction in fluctuations confirmed by super-resolution microscopy. Furthermore, we propose that cholesterol-dependent pits spontaneously regulate tension under ATP-depleted conditions.

Keywords: Excess area regulation; Membrane homeostasis; Tension propagation.


Conflict of interest statement

The authors declare that they have no known competing financial interests or personal relationships that could have appeared to influence the work reported in this paper.

Figures

Fig. 1
Fig. 1
Phases and variability in de-adhesion. a IRM images of a representative cell before and after Trypsin–EDTA addition at 0.25% (faster) concentrations and corresponding temporal fluctuation maps. The time after de-adhering solution addition is mentioned. Scale: 10 μm. Zoomed-in views of SDtime maps (right). b Profiles of spread area for 6 representative cells in each concentration with time after Trypsin–EDTA addition in the two different concentrations. c Time taken to de-adhere 67% of spread area of cell. Ncell: Control = 15, Dyna = 8, Cyto D = 17, ATP Dep = 20, Chol Dep = 18, ATP Dep + Chol Dep = 11. Control = 11, Cyto D = 18. d Representative colour-coded kymographs of IRM intensity of Control and Cyto D-treated cell. ROIS drawn perpendicular to the de-adhering front of a cell. Scale: 10 μm
Fig. 2
Fig. 2
Membrane slacks transiently. a Representative time series of indicated parameters for a single cell during fast de-adhesion. b Comparison of normalized amplitudes of fluctuations and tension following the same cells across the indicated phases of de-adhesion. Data represent average median values calculated for 22 cells using FBRs of sizes 0.75 μm2. Normalization is performed by dividing any particular cell’s measurement at P2 or P3 by the measurement at C. Table S1 provides the minimum number of FBRs used per cell in each mechanism used for calculating the average. c IRM images of a representative cell at different phases of de-adhesion, and the corresponding FBR-wise tension values mapped back on the cell outline. The dark blue background represents the cell, and coloured boxes denote tension values derived from averaged PSDs from the indicated regions. Lower panel indicates pixel wise tension map and corresponding R2 map. d Comparison of probability of logarithm of temporal fluctuation and tension across the de-adhesion phases using 0.25% Trypsin–EDTA. Distributions were obtained from FBR-wise values for each cell and averaged. Shaded regions denote the SEM. e Comparison of probability of logarithm of tension measures across the cells (FBR wise) across the de-adhesion phases of Control (left) Ncell = 18, and Cytochalasin D (right) treated cells Ncell = 25 using 0.05% Trypsin–EDTA. f Comparison of fold change in the mean amplitude of fluctuations and median tension for the same cells followed over time of Control and Cyto D-treated cells. Normalization is performed by dividing any cell's measurement at P2 or P3 by the measurement at C. g Left: Typical image of a cell used for the tether-pulling experiment. Ncell = 10. The trapped bead is marked out with an arrow. Right: Fold reduction of force after Trypsin addition (higher concentration: 0.25%). Black *denotes Mann–Whitney U statistical significance test with Bonferroni correction is performed, * denotes p values < 0.016, and **denotes p value < 0.001. Scale bar = 10 μm
Fig. 3
Fig. 3
De-adhesion induces endocytosis. a Schematic of formation of early endosomes and maturation into recycling endosomes. b Transferrin uptake assay in Normal and 0.25% Trypsinised cells Ncell: Control = 116, Trypsinised = 125. c Representative TIRF images of same HeLa cells followed through time, puncta marked with Transferrin- 568 with 0.25% Trypsin (upper panel), and without Trypsin (bottom panel). Scale bar = 10 µm. d Normalized area fraction of Transferrin-marked puncta followed through time with and without Trypsin. Ncell: Trypsin = 53, without Trypsin = 16. Shaded regions denote SEM measure while average per distribution. e Representative TIRF images of the same HeLa cells transiently expressing EGFP -Rab5 (upper panel) or mCherry -Rab4 (lower panel) before (0 min) and after administration of de-adhesion media. Bottom panel represents zoomed-in view (Scale bar = 5 µm). f Change in area fraction of Rab5 (left) and Rab4 (right) as spread area reduces on de-adhesion for typical single cells. g Normalized area fraction of Rab5 and Rab4 through different time points before and after addition of 0.25% Trypsin. Ncell: Rab5 = 15, Rab4 = 43. Shaded regions denote SEM. Table S1 provides the list of the number of cells and other statistical parameters. h Representative STED images of Clathrin (Clathrin heavy chain) and AP2 (α subunit) Scale bar = 3 µm. i Zoomed in sections (ROIs marked in h with colours as indicated) Scale bar = 100 nm. Yellow arrow-head points at edge-localized AP2 next to well-matured calthrin-coated pit with distinctly distributed clathrin. Pink arrow-head points out smaller clathrin puncta much better colocalized. j Other randomly selected ROIs from other cells. Scale bar = 1 µm k Quantification of colocalization using Mander’s coefficient from 10 cells and 27 ROIs for Control, and 20 cells and 32 rois for + Trypsin condition. l Colocalization from object detection from Ncell = 15 and 28 for Control and trypsinized conditions with 70 and 75 ROIs, respectively. m Comparison of distance between clathrin punctas and the nearest AP2 puncta for only those pairs that lie within 525 nm of each other. > 40,000 clathrin puncta and > 14,000 AP2 puncta were used. Data (h-m) are representative of 3 independent sets with 45 and > 60 cells imaged in each condition
Fig. 4
Fig. 4
Blocking endocytosis does not stop tension recovery. a Schematic diagram of pit formation, scission, recycling and inhibition of dynamin. b TIRF images of Dynasore-treated cells transfected with EGFP-Rab5 or immune-stained with Rab4 before and after de-adhesion. Scale bar = 10 μm. Bottom: Normalized area fraction of Rab5 marked early endosomes (left) and Rab4 marked recycling endosomes (right) of Control and treated with Dynamin inhibitor- Dynasore. Ncells(Rab5): Control ~ 57, Dynasore ~ 43, Ncells(Rab4): Control ~ 70, Dynasore ~ 103. c Representative TIRF images of Dynamin-inhibited HeLa cells followed through time, puncta marked with Transferrin- 568 without Trypsin or with 0.25% Trypsin. Scale bar = 10 µm. d Normalized area fraction of Transferrin-marked puncta followed through time with and without Trypsin. Ncell: Trypsin = 12, without Trypsin = 8. Shaded regions denote SEM. e Probability distribution of FBR wise log temporal fluctuations and tension of Dynasore treated same HeLa cell followed through different phases of De-adhesion. Ncell: Dynasore = 11. Shaded regions denote SEM. f Typical tension map of Dynasore-treated cells in the different phases of de-adhesion. Scale bar = 10 μm. (Upper). g Fold change in cell-averaged parameters comparing each cell with its own measurements at different phases. Ncell: Control = 20, Dynasore = 11. For excess area, FBR-wise comparison is presented with red *denoting statistical significance obtained from LMM. h FBR-wise tension map of a representative AP2 knockdown cell in different phases. i Top: Cell-wise comparison of tension and SDtime of Control, scramble (scrambled siRNA), AP2 siRNA-treated cells without de-adhesion. For excess area, FBR-wise comparison is presented. Bottom: Fold change in cell-averaged parameters comparing each cell with its own measurements at different phases of de-adhesion. Ncell: Control = 9, Scramble = 5, AP2 siRNA = 14. n = 3 independent experiments. One-way ANOVA with Bonferroni correction is performed for SDtime since the data are normal. For tension, the Mann–Whitney U test is performed and *denotes a p value < 0.016 (adjusted by group size of 3 per experiment). N = 3 independent experiments. Table S1 provides a list of the number of FBRs
Fig. 5
Fig. 5
Tension recovery can start without ATP. a Time series boxplots and median (with median absolute deviation (MAD) as error bar, lower panel) for different parameters for Control and ATP-depleted cells on de-adhesion using an FBR size of 4.67 μm2. Ncells(control):6 Ncells(ATP Depleted): 9. b Probability distribution of FBR-wise log temporal fluctuations and tension of Control and ATP depleted same HeLa cell followed through different phases of De-adhesion. Shaded regions denote SEM. c Zoomed-in TIRF images of different cells (transfected with EGFP-Rab5) at different stages of de-adhesion in ATP-depleted condition. d Normalized area fraction of Rab5 in ATP-depleted condition. Shaded regions denote SEM. Ncells: C = 26, P2 = 41, P3 = 39
Fig. 6
Fig. 6
Passive regulation is cholesterol-dependent. a Representative tension maps of cholesterol-depleted (Upper Panel) and ATP-depleted as well as cholesterol-depleted cells (Lower Panel) in three phases of de-adhesion. Scale bar = 10 μm. b Probability distribution of FBR-wise values of log temporal fluctuations and tension of cholesterol-depleted HeLa cell followed through different phases of de-adhesion. Shaded regions denote SEM. c Fold change in cell-averaged parameters comparing each cell with its own measurements at different phases. Ncells: Control = 11, ATP dep = 9, Chol dep = 16, ATP dep + Chol dep = 15. d Probability distribution of FBR-wise values of log temporal fluctuations and tension of ATP depleted as well cholesterol-depleted same HeLa cells followed through different phases of de-adhesion. Shaded regions denote SEM. e Plot of rate of fractional change of tension when cells transit between different phases (mentioned). One-way Anova with Bonferroni correction is performed for SDtime since the data are normal. For tension, the Mann–Whitney U test is performed and *denotes p value < 0.016 (adjusted by group size of 3 per experiment). n = 3 independent experiments. Ncells mentioned in Table S1
Fig. 7
Fig. 7
Membrane imaging reveals cholesterol-dependent tubules. a Representative zoomed in colour-coded confocal images of cells [ATP-depleted (left) and ATP-depleted as well as cholesterol-depleted (right)]. Scale bar = 2 μm. b Typical line scans are performed parallel to the membrane on the cytosolic side. Scale bar = 2 μm c Intensity profile of typical line scans of ATP-depleted and ATP Dep + Chol Dep condition with triangles pointing out detected peaks with minimal width and height. d Box plots (left) and line plot (centre) comparing number of peaks/μm in ATP-depleted and ATP + Cholesterol depleted through different time points of de-adhesion. Number of cells = 20, 18, 28 for 0, 3, 6 min, respectively (ATP-depleted), 21, 24, 21 for 0, 3, 6 min, respectively (ATP + cholesterol-depleted). Effect of de-adhesion on only cholesterol-depleted cells were evaluated using 97 and 113 ROIs from 8 and 9 cells. e Comparison of intensity detected per μm of various 4 μm lines drawn as explained in (b). f Evaluation of length of tubules using analysis of 68 and 58 ROIs from 18 and 15 cells of ATP-depleted and ATP + Cholesterol-depleted cells, respectively. **denote p value < 0.001 calculated using Mann–Whitney U test. Table S1 lists the number of peaks
Fig. 8
Fig. 8
Schematic diagram. a Membrane remodelling by active and passive regulation. Schematic shows that membrane fluctuations enhance in the P1 and P2 phase. However, while in passive condition (low ATP), cholesterol-dependent tubules reduce the membrane fluctuations, in normal conditions, active regulation entails formation of pits and their internalization in the P2 phase which transiently accumulate in early and recycling endosomal structures till the tension enhances back and fusion of recycling membrane keeps the increasing tension in check. b The decrease in tension by de-adhesion favours curving of clathrin-coated pits—moving AP2 to the edges. Pit formation increases tension. Dynamin-dependent scission and Rab 4-based recycling helps maintain homeostatic tension. Lack of AP2 decreases abrogates regulation by pit formation while lack of functional dynamin affects maintenance of tension and results in much higher tension. c Regulation of plasma membrane excess area by formation of pits, early and recycling endosomes. Schematic depicts that higher membrane excess area at the PM favours formation of pits as observed in this study. Such pits can be static or actively internalized to add to the early endosomal pool as shown in this study. Part of the early endosomal pool get converted to the recycling pool which is depleted when some structures fuse back with the PM. At higher membrane excess area, this fusion is disfavoured which can cause accumulation of the recycling endosome as shown in a and observed in this study

Similar articles

Cited by

  • The Plasma Membrane and Mechanoregulation in Cells.
    Mukhopadhyay U, Mandal T, Chakraborty M, Sinha B. Mukhopadhyay U, et al. ACS Omega. 2024 May 13;9(20):21780-21797. doi: 10.1021/acsomega.4c01962. eCollection 2024 May 21. ACS Omega. 2024. PMID: 38799362 Free PMC article. Review.

References

    1. Abercrombie M, Dunn GA. Adhesions of fibroblasts to substartum during contact inhibition observed by interference reflection microscopy. Exp Cell Res. 1975;92:57–62. doi: 10.1016/0014-4827(75)90636-9. - DOI - PubMed
    1. Akatay AA, Wu T, Djakbarova U, Thompson C, Cocucci E, Zandi R, Rudnick J, Kural C. Endocytosis at extremes: formation and internalization of giant clathrin-coated pits under elevated membrane tension. Front Mol Biosci. 2022;9:959737. doi: 10.3389/FMOLB.2022.959737/BIBTEX. - DOI - PMC - PubMed
    1. Alert R, Casademunt J, Brugués J, Sens P. Model for probing membrane-cortex adhesion by micropipette aspiration and fluctuation spectroscopy. Biophys J. 2015;108:1878–1886. doi: 10.1016/j.bpj.2015.02.027. - DOI - PMC - PubMed
    1. Anderson RH, Sochacki KA, Vuppula H, Scott BL, Bailey EM, Schultz MM, Kerkvliet JG, Taraska JW, Hoppe AD, Francis KR. Sterols lower energetic barriers of membrane bending and fission necessary for efficient clathrin-mediated endocytosis. Cell Rep. 2021 doi: 10.1016/J.CELREP.2021.110008. - DOI - PMC - PubMed
    1. Barrias ES, Reignault LC, De Souza W, Carvalho TMU. Dynasore, a dynamin inhibitor, inhibits Trypanosoma cruzi entry into peritoneal macrophages. PLoS ONE. 2010 doi: 10.1371/journal.pone.0007764. - DOI - PMC - PubMed