. 2024;97(2):753-775.
doi: 10.3233/JAD-230514.

The Role of Impaired Receptor Trafficking in Mediating the Pathological Effects of APOE4 in Alzheimer's Disease

Affiliations

The Role of Impaired Receptor Trafficking in Mediating the Pathological Effects of APOE4 in Alzheimer's Disease

Mirna Safieh et al. J Alzheimers Dis. 2024.

Abstract

Background: Apolipoprotein E4 (APOE4) is the most prevalent genetic risk factor of Alzheimer's disease. Several studies suggest that APOE4 binding to its receptors is associated with their internalization and accumulation in intracellular compartments. Importantly, this phenomenon also occurs with other, non-ApoE receptors. Based on these observations, we hypothesized that APOE4 pathological effects are mediated by impairment in the life cycle of distinct receptors (APOER2, LRP1, IR, VEGFR).

Objective: To examine the effects of APOE genotype on receptors protein levels and compartmentalization.

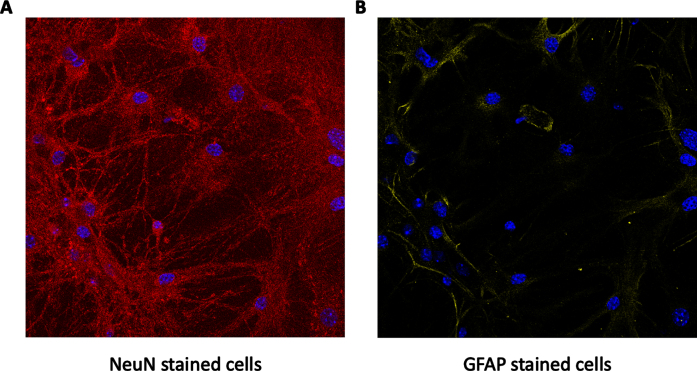
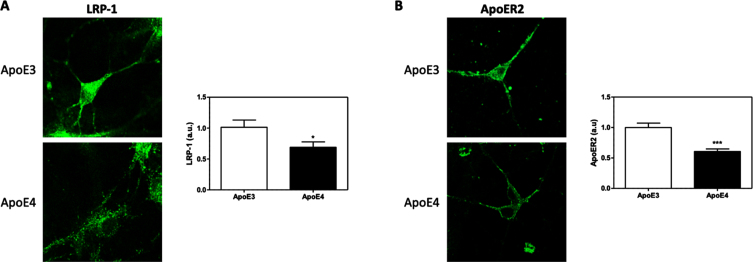
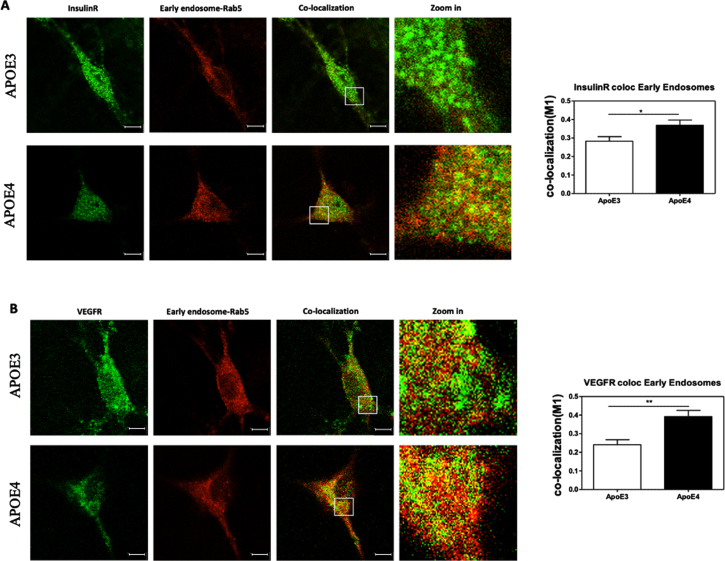
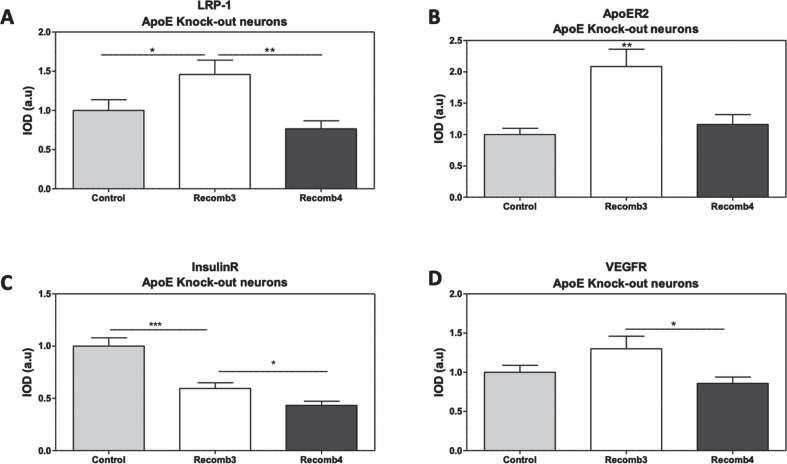
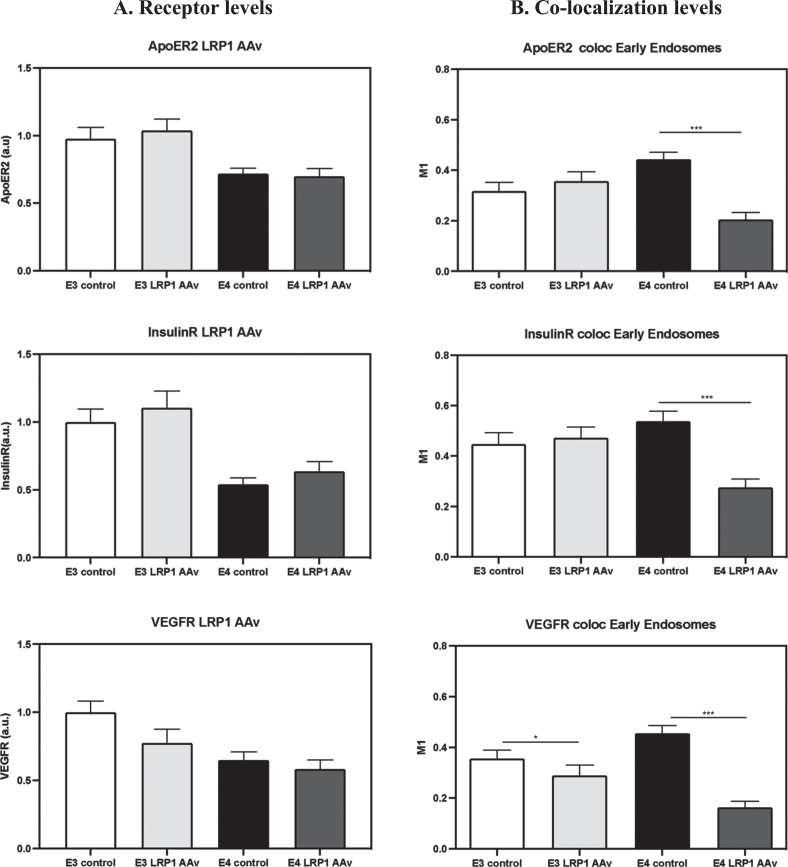
Methods: Primary mouse neurons were prepared from APOE3 or APOE4 targeted replacement mice, or APOE-KO mice. Specific receptors protein levels were evaluated in these neurons, utilizing immunofluorescent staining. Additionally, surface membrane protein levels of those receptors were assessed by cell surface biotinylation assay and ELISA. Receptors' colocalization with intracellular compartments was assessed by double staining and confocal microscopy, followed by colocalization analysis. Finally, LRP1 or APOER2 were knocked-down with CRISPR/Cas9 system to examine their role in mediating APOE4 effects on the receptors.

Results: Our results revealed lower receptors' levels in APOE4, specifically on the membrane surface. Additionally, APOE4 affects the compartmentation of these receptors in two patterns: the first was observed with LRP1 and was associated with decreased receptor levels in numerous intracellular compartments. The second was obtained with the other receptors and was associated with their accumulation in early endosomes and their decrease in the late endosomes.

Conclusions: These results provide a unifying mechanism, in which APOE4 drives the down regulation of various receptors, which plays important roles in distinct APOE4 related pathological processes.

Keywords: ABCA1; APOE4 pathology; APOER2; Alzheimer’s disease; Apolipoprotein E4; LRP1; VEGFR; insulin receptors; lipidation; receptor recycling.


Conflict of interest statement

The authors have no conflict of interest to report.

Figures

Fig. 1
Fig. 1
Neurons/astrocytes ratio in primary cultures. Primary cultures were stained for both NeuN (marked in red in A) and GFAP (marked in yellow in B). DAPI staining for cells’ nucleus is marked in blue. As can be seen, the levels of NeuN were much higher than those of GFAP, and together with the DAPI staining indicate that the culture is mostly neuronal, as expected.
Fig. 2
Fig. 2
The effects of APOE genotypes on the total levels of APOER2 and LRP1 in APOE3 and APOE4 primary neurons. APOE3 and APOE4 primary neurons were stained for LRP1 (A) and APOER2 (B). Representative images are shown on the left, whereas quantifications of the results are shown on the right. The results show a significant downregulation, in APOE4 neurons, of the levels of both LRP1 (APOE3 = 1.00±0.11, APOE4 = 0.68±0.086, p < 0.05, N = 53–58 cells from 4 different preparations) and APOER2 (APOE3 = 1.00±0.071, APOE4 = 0.60±0.040, p < 0.0001, N = 86–101 cells from 6 different preparations). The scalebar on the images indicate 10μm. *indicates p < 0.05, ***indicates<0.001.
Fig. 3
Fig. 3
The effects of APOE genotype on the total levels of IR and VEGFR. APOE3 and APOE4 primary neurons were stained for IR (A) and VEGFR (B). Representative images are shown on the left, whereas quantifications of the results are shown on the right. The results show that both IR (APOE3 = 1.00±0.12, APOE4 = 0.59±0.08, p < 0.05, N = 48–68 cells from 4 different preparations), and VEGFR (APOE3 = 1.00±0.11, APOE4 = 0.69±0.04, p < 0.05, N = 41–46 cells from 4 different preparations) are downregulated in APOE4 primary neurons. The scalebar on the images indicate 10μm. *p < 0.05.
Fig. 4
Fig. 4
The APOE genotype’s effects on the surface-to-total ratio of APOER2, LRP1, IR, and VEGFR. External membranal proteins were labelled using a biotinylating kit. Subsequently, using commercial ELISA kits directed at the specific receptors investigated, both the biotinylated extract and the total lysates were evaluated and the surface to total ratio was calculated. The results obtained show that APOE3 cells whose levels were set as 100%, while APOE4 cells had significantly lower surface levels of APOER2 (APOE3 = 100% ±11.08, APOE4 = 47.02% ±8.54, p < 0.05, N = 3) and LRP1 (APOE3 = 100% ±4.88, APOE4 = 51.97% ±15.50, p < 0.05, N = 3). A similar trend was seen in IR (APOE3 = 100% ±8.26, APOE4 = 71.23% ±13.75, p < 0.05, N = 3, p = 0.07, N = 3), and VEGFR (APOE3 = 100% ±1.34, APOE4 = 91.10% ±2.82, p < 0.05, N = 3, p = 0.15, N = 3). *p < 0.05.
Fig. 5
Fig. 5
Colocalization of ApoE receptors with early endosomes. The total levels of both LRP1 and APOER2 were downregulated in APOE4 neurons when compared to APOE3 neurons (see representative figures on the left and in Fig. 2) In contrast, the area covered by the early endosomes staining was not affected by the APOE genotype (see Fig. 7). The extent of colocalization of LRP1 (A) and APOER2 (B) with the early endosomes were determined utilizing double staining and confocal microscopy, followed by M1 colocalization analysis. Representative images, shown on the left side of the figure whereas the quantified results are shown on the right. The results revealed that LRP1 was significantly more localized to the early endosomes in APOE3 neurons (0.24±0.02) than the APOE4 neurons (0.11±0.01, p < 0.001), while APOER2 showed an opposite effect where the receptors were significantly more localized with the early endosomes in APOE4 (0.50±0.04) than the APOE3 neurons (0.37±0.037, p < 0.05). The scalebar on the images indicate 10μm. *p < 0.05, ***p < 0.001.
Fig. 6
Fig. 6
Colocalization of growth factor receptors with early endosomes. The levels of IR (A) and VEGFR (B) that are localized with the early endosomes were evaluated utilizing double staining and confocal microscopy, followed by M1 colocalization analysis. The representative images presented on the left show that the intensity of both IR and VEGFR is lower in APOE4 neurons when compared to APOE3 neurons, and no significant effects of APOE genotype is evident in the staining areas of the early endosomes. On the other hand, the extent of colocalization of these receptors (marked with yellow pixels) was higher in APOE4 neurons in both IR and VEGFR. Quantification of the results show that APOE4 neurons exhibit significantly higher colocalization than APOE3 in both IR (APOE3 = 0.28±0.02, APOE4 = 0.36±0.02, p < 0.05) and VEGFR (APOE3 = 0.24±0.02, APOE4 = 0.39±0.03, p < 0.001). The scalebar on the images indicate 10μm. *p < 0.05, **p < 0.001.
Fig. 7
Fig. 7
The effects of APOE genotype on distinct endosomal and lysosomal compartments. APOE3 and APOE4 primary neurons were stained for markers of early endosomes (Rab5; A), late endosomes (Rab7; B), lysosomes (CatD; C), and recycling endosomes (RAb11; D). The intracellular areas of these compartments were then analyzed as described in the Materials and Methods. This revealed that the areas of both late endosomes (APOE3 = 1.00±0.03, APOE4 = 0.87±0.05, p≤0.05) and lysosome (APOE3 = 1.00±0.04, APOE4 = 0.76±0.03, p < 0.0001) are downregulated in APOE4 primary neurons. In contrast, the levels of the early endosomes (APOE3 = 1.00±0.03, APOE4 = 1.1±0.05, p = 0.30) and recycling endosomes (APOE3 = 1.00±0.06, APOE4 = 0.94±0.07, p = 0.56) were not affected by APOE4. *p < 0.05, ***p < 0.0001.
Fig. 8
Fig. 8
Intracellular distribution of the receptors. The extent of colocalization of LRP1 (A), APOER2 (B), IR (C), and VEGFR (D) with early, late, and recycling endosomes, as well as with lysosomes, was determined by double staining confocal microscopy, as described in the Materials and Methods. The results shown correspond to 25–37 cells from 2-3 different preparations for each of the receptors and compartment colocalization. The results obtained revealed two patterns: The first, exemplified by LRP1, shows that the levels of this receptor in APOE4 neurons are lower in the early and late endosomes and unchanged in lysosomes and recycling endosomes. (Early endosomes: APOE3 = 0.22±0.022, APOE4 = 0.16±0.015, p < 0.001. Late endosomes: APOE3 = 0.24±0.023, APOE4 = 0.127±0.031, p < 0.001. Lysosomes: APOE3 = 0.36±0.031, APOE4 = 0.29±0.027, p < 0.05. Recycling endosomes: APOE3 = 0.12±0.024, APOE4 = 0.12±0.023). The second pattern is common to the APOER2, IR, and VEGFR where the elevation in the colocalization in the early endosomes in APOE4 was accompanied by a decrease in localization to the other compartments, mainly, late endosome (APOER2- early endosomes: APOE3 = 0.37±0.044, APOE4 = 0.51±0.037, p < 0.05. Late endosomes: APOE3 = 0.49±0.024, APOE4 = 0.38±0.059, p = 0.15. Lysosomes: APOE3 = 0.41±0.024, APOE4 = 0.26±0.019, p < 0.0001. Recycling endosomes: APOE3 = 0.17±0.025, APOE4 = 0.15±0.017, p = 0.51. IR- early endosomes: APOE3 = 0.28±0.02, APOE4 = 0.36±0.02, p < 0.05. Late endosomes: APOE3 = 0.41±0.042, APOE4 = 0.31±0.028, p < 0.05. Lysosomes: APOE3 = 0.33±0.017, APOE4 = 0.33±0.034, p = 0.19. Recycling endosomes: APOE3 = 0.18±0.015, APOE4 = 0.13±0.022, p < 0.05. VEGFR- early endosomes: APOE3 = 0.22±0.03, APOE4 = 0.36±0.04, p < 0.05. Late endosomes: APOE3 = 0.29±0.04, APOE4 = 0.15±0.03, p < 0.05. Lysosomes: APOE3 = 0.20±0.02, APOE4 = 0.14±0.01, p < 0.05. Recycling endosomes: APOE3 = 0.27±0.02, APOE4 = 0.19±0.02, p < 0.05).
Fig. 9
Fig. 9
ApoE levels in conditioned media of APOE3 and APOE4 primary neurons. The levels of ApoE in conditioned media of APOE3 and APOE4 neuronal cultures were determined by western blot analysis as described in the Materials and Methods. Representative image of the blot is presented in A; whereas, quantification of the blots is shown in B. The results show that the levels of ApoE in the APOE4 cultures, were significantly lower than those of the APOE3 cultures (APOE3 = 1.00±0.14, APOE4 = 0.40±0.12, p < 0.05, N = 4). *p < 0.05.
Fig. 10
Fig. 10
The effects of recombinant APOE3 and APOE4 on the levels of the receptors in APOE-KO derived primary neurons. APOE-KO neurons were prepared as described in the Materials and Methods section. On day 14 of the cultures, the neurons were treated with 100 nM of either recombinant APOE3 or APOE4 for 2 h. Following treatment, the neurons were stained for LRP1, APOER2, VEGFR, or IR, after which the images were captured and analyzed. Quantification of the results show that APOE3 induced an elevation in LRP1 (Control = 1.00±0.13, recombinant APOE3 = 1.45±0.18, recombinant APOE4 = 0.76±0.10, p-value recombinant3/control<0.05, p-value recombinant4/recombinant3 < 0.01, N = 28–31 from 3 different preparations), APOER2 (Control = 1.00±0.09, recombinant APOE3 = 2.08±0.27, recombinant APOE4 = 0.1.16±0.15, p < 0.01 when comparing recombinant3 with both control and recombinant4, N = 20 from 2 different preparations) and VEGFR (Control = 1.00±0.09, recombinant APOE3 = 1.30±0.16, recombinant APOE4 = 0.85±0.08, p-value recombinant3/control=0.09, p-value recombinant4/ recombinant3 < 0.01, N = 15–20 from 2 different preparations) when compared to control and APOE4. On the other hand, both recombinant APOE3 and APOE4 resulted in lower levels of IR when compared to control, more so in APOE4 treated neurons (Control = 1.00±0.08, recombinant APOE3 = 0.59±0.05, recombinant APOE4 = 0.43±0.04, p-value recombinant3/control<0.001, p-value recombinant4/recombinant4 < 0.05, N = 15–20 from 2 different preparations). *p < 0.05, **p < 0.001.
Fig. 11
Fig. 11
Knock-down of LRP1 and APOER2 in the APOE3 and APOE4 neuronal cultures by CRISPR/Cas9. The APOE3 and APOE4 neuronal primary cultures were treated by CRISPR/Cas9 system directed at either LRP1 (A) or APOER2 (B); Following this treatment, each culture was stained for the corresponding ApoE receptor, and the extent to which this treatment knocked down the targeted receptor was determined. A) CRISPR/Cas9 system directed at LRP1 resulted in the downregulation of LRP1 in both APOE3 neurons (APOE3 control = 1.00±0.06, APOE3- LRP1 AAv = 0.58±0.04, p < 0.0001, N = 83–89 from 9 different preparations) and APOE4 neurons (APOE4 control = 0.84±0.04, APOE4- LRP1 AAv = 0.56±0.05, p < 0.05, N = 84–89 from 9 different preparations). B) CRISPR/Cas9 system directed at APOER2 resulted in the downregulation of APOER2 in both APOE3 (APOE3 control = 1.00±0.08, APOE3- APOER2 AAv = 0.57±0.04, p < 0.0001, N = 60–105 from 7-8 different preparations) and APOE4 neurons (APOE4 control = 0.71±0.04, APOE4- APOER2 AAv = 0.45±0.04, p < 0.0001, N = 79–125 from 8-9 different preparations). *p < 0.05, ***p < 0.0001.
Fig. 12
Fig. 12
The effects of LRP1 knock-down on the receptors’ levels and their colocalization with early endosomes. APOE3 and APOE4 primary neurons were treated with CRISPR/Cas9 system utilizing guide RNA directed at LRP1. The results show that the downregulation of LRP1 (presented in Fig. 11) had no effect on the levels of the rest of the receptors APOER2, VEGFR, and IR (A) but it was, however, accompanied by downregulation in the levels of colocalization of the receptors with early endosomes in APOE4 neurons (B) (APOER2- APOE4 control = 0.44±0.02, APOE4-LRP1 AAv = 0.20±0.02, p < 0.0001, N = 50–53 from 5 different preparations. IR- APOE4 control = 0.53±0.03, APOE4-LRP1 AAv = 0.27±0.03, p < 0.0001, N = 34–40 from 4 different preparations. VEGFR- APOE4 control = 0.45±0.03, APOE4-LRP1 AAv = 0.16±0.02, p < 0.0001, N = 23–27 from 3 different preparations) LRP1 downregulation also resulted in reduction in the colocalization of VEGFR in the early endosomes of APOE3 neurons (APOE3 control = 0.35±0.03, APOE3-LRP1 AAv = 0.28±0.04, p < 0.05, N = 28–39 from 4 different preparations). *p < 0.05, ***p < 0.0001.
Fig. 13
Fig. 13
The effect of APOER2 knock-down on the receptor’s levels and colocalization with early endosomes. APOE3 and APOE4 primary neurons were treated with CRISPR/Cas9 directed at APOER2, after which the levels and the extent of colocalization of the receptors with early endosomes were evaluated. The results show that knock-down of APOER2 results in lower levels of LRP1 in APOE3 neurons (APOE3 control = 1.00±0.06, APOE3- APOER2 AAv = 0.67±0.05, p < 0.001, N = 78–89 from 8 different preparations) while not affecting the levels in APOE4 neurons nor the extent of colocalization of LRP1 with early endosomes. On the other hand, knock-down of APOER2 resulted in elevated levels of IR and VEGFR in APOE4 neurons (IR- APOE4 control = 0.54±0.04, APOE4- APOER2 AAv = 0.82±0.11, p < 0.05, N = 32-35 from 3 different preparations. VEGFR- APOE4 control = 0.64±0.05, APOE4- APOER2 Aav = 0.79±0.11, p = 0.24, N = 27–29 from 3 different preparations) and in lower levels of colocalization of those receptors with early endosomes (IR- APOE4 control = 0.53±0.03, APOE4- APOER2 Aav = 0.24±0.04, p < 0.0001, N = 34–38 from 3 different preparations. VEGFR- APOE4 control = 0.45±0.03 APOE4- APOER2 Aav = 0.20±0.02, p < 0.0001, N = 24–28 from 3 different preparations), with no evident effect in APOE3 neurons. *p < 0.05, **p < 0.001, ***p < 0.0001.

Similar articles

Cited by

References

    1. Safieh M, Korczyn AD, Michaelson DM (2019) APOE4: An emerging therapeutic target for Alzheimer’s disease. BMC Med 17, 64. - PMC - PubMed
    1. Balin BJ, Hudson AP (2014) Etiology and pathogenesis of late-onset Alzheimer’s disease. Curr Allergy Asthma Rep 14, 1–10. - PubMed
    1. Bertram L, Tanzi RE (2012) The genetics of Alzheimer’s disease. Prog Mol Biol Transl Sci 107, 79–100. - PubMed
    1. Naj AC, Schellenberg GD ; Alzheimer’s Disease Genetics Consortium (ADGC) (2017) Genomic variants, genes, and pathways of Alzheimer’s disease: An overview. Am J Med Genet B Neuropsychiatr Genet 174, 5–26. - PMC - PubMed
    1. Nikolac Perkovic M, Pivac N (2019) Genetic markers of Alzheimer’s disease. Adv Exp Med Biol 1192, 27–52. - PubMed

Publication types