. 2024 Jun;46(3):3149-3167.
doi: 10.1007/s11357-024-01068-5. Epub 2024 Jan 13.

Eliminating senescent cells by white adipose tissue-targeted senotherapy alleviates age-related hepatic steatosis through decreasing lipolysis

Affiliations

Eliminating senescent cells by white adipose tissue-targeted senotherapy alleviates age-related hepatic steatosis through decreasing lipolysis

Qi Tang et al. Geroscience. 2024 Jun.

Abstract

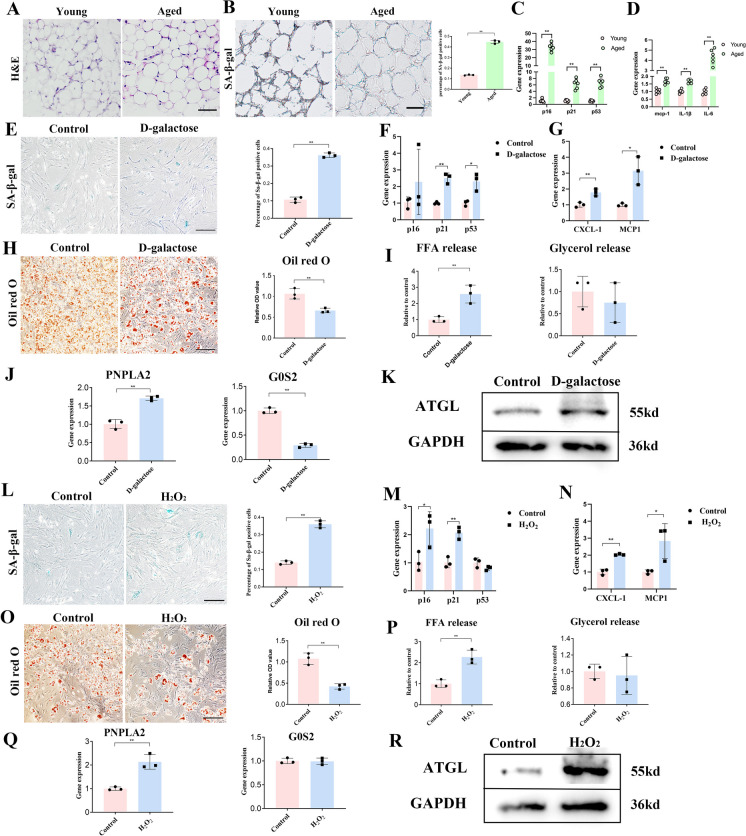
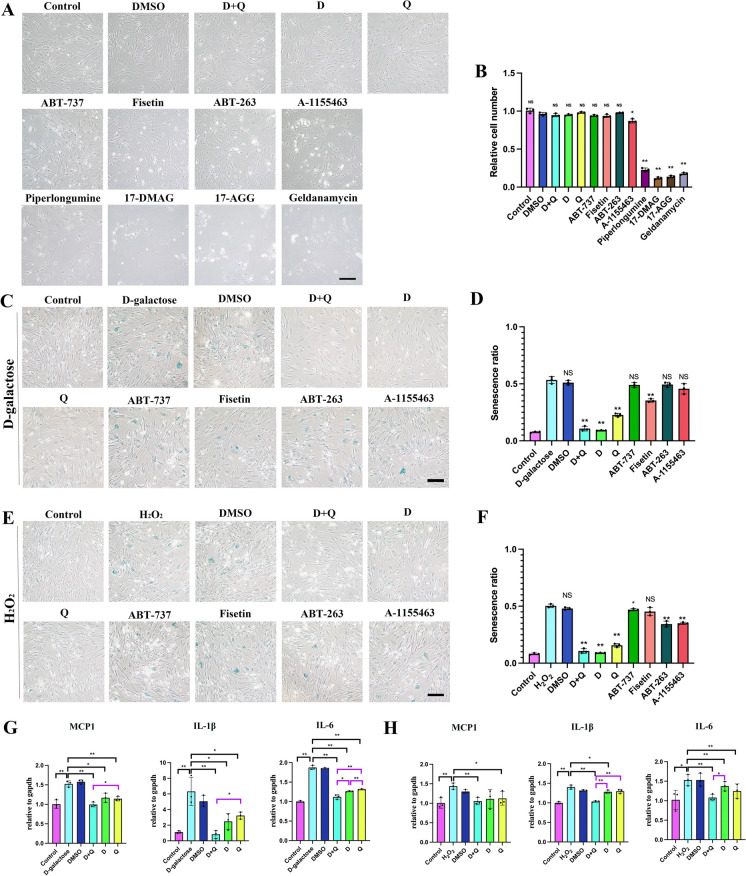
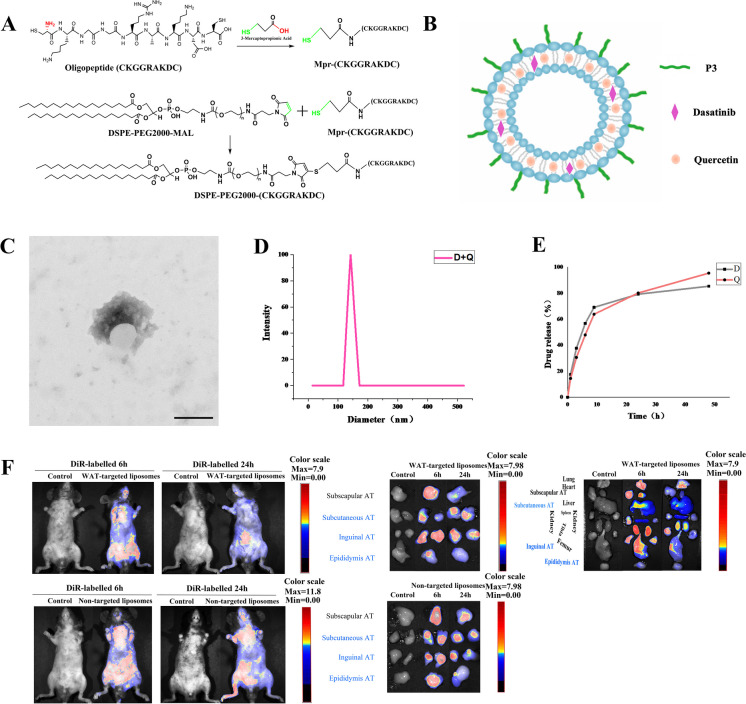
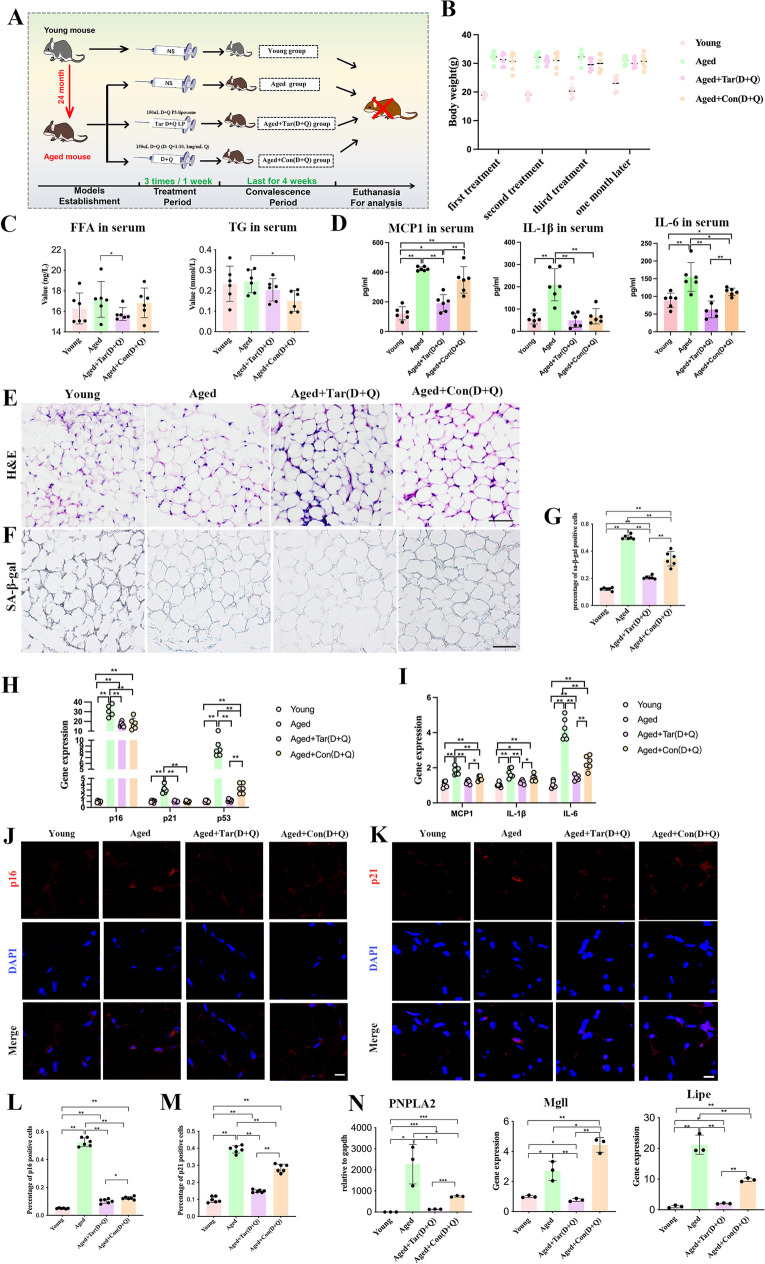
Cellular senescence is an important risk factor in the development of hepatic steatosis. Senolytics present therapeutic effects on age-related hepatic steatosis without eliminating senescent hepatocytes directly. Therefore, it highlights the need to find senolytics' therapeutic targets. Dysfunction of adipose tissue underlies the critical pathogenesis of lipotoxicity in the liver. However, the correlation between adipose tissue and hepatic steatosis during aging and its underlying molecular mechanism remains poorly understood. We explored the correlation between white adipose tissue (WAT) and the liver during aging and evaluated the effect of lipolysis of aged WAT on hepatic steatosis and hepatocyte senescence. We screened out the ideal senolytics for WAT and developed a WAT-targeted delivery system for senotherapy. We assessed senescence and lipolysis of WAT and hepatic lipid accumulation after treatment. The results displayed that aging accelerated cellular senescence and facilitated lipolysis of WAT. Free fatty acids (FFAs) generated by WAT during aging enhanced hepatic steatosis and induced hepatocyte senescence. The combined usage of dasatinib and quercetin was screened out as the ideal senolytics to eliminate senescent cells in WAT. To minimize non-specific distribution and enhance the effectiveness of senolytics, liposomes decorated with WAT affinity peptide P3 were constructed for senotherapy in vivo. In vivo study, WAT-targeted treatment eliminated senescent cells in WAT and reduced lipolysis, resulting in the alleviation of hepatic lipid accumulation and hepatocyte senescence when compared to non-targeted treatment, providing a novel tissue-targeted, effective and safe senotherapy for age-related hepatic steatosis.

Keywords: Cellular senescence; Hepatic steatosis; Lipolysis; Senolytics; White adipose tissue.


Conflict of interest statement

The authors declare no competing interests.

Figures

Fig. 1
Fig. 1
Aging accelerates hepatic lipid deposition. Six 8-week-old male mice were grouped as young mice, and six 24-month-old male mice were grouped as aged mice. A Body weights of mice. B The comparison of liver weight to body weight ratio in two groups. C Levels of FFA and TG were detected by ELISA assay in the liver tissue. D Sections of liver tissue were stained with oil red O (scale bar = 50 μm) to value the accumulation of lipids in the liver. E Sections of liver tissue were stained with BODIPY to show the lipid drops. The actin filaments and nuclei were visualized by phalloidin or DAPI (scale bar = 10 μm). F Sections of liver tissue were stained with H&E (scale bar = 50 μm). G Sections of liver tissue were stained with SA-β-gal (scale bar = 50 μm), and the percentage of SA-β-gal positive cells was shown to check cellular senescence. H mRNA levels of p16, p21, and p53 in the liver were determined by RT-qPCR. I mRNA levels of SASP factors in the liver were determined by RT-qPCR. All data are mean ± s.d. with 6 animals per group. For FFA and TG assessment (C), part of the liver was cut into pieces equally in quantity, and two liver pieces were mixed randomly in each group for value. Significant differences were indicated with *P < 0.05 and **P < 0.01
Fig. 2
Fig. 2
Senescence facilitates lipolysis of adipocytes. A Sections of WAT in aged and young mice were stained with H&E (scale bar = 50 μm). B Sections of WAT in aged and young mice were stained with SA-β-gal (scale bar = 50 μm) to assess the cellular senescence. The percentage of SA-β-gal positive cells was shown. C mRNA levels of p16, p21, and p53 in WAT of the two groups were determined by RT-qPCR. D mRNA levels of SASP factors in WAT of the two groups were determined by RT-qPCR. In D-galactose-induced senescent cell model, E adipose progenitor cells of control and D-galactose group were stained with SA-β-gal (scale bar = 200 μm), and the percentage of SA-β-gal positive cells was shown. F mRNA levels of p16, p21, and p53 were determined by RT-qPCR. G mRNA levels of CXCL-1 and MCP1 were shown. H After adipogenesis, adipocytes were stained with oil red O (scale bar = 200 μm), and relative OD value was shown. I FFA and glycerol release from adipocytes were checked. J mRNA levels of PNPLA2 and G0S2 were determined by RT-qPCR. K The protein expressions of ATGL detected by western blot analysis. In H2O2-induced senescent cell model, L adipose progenitor cells in control and H2O2 group were stained with SA-β-gal (scale bar = 200 μm), and percentage of SA-β-gal positive cells was shown. M mRNA levels of p16, p21, and p53 were determined by RT-qPCR. N mRNA levels of CXCL-1 and MCP1 were shown. O After adipogenesis, adipocytes were stained with oil red O (scale bar = 200 μm), and relative OD value was shown. P FFA and glycerol were released from adipocytes. Q mRNA levels of PNPLA2 and G0S2 were determined by RT-qPCR. R The protein expressions of ATGL detected by western blot analysis. Data are mean ± s.d. with 6 animals per group in vivo (AD) and with n = 3 per condition in vitro (ER). Significant differences were indicated with *P < 0.05 and **P < 0.01
Fig. 3
Fig. 3
FFA enhances hepatic steatosis and hepatocyte senescence. A Hepatocytes were immunofluorescence stained with BODIPY to assess the accumulation of lipids. The actin filaments and nuclei were visualized by phalloidin or DAPI (scale bar = 20 μm). B Hepatocytes were stained with SA-β-gal (scale bar = 50 μm) to value the cellular senescence, and the percentage of SA-β-gal positive cells was shown. C mRNA levels of p16, p21, and p53 were determined by RT-qPCR. D mRNA of SASP factors was determined by RT-qPCR. Data are mean ± s.d. n = 3 per condition. Significant differences were indicated with *P < 0.05 and **P < 0.01
Fig. 4
Fig. 4
The eliminating effects of senolytics on senescent adipose progenitor cells. A The optical images of young adipose progenitor cells treated with senolytics (10 μM) and D+Q (1 μM + 10 μM). B The relative cell number compared with the DMSO group was analyzed. CF The SA-β-gal staining of senescent adipose progenitor cells induced by D-galactose or H2O2 after treatments with senolytics, and quantitative analysis of senescence ratio was shown. G, H mRNA of SASP factors was determined by RT-qPCR. Differences were analyzed when compared with D-galatcose or H2O2-induced senescent cells, or within D, Q, and D+Q treatment groups. Significant differences were indicated with *P < 0.05 and **P < 0.01. Scale bar = 200 μm. All data are mean ± s.d. n = 3 per condition
Fig. 5
Fig. 5
Construction of WAT-targeted liposomes to deliver senolytics. A Synthetic routes of WAT-targeted liposomes. B The diagram of WAT-targeted liposomes. C The TEM image of WAT-targeted liposomes (scale bar = 200 μm). D Diameter of WAT-targeted liposomes. E In vitro drug release of WAT-targeted liposomes at different time points. F In vivo tracking of WAT-targeted liposomes and non-targeted liposomes in mice. All data are mean ± s.d. n = 3 per condition
Fig. 6
Fig. 6
Elimination of senescent cells by WAT-targeted liposomes. A Schematic diagram of grouping and treatment in animal experiments. B Mouse body weights of the four groups. C FFA and TG levels in serum were determined by ELISA assay. D SASP factor levels in serum were determined by ELISA assay. E Sections of WAT were stained with H&E (scale bar = 50 μm). F Sections of WAT were stained with SA-β-gal (scale bar = 50 μm), and G percentage of SA-β-gal positive cells was shown. H mRNA levels of p16, p21, and p53 were determined by RT-qPCR. I mRNA levels of SASP factors were determined by RT-qPCR. J Sections of WAT were stained with the p16 antibody (scale bar = 10 μm), and L the percentage of p16 positive cells was shown. K Sections of WAT were stained with the p21 antibody (scale bar = 10 μm), and M the percentage of p21 positive cells was shown. N mRNA levels of PNPLA2, Mgll, and Lipe were determined by RT-qPCR. All data were mean ± s.d. with 6 animals per group. Part of the WAT was cut into pieces equally in quantity, and two pieces were mixed randomly in each group for value (N). Significant differences were indicated with *P < 0.05 and **P < 0.01
Fig. 7
Fig. 7
WAT-targeted liposomes with senolytic treatment reduces hepatic lipid accumulation. A Liver weight to body weight ratios of mice in the four groups. B FFA and C TG levels in the liver. D, E Sections of the liver were stained with H&E and oil red O (scale bar = 50 μm). F Sections of the liver were immunostained with BODIPY to show the lipid drops. The actin filaments and nuclei were visualized by phalloidin or DAPI (scale bar = 10 μm). G mRNA levels of Cpt1α, Ucp2, Accα, Acox1, CD36, and Scd1 were determined by RT-qPCR. H Liver sections were stained with SA-β-gal (scale bar = 50 μm), and percentage of SA-β-gal positive cells was shown. I mRNA levels of p16, p21, and p53 were determined by RT-qPCR. J mRNA levels of SASP factors were determined by RT-qPCR. K Liver sections stained with p16 antibody (scale bar = 10 μm), and L the percentage of p16 positive cells was shown. N Liver sections stained with p21 antibody (scale bar = 20 μm), and M the percentage of p21 positive cells was shown. All data were shown as mean ± s.d. with 6 animals per group. For FFA (B) and TG (C) assessment and gene expressions (G) of the liver, the liver was cut into pieces equally in quantity, and two pieces were mixed randomly in each group. Significant differences were indicated with *P < 0.05 and **P < 0.01

Similar articles

Cited by

References

    1. da Costa JP, et al. A synopsis on aging-theories, mechanisms and future prospects. Ageing Res Rev. 2016;29:90–112. doi: 10.1016/j.arr.2016.06.005. - DOI - PMC - PubMed
    1. Palmer AK, Kirkland JL. Aging and adipose tissue: potential interventions for diabetes and regenerative medicine. Exp Gerontol. 2016;86:97–105. doi: 10.1016/j.exger.2016.02.013. - DOI - PMC - PubMed
    1. Childs BG, et al. Cellular senescence in aging and age-related disease: from mechanisms to therapy. Nat Med. 2015;21(12):1424–1435. doi: 10.1038/nm.4000. - DOI - PMC - PubMed
    1. van Deursen JM. The role of senescent cells in ageing. Nature. 2014;509(7501):439–446. doi: 10.1038/nature13193. - DOI - PMC - PubMed
    1. He S, Sharpless NE. Senescence in health and disease. Cell. 2017;169(6):1000–1011. doi: 10.1016/j.cell.2017.05.015. - DOI - PMC - PubMed

Publication types

LinkOut - more resources