. 2024 Jan 23;43(1):113660.
doi: 10.1016/j.celrep.2023.113660. Epub 2024 Jan 12.

A comparative evaluation of the strengths and potential caveats of the microglial inducible CreER mouse models

Affiliations

A comparative evaluation of the strengths and potential caveats of the microglial inducible CreER mouse models

Alicia M Bedolla et al. Cell Rep. .

Abstract

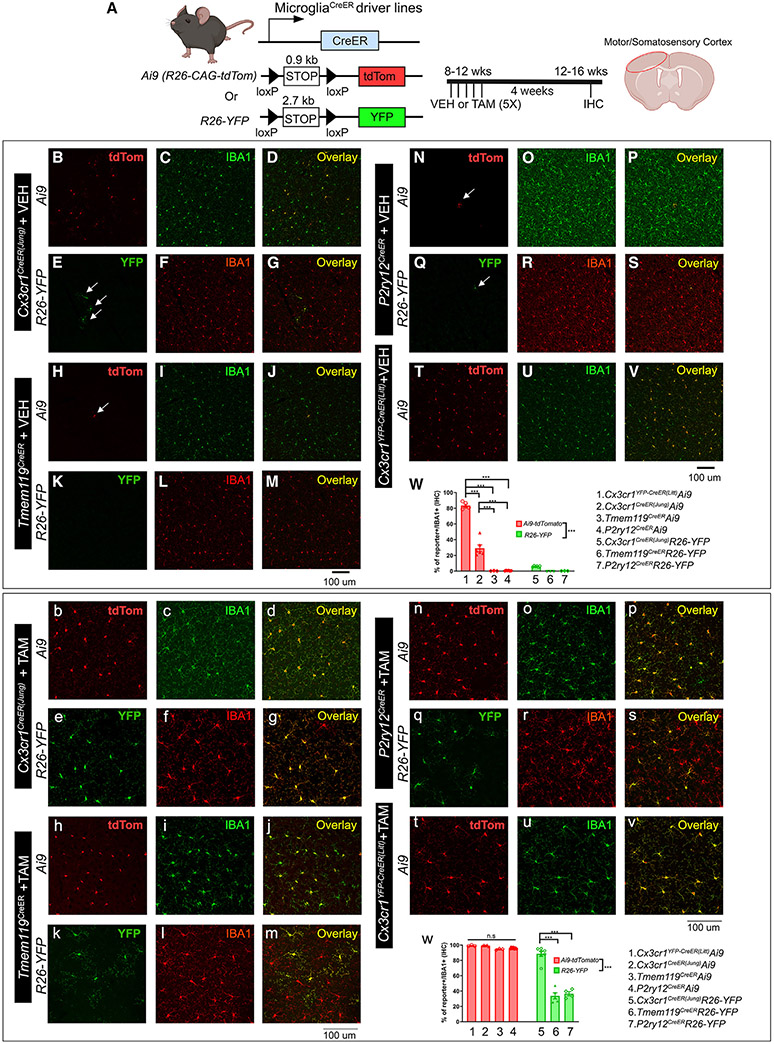
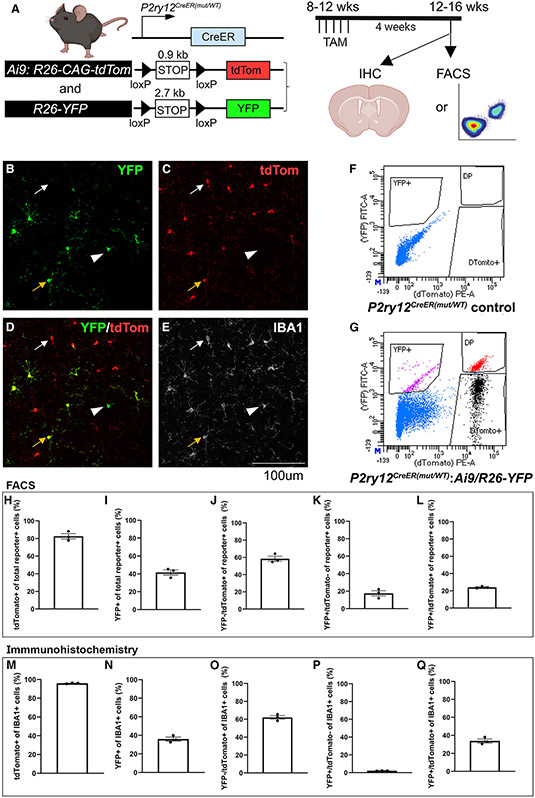
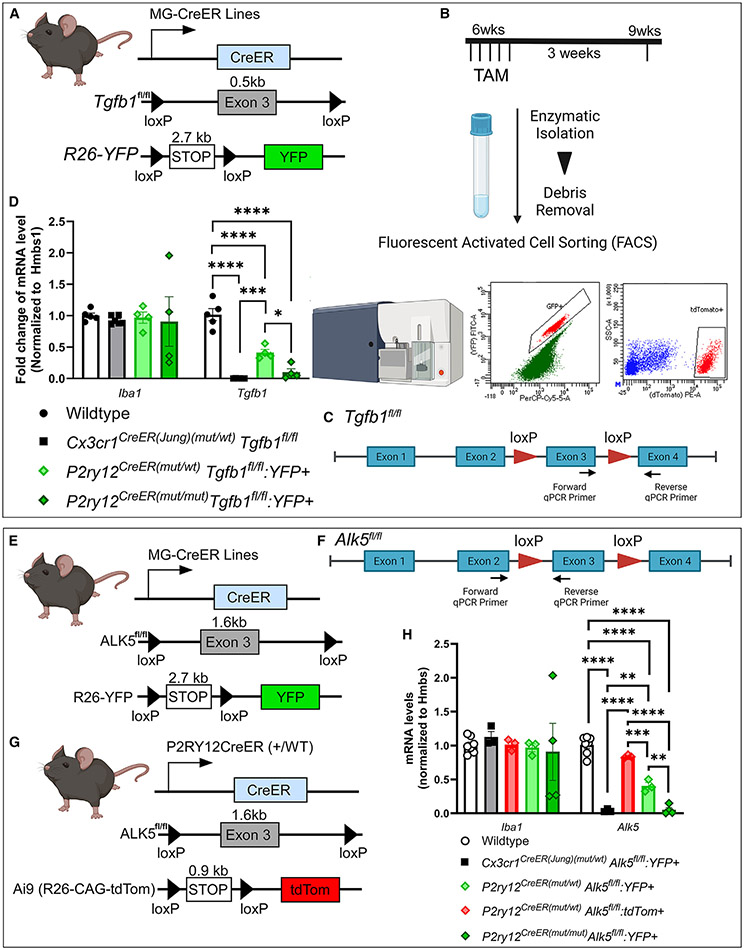
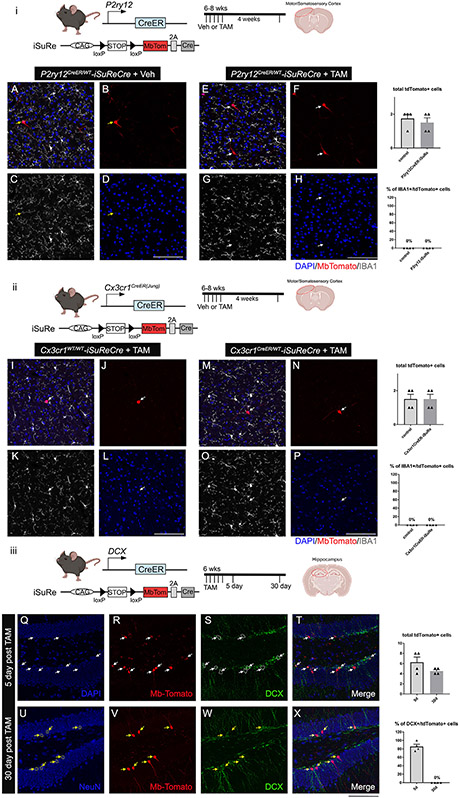
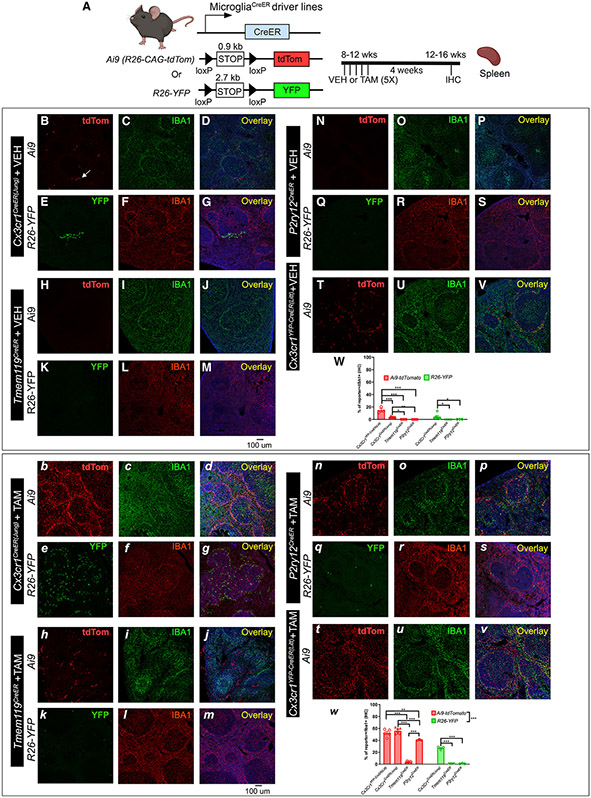
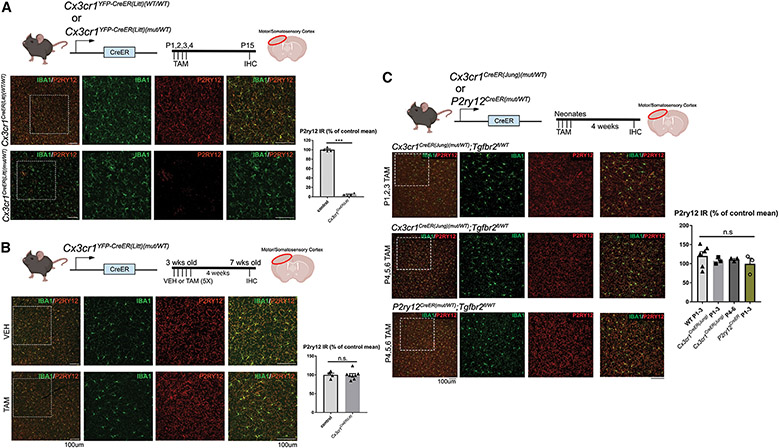
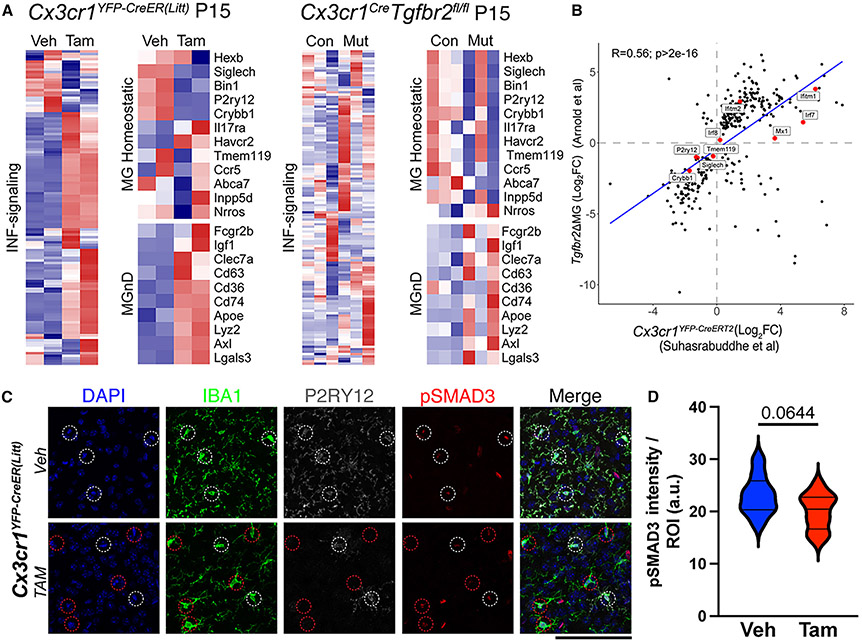
The recent proliferation of new Cre and CreER recombinase lines provides researchers with a diverse toolkit to study microglial gene function. To determine how best to apply these lines in studies of microglial gene function, a thorough and detailed comparison of their properties is needed. Here, we examined four different microglial CreER lines (Cx3cr1YFP-CreER(Litt), Cx3cr1CreER(Jung), P2ry12CreER, and Tmem119CreER), focusing on (1) recombination specificity, (2) leakiness (the degree of tamoxifen-independent recombination in microglia and other cells), (3) the efficiency of tamoxifen-induced recombination, (4) extraneural recombination (the degree of recombination in cells outside of the CNS, particularly myelo/monocyte lineages), and (5) off-target effects in the context of neonatal brain development. We identify important caveats and strengths for these lines, which will provide broad significance for researchers interested in performing conditional gene deletion in microglia. We also provide data emphasizing the potential of these lines for injury models that result in the recruitment of splenic immune cells.

Keywords: CP: Neuroscience; CX3CR1; Cre recombinase; P2RY12; inducible gene recombination; microglia; tmem119.


Conflict of interest statement

Declaration of interests The authors declare no competing interests.

Figures

Figure 1.
Figure 1.. Evaluation of the TAM-independent leakiness and the efficiency of TAM-dependent Cre recombination in the four different CreER driver lines using either the Ai9-tdTomato or R26-YFP reporter mouse lines
The experimental timeline is shown in (A). Representative images from each Cre driver and reporter line are shown (B–V for vehicle [VEH] treatment and b–v for TAM treatment). The Cre driver and the reporter line are indicated on the left. Quantification of reporter+ cells in the IBA1+ populations in the brain is shown in (W) (for VEH treatment) and (w) (for TAM treatment). Representative images are taken from the cortical region, which reflects the general and homogenous trend in the whole parenchyma. Each data point represents the average of 1 animal (the average for each animal is obtained by quantifying multiple brain sections at similar anatomical locations), and the average for each animal was used as a single data point for statistical analysis. Mean ± SEM. **p < 0.01, ***p < 0.001, two-way ANOVA, Tukey post hoc pairwise analysis. Ai9 vs. R26-YFP is significantly different as a factor (p < 0.001). Data were combined from 2 independent cohorts of mice. Scale bars, 100 μm. Compared with the two Cx3cr1CreER lines (Littman and Jung), Tmem119CreER and P2ry12CreER show less leakiness in the absence of TAM but a decreased recombination efficiency and mosaic recombination in microglia. See also Figures S1-S4.
Figure 2.
Figure 2.. Independent recombination of the two floxed alleles at the single-cell level in the P2ry12CreER double reporter (Ai9:R26-YFP) mouse line
Evaluation of the TAM-dependent recombination of either the Ai9-tdTomato or R26-YFP allele, which are both located in the R26 loci in a double reporter mouse in the P2ry12CreER line, suggests that, although, on a populational level, Ai9-tdTomato reporter has a higher probability of being recombined compared with the R26-YFP allele, at the single-cell level, the recombination of each individual allele can be independent and does not always follow the size of the floxed region rule. (A) Experimental timeline. (B–E) IHC evaluation of the recombination of microglia on either of the reporter expression. Note tdTomato+:YFP+ double-positive microglia (orange arrow), more abundant tdTomato+:YFP microglia (white arrow), and the less abundant YFP+:tdTomato microglia (white arrowhead). (F and G) Representative FACS plots for no color control or the double reporter flow analysis. (H–L) Graphs showing the percentage of cells based on reporter expression of total reporter+ cells from FACS-sorted double-positive cells; each data point is from a single FACS sample from a single animal. (M–Q) Graphs showing the percentage of cells based on reporter expression of total IBA1+ cells sampled from IHC on the cortex; each data point is the average of 3 sampled images from a single animal. Mean ± SEM. Scale bar, 100 μm. See also Table S1.
Figure 3.
Figure 3.. Evaluation of the gene deletion efficiency on distinct homozygous floxed target gene alleles in the Cx3cr1CreER(Jung) and P2ry12CreER drivers using real-time qPCR
(A–D) Animal genotype and experimental flow. Total mRNA levels are evaluated for the floxed exon in the Tgfb1 gene in YFP+ microglia sorted from the Cx3cr1CreER(Jung)(mut/WT), P2ry12CreER(mut/WT)Tgfb1fl/flR26-YFP, or P2ry12CreER(mut/mut)Tgfb1fl/fl-R26-YFP mice 3 weeks after TAM treatment. YFP+ cells were selected based on fluorescein isothiocyanate (FITC) wavelength to detect YFP and PerCP-Cy5.5 to help delineate the actual YFP signal from autofluorescence commonly seen in sorted brain cells. (E–H) Total mRNA levels are evaluated for the floxed exon in the Alk5 gene in either YFP+ microglia sorted from the Cx3cr1CreER(Jung)(mut/WT), P2ry12CreER(mut/WT)Alk5fl/flR26-YFP, or P2ry12CreER(mut/mut)Alk5fl/fl-R26-YFP mice or Ai9-tdTomato+ microglia from the P2ry12CreER(mutt/WT)Alk5fl/flAi9 mice 3 weeks after TAM treatment. Each data point represents the average of 1 animal (the average for each animal is obtained by averaging 3 technical replications of the real-time qPCR reaction for that animal), and the average for each animal was used as a single data point for statistical analysis. Mean ± SEM. **p < 0.01, ***p < 0.001, ****p < 0.0001 for two-way ANOVA, Tukey post hoc pairwise analysis. Data are pooled from samples sorted either with or without transcriptional and translational inhibitors. Our data show that no difference was observed in Tgfb1 gene or Alk5 gene expression in sorted microglia with or without the inhibitors (see Figure S5). Also, see Figure S6 for no changes in Tgfb1 or Alk5 mRNA in VEH-treated mice.
Figure 4.
Figure 4.. The iSuReCre mouse line successfully induces constitutive Cre-P2A-MbTomato expression in the DCXCreER mouse line, but not in the P2ry12CreER or Cx3cr1CreER(Jung) mouse line, after TAM treatment
(i) Illustration of P2ry12CreER mouse transgene constructs and experimental timeline. A–D) In the absence of TAM, there is no MbTomato expression in microglia with ectopic MbTomato expression in cells that demonstrate typical neuron morphology in the cortex and striatum (yellow arrow, mbTomato cell). (E–H) Treatment of TAM in mice does not induce MbTomato expression in microglia and presents with similar neuronal ectopic expression of MbTomato. (ii) Illustration of Cx3cr1CreER(Jung) mouse transgene constructs and experimental timeline. (I–L) In the absence of TAM, there is a pattern similar to the P2ry12CreER line. (M–P) Treatment of TAM in mice does not induce MbTomato expression in microglia and presents with similar neuronal ectopic expression of MbTomato. (Q–X) In contrast, in the DCXCreER-iSuReCre mice treated with TAM, 5 days post TAM treatment, DCX+ immature neuroblasts are labeled with MbTomato protein (white arrows), and 30 days post TAM treatment, MbTomato expression is mostly detected in DCXNEUN+ mature neurons (yellow arrows), supporting that the iSuReCre construct is able to be induced in a cohort of immature neuroblasts that mature later into NeuN+ neurons in the dentate gyrus of adult mice. Mean ± SEM. Scale bar, 100 μm.
Figure 5.
Figure 5.. Evaluation of the splenic TAM-independent and TAM-dependent Cre recombination in the four different CreER driver lines using either the Ai9-tdTomato or R26-YFP reporter mouse lines
The experimental timeline is shown in (A). Representative images from each Cre driver and reporter line (B–V for VEH treatment and b–v for TAM treatment). The Cre driver and the reporter line are indicated on the left. Quantification of reporter+ cells in the IBA1+ populations in the spleen is shown in (W) (for VEH treatment) and (w) (for TAM treatment). Each data point represents the average of 1 animal (the average for each animal is obtained by quantifying multiples spleen sections), and the average for each animal was used as a single data point for statistical analysis. Mean ± SEM. **p < 0.01, ***p < 0.001, two-way ANOVA, Tukey post-hoc pairwise analysis. Ai9 vs. R26-YFP is significantly different as a factor (p < 0.001 for the TAM-treated group). Data were combined from 2–3 independent cohorts of mice. Scale bar, 100 μm.
Figure 6.
Figure 6.. Evaluation of the dyshomeostatic microglia in different microglia-specific CreER drivers after TAM treatment at different ages
P2RY12 expression is used as a measure of dyshomeostasis in microglia. (A) Consistent with previous studies, we observe dyshomeostasis of microglia (indicated by loss of P2RY12 expression) across many regions in the neonatal Cx3cr1CreER(Litt)(mut/WT) mice treated with TAM. (B and C) This phenotype is not observed in (B) the adolescent (3-week-old) Cx3cr1YFP-CreER(Litt)(mut/WT) mice that received TAM treatment or (C) neonatal Cx3cr1CreER(Jung) (mut/WT) and P2ry12CreER (mut/WT) mice that received TAM on early neonatal days. Quantifications of P2RY12 immunoreactivity are shown in the bar charts next to the representative images for each line. Mean ± SEM. Scale bars, 100 μm.
Figure 7.
Figure 7.. Similarity in microglia phenotypes from neonatal TAM -induced Cx3cr1YFP-CreER(Litt) and Tgfbr2fl/fl;Cx3cr1Cre mice
(A) Transcriptomic phenotypes from P15 Cx3cr1CreER(Litt) (VEH vs. TAM) and Tgfbr2;Cx3cr1Cre (Tgfbr2fl/WT;Cre vs. Tgfbr2fl/fl;Cre) mice showing changes in INF signaling-related, MgND/DAM, and homeostatic gene expression. (B) Correlation between two datasets. (C) Brain sections from P15 Cx3cr1CreER(Litt) (VEH vs. TAM) mice stained for DAPI (blue), IBA1 (green), P2RY12 (gray), and pSMAD3 (red). (D) Quantification of pSMAD3 mean fluorescence intensity in individual microglia from each group shows no significant difference in pSMAD3 (mean ± SEM, p = 0.0644, Student’s t test). A red circle in (C), bottom row, indicates the P2RY12 microglia. Data were combined from 3 VEH-treated and 4 TAM-treated mice. Scale bars, 100 μm.

Update of

References

    1. Carroll JA, Race B, Williams K, Striebel JF, and Chesebro B (2021). Innate immune responses after stimulation with Toll-like receptor agonists in ex vivo microglial cultures and an in vivo model using mice with reduced microglia. J. Neuroinflammation 18, 194. - PMC - PubMed
    1. Nimmerjahn A, Kirchhoff F, and Helmchen F (2005). Resting microglial cells are highly dynamic surveillants of brain parenchyma in vivo. Science 308, 1314–1318. - PubMed
    1. Paolicelli RC, Bolasco G, Pagani F, Maggi L, Scianni M, Panzanelli P, Giustetto M, Ferreira TA, Guiducci E, Dumas L, et al. (2011). Synaptic pruning by microglia is necessary for normal brain development. Science 333, 1456–1458. - PubMed
    1. Schafer DP, Lehrman EK, and Stevens B (2013). The ‘Quad-partite’ Synapse: Microglia-synapse interactions in the developing and mature CNS. Glia 61, 24–36. - PMC - PubMed
    1. Crain JM, Nikodemova M, and Watters JJ (2015). Microglia express distinct M1 and M2 phenotypic markers in the postnatal and adult CNS in male and female mice. J. Neuroscience 91, 1143–1151. - PMC - PubMed

LinkOut - more resources