

Longitudinal flortaucipir, metabolism and volume differ between phonetic and prosodic speech apraxia
- PMID: 38217867
- PMCID: PMC11068100
- DOI: 10.1093/brain/awae016
Longitudinal flortaucipir, metabolism and volume differ between phonetic and prosodic speech apraxia
Abstract
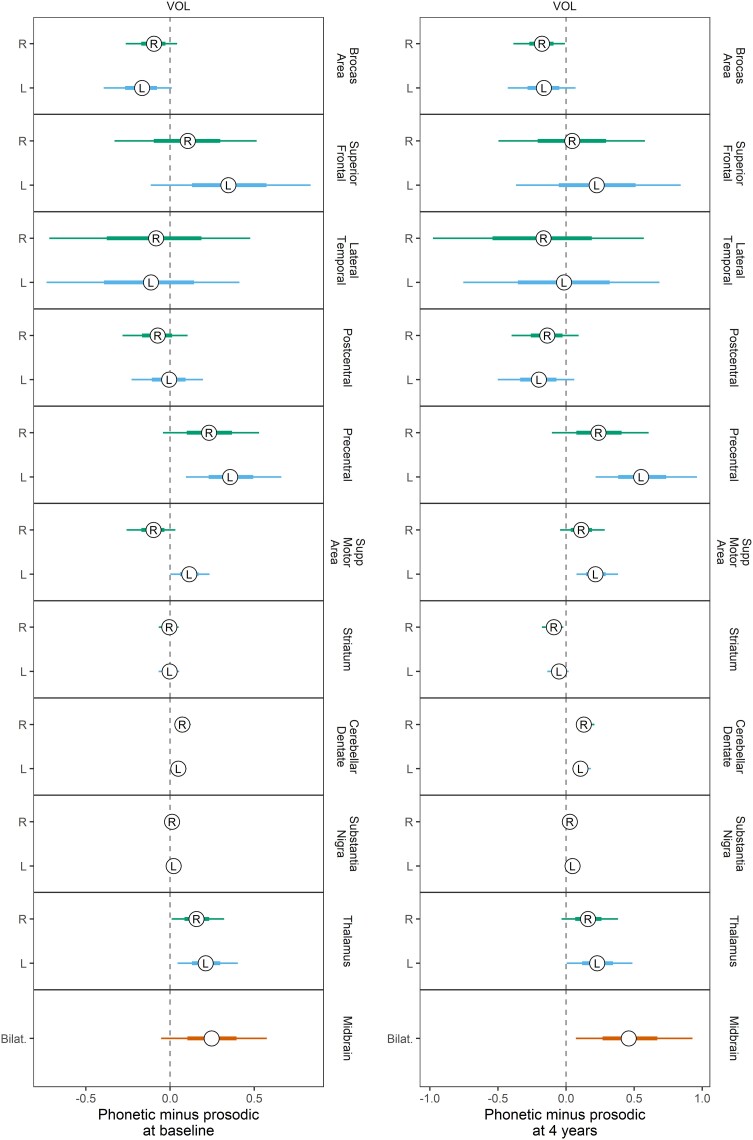
Progressive apraxia of speech (PAOS) is a neurodegenerative motor-speech disorder that most commonly arises from a four-repeat tauopathy. Recent studies have established that progressive apraxia of speech is not a homogenous disease but rather there are distinct subtypes: the phonetic subtype is characterized by distorted sound substitutions, the prosodic subtype by slow and segmented speech and the mixed subtype by a combination of both but lack of predominance of either. There is some evidence that cross-sectional patterns of neurodegeneration differ across subtypes, although it is unknown whether longitudinal patterns of neurodegeneration differ. We examined longitudinal patterns of atrophy on MRI, hypometabolism on 18F-fluorodeoxyglucose-PET and tau uptake on flortaucipir-PET in a large cohort of subjects with PAOS that had been followed for many years. Ninety-one subjects with PAOS (51 phonetic, 40 prosodic) were recruited by the Neurodegenerative Research Group. Of these, 54 (27 phonetic, 27 prosodic) returned for annual follow-up, with up to seven longitudinal visits (total visits analysed = 217). Volumes, metabolism and flortaucipir uptake were measured for subcortical and cortical regions, for all scans. Bayesian hierarchical models were used to model longitudinal change across imaging modalities with PAOS subtypes being compared at baseline, 4 years from baseline, and in terms of rates of change. The phonetic group showed smaller volumes and worse metabolism in Broca's area and the striatum at baseline and after 4 years, and faster rates of change in these regions, compared with the prosodic group. There was also evidence of faster spread of hypometabolism and flortaucipir uptake into the temporal and parietal lobes in the phonetic group. In contrast, the prosodic group showed smaller cerebellar dentate, midbrain, substantia nigra and thalamus volumes at baseline and after 4 years, as well as faster rates of atrophy, than the phonetic group. Greater hypometabolism and flortaucipir uptake were also observed in the cerebellar dentate and substantia nigra in the prosodic group. Mixed findings were observed in the supplementary motor area and precentral cortex, with no clear differences observed across phonetic and prosodic groups. These findings support different patterns of disease spread in PAOS subtypes, with corticostriatal patterns in the phonetic subtype and brainstem and thalamic patterns in the prosodic subtype, providing insight into the pathophysiology and heterogeneity of PAOS.
Keywords: FDG-PET; MRI; apraxia of speech; flortaucipir; neurodegeneration.
© The Author(s) 2024. Published by Oxford University Press on behalf of the Guarantors of Brain. All rights reserved. For commercial re-use, please contact reprints@oup.com for reprints and translation rights for reprints. All other permissions can be obtained through our RightsLink service via the Permissions link on the article page on our site—for further information please contact journals.permissions@oup.com.
Conflict of interest statement
The authors report no competing interests.
Figures


Similar articles
-
Multimodal cross-examination of progressive apraxia of speech by diffusion tensor imaging-based tractography and Tau-PET scans.Hum Brain Mapp. 2024 Jun 1;45(8):e26704. doi: 10.1002/hbm.26704. Hum Brain Mapp. 2024. PMID: 38825988 Free PMC article.
-
Diffusion tensor imaging-based multi-fiber tracking reconstructions can regionally differentiate phonetic versus prosodic subtypes of progressive apraxia of speech.Cortex. 2024 Feb;171:272-286. doi: 10.1016/j.cortex.2023.08.019. Epub 2023 Nov 8. Cortex. 2024. PMID: 38061209 Free PMC article.
-
Prosodic and phonetic subtypes of primary progressive apraxia of speech.Brain Lang. 2018 Sep;184:54-65. doi: 10.1016/j.bandl.2018.06.004. Epub 2018 Jul 4. Brain Lang. 2018. PMID: 29980072 Free PMC article.
-
Spatial patterns of elevated magnetic susceptibility in progressive apraxia of speech.Neuroimage Clin. 2023;38:103394. doi: 10.1016/j.nicl.2023.103394. Epub 2023 Mar 28. Neuroimage Clin. 2023. PMID: 37003130 Free PMC article.
-
Tau-PET imaging with [18F]AV-1451 in primary progressive apraxia of speech.Cortex. 2018 Feb;99:358-374. doi: 10.1016/j.cortex.2017.12.021. Epub 2018 Jan 2. Cortex. 2018. PMID: 29353121 Free PMC article.
References
-
- Darley FL. Lacunae and research approaches to them. In: Milliken C, Darley FL, eds. Brain mechanisms underlying speech and language. Grune & Stratton; 1967:236–240.
-
- Darley FL. Aphasia: Input and output disturbances in speech and language processing. The American Speech and Hearing Association; 1969.
-
- Duffy JR. Apraxia of speech in degenerative neurologic disease. Aphasiology. 2006;20:511–527.
Publication types
MeSH terms
Substances
Grants and funding
LinkOut - more resources
Full Text Sources
