. 2024 Mar 29;194(4):2564-2579.
doi: 10.1093/plphys/kiad675.

Primary, seminal and lateral roots of maize show type-specific growth and hydraulic responses to water deficit

Affiliations

Primary, seminal and lateral roots of maize show type-specific growth and hydraulic responses to water deficit

Virginia Protto et al. Plant Physiol. .

Abstract

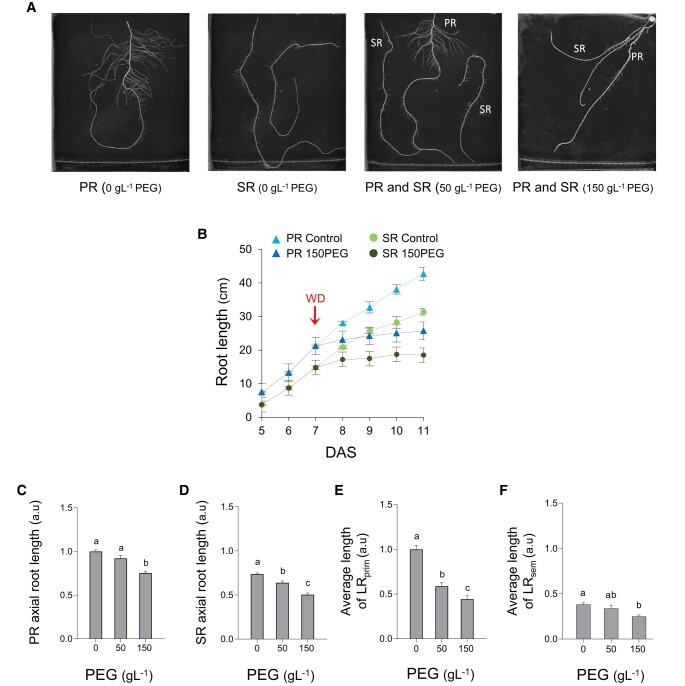
The water uptake capacity of a root system is determined by its architecture and hydraulic properties, which together shape the root hydraulic architecture. Here, we investigated root responses to water deficit (WD) in seedlings of a maize (Zea mays) hybrid line (B73H) grown in hydroponic conditions, taking into account the primary root (PR), the seminal roots (SR), and their respective lateral roots. WD was induced by various polyethylene glycol concentrations and resulted in dose-dependent inhibitions of axial and lateral root growth, lateral root formation, and hydraulic conductivity (Lpr), with slightly distinct sensitivities to WD between PR and SR. Inhibition of Lpr by WD showed a half-time of 5 to 6 min and was fully (SR) or partially (PR) reversible within 40 min. In the two root types, WD resulted in reduced aquaporin expression and activity, as monitored by mRNA abundance of 13 plasma membrane intrinsic protein (ZmPIP) isoforms and inhibition of Lpr by sodium azide, respectively. An enhanced suberization/lignification of the epi- and exodermis was observed under WD in axial roots and in lateral roots of the PR but not in those of SR. Inverse modeling revealed a steep increase in axial conductance in root tips of PR and SR grown under WD that may be due to the decreased growth rate of axial roots in these conditions. Overall, our work reveals that these root types show quantitative differences in their anatomical, architectural, and hydraulic responses to WD, in terms of sensitivity, amplitude and reversibility. This distinct functionalization may contribute to integrative acclimation responses of whole root systems to soil WD.


Conflict of interest statement

Conflict of interest statement. None declared.

Figures

Figure 1.
Figure 1.
RSA response of PR and SR to PEG-induced WD. A) Representative images of PR or SR of plants exposed to the indicated PEG concentration for 4 d. B) Growth kinetics of PR (blue triangles) and SR (green circles) in control (light blue, light green) or 150PEG (dark blue, dark green) conditions. Red arrow indicates the time of PEG application (cumulated data from two independent plant cultures; PR: n = 38, SR: n = 48). C to F) Axial length of PR (C), axial length of SR (D), LRprim length (E), and LRsem length (F) after 4 d in the presence of the indicated PEG concentration. Data in (C) and (D) are normalized to PR length in control conditions while data in (E) and (F) are normalized to LRprim length in control conditions. For (C) to (F), the figure shows cumulated data from seven independent experiments (PR: n = 35 to 75; SR: n = 50 to 120). Error bars indicate SEM. For each root type, different letters indicate statistically different values (ANOVA followed by Tukey test; P < 0.05).
Figure 2.
Figure 2.
Root hydraulic response of PR and SR to WD. Lpr of individual PR (A) or SR (B) excised from plants grown for 4 d in the presence of the indicated PEG concentration. Cumulated data from eight independent plant cultures for 0 and 150 g L−1 PEG (PR: n = 76 to 82; SR: n = 54 to 67) and three independent plant cultures for 50 g L−1 PEG (PR: n = 20; SR: n = 15). Error bars indicate SEM. For each root type, different letters indicate statistically different values (ANOVA followed by Tukey test; P < 0.05).
Figure 3.
Figure 3.
Effects of azide on root hydraulics. Lpr of PR and SR of plants grown in control conditions (A) or after 4 d of a 150PEG treatment (B), and measured in the absence (−) or presence (+) of 1 mM sodium azide. Cumulated data from two independent plant cultures (PR: n = 18 to 28; SR: n = 16 to 26). Error bars indicate SEM. For each root type, different letters indicate statistically different values (ANOVA followed by Tukey test; P < 0.05).
Figure 4.
Figure 4.
Kinetic analysis of Lpr in PR and SR in response to a sudden change in PEG concentration in the bathing solution. Plants grown in control (triangle) or 150PEG (circles) conditions for 4 d were transferred at time = 0 to a 150PEG or control solution, respectively. Lpr of PR (A) or SR (B) was measured at the indicated time after transfer. Cumulated data from five independent plant cultures for PR (n = 16 to 24), and three independent plant cultures for SR (n = 15). Error bars indicate Se. The experimental data were fitted using a one-phase decay exponential function.
Figure 5.
Figure 5.
Effects of a 4-d-long 150PEG treatment on relative expression of selected ZmPIP1 and ZmPIP2 genes. mRNA abundance of the most highly expressed ZmPIP1 (ZmPIP1;1, ZmPIP1;5) and ZmPIP2 (ZmPIP2;1, ZmPIP2;5, ZmPIP2;6) genes in LR (A) and in the unbranched zone (B) of PR and SR. mRNA abundance was monitored under control conditions (WD: −) or after 4 d of a 150PEG treatment (WD: +). Cumulated data from three independent biological repeats (each with four segments from four independent roots for each zone). Error bars indicate SEM. For each root type, different letters indicate statistically different values (Unpaired t test; P < 0.05).
Figure 6.
Figure 6.
Relative expression of selected ZmPIP1 and ZmPIP2 genes in the unbranched zone of PR and SR after short-term (1 h) change in PEG concentration in the root bathing solution. The figure shows the relative mRNA abundance of the indicated ZmPIP in PR (A) and SR (B). The left-hand side of each panel shows PIP expression in roots of 11-d-old plants grown in hydroponic control conditions during the last 4 d (WD: −) and shifted to a 150PEG solution for 1 h (WD: +). Conversely, the right-hand side of each panel shows PIP relative expression in roots of plants of the same age but grown in a 150PEG solution during the last 4 d (WD: +) and shifted to a control solution (WD: −) for 1 h. Cumulated data from two independent biological repeats (each with four segments from four independent roots). Error bars indicate SEM. For each root type, different letters indicate statistically different values (Unpaired t test; P < 0.05).
Figure 7.
Figure 7.
Deposition of suberin and lignin in PR and SR. A) Schematic representation of PR or SR grown in control or 150PEG conditions and separated in three segments. Segment III was the oldest one, near the root base, whereas segment I, near the root tip, was the most recently formed. B) Cross-section of a PR with arrows indicating the anatomical traits that were analyzed. Roots were stained with Auramine O for suberin and lignin quantification. C, D) Quantification of suberin/lignin in endodermis of PR (C) and SR (D). Cumulated data from two independent plant cultures (PR: n = 12 to 14; SR n = 14 to 16). Error bars indicate SEM. For each root type and segment, different letters indicate statistically different values (unpaired t test; P < 0.05).
Figure 8.
Figure 8.
Deposition of suberin and lignin in LR. Plants were grown under control (WD: −) or 150PEG (WD: +) conditions and roots were stained with Auramine O for suberin and lignin quantification in the following tissues: exodermis of LRprim (A) and LRsem (B); epidermis of LRprim (C) and LRsem (D); endodermis of LRprim (E) and LRsem (F). Cumulated data from two independent plant cultures normalized to the LRprim control. LRprim control, n = 12; LRprim 150PEG, n = 12; LRsem control, n = 4; LRsem 150PEG, n = 7. Error bars indicate Se. For each root type, different letters indicate statistically different values (Unpaired t test; P < 0.05).
Figure 9.
Figure 9.
Model-derived hydraulic parameters of PR and SR under WD. A) Radial hydraulic conductivity (k) of PR and SR of plants grown in control (CTR) and 150PEG (WD) conditions. Each box indicates the 25th and 75th percentiles, while the line inside indicates the median value, and the T bars mark the 5th and 95th percentiles. The “x” and open square correspond to the extreme values and the means, respectively. B) Variations of axial conductance (K) as a function of distance to root tip. The solid lines represent lowest fits done on K profiles of CTR PR (black; n = 8), WD PR (blue; n = 8), CTR SR (dashed black; n = 7) and WD SR (orange, n = 8). The dot lines delineate the corresponding 95% confidence intervals. C) Variations of axial conductance (K) as a function of time after sowing (root age). The figure represents the same data (with same conventions) as in (B).

Similar articles

Cited by

References

    1. Ahmed MA, Zarebanadkouki M, Kaestner A, Carminati A. Measurements of water uptake of maize roots: the key function of lateral roots. Plant Soil. 2016:398(1–2):59–77. 10.1007/s11104-015-2639-6 - DOI
    1. Ahmed MA, Zarebanadkouki M, Meunier F, Javaux M, Kaestner A, Carminati A. Root type matters: measurement of water uptake by seminal, crown, and lateral roots in maize. J Exp Bot. 2018:69(5):1199–1206. 10.1093/jxb/erx439 - DOI - PMC - PubMed
    1. Aroca R, Amodeo G, Fernández-Illescas S, Herman EM, Chaumont FO, Chrispeels MJ. The role of aquaporins and membrane damage in chilling and hydrogen peroxide induced changes in the hydraulic conductance of maize roots. Plant Physiol. 2005:137(1):341–353. 10.1104/pp.104.051045 - DOI - PMC - PubMed
    1. Aroca R, Porcel R, Ruiz-Lozano JM. Regulation of root water uptake under abiotic stress conditions. J Exp Bot. 2012:63(1):43–57. 10.1093/jxb/err266 - DOI - PubMed
    1. Bauget F, Protto V, Pradal C, Boursiac Y, Maurel C. A root functional-structural model allows assessment of the effects of water deficit on water and solute transport parameters. J Exp Bot. 2023:74(5):1594–1608. 10.1093/jxb/erac471 - DOI - PMC - PubMed