

Multiomics analysis reveals that microbiota regulate fat and muscle synthesis in chickens
- PMID: 38218114
- PMCID: PMC10821598
- DOI: 10.1016/j.psj.2023.103417
Multiomics analysis reveals that microbiota regulate fat and muscle synthesis in chickens
Abstract
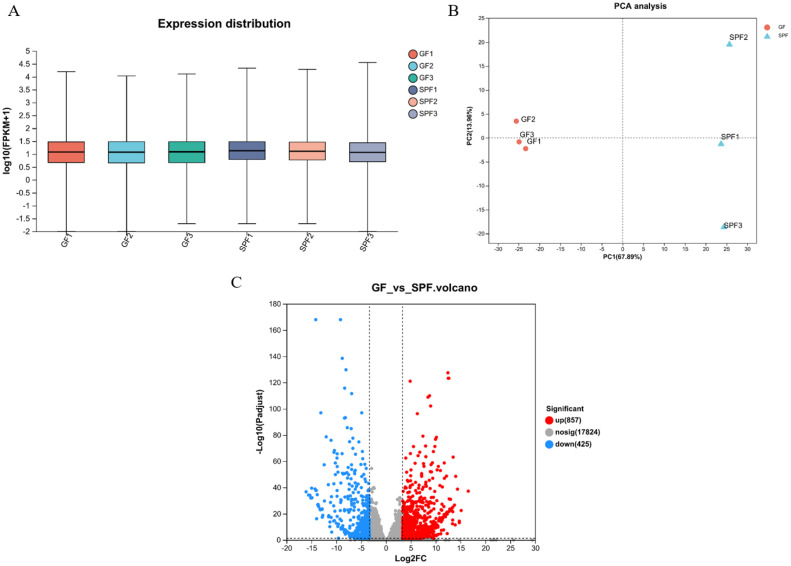
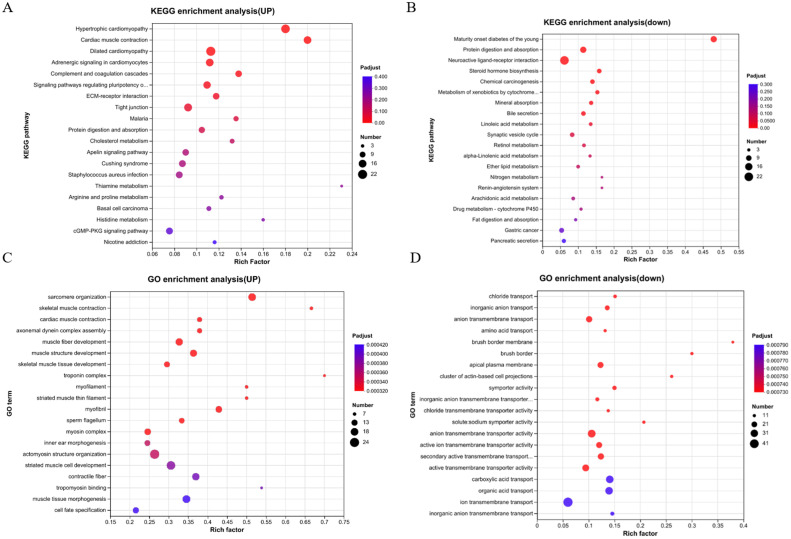
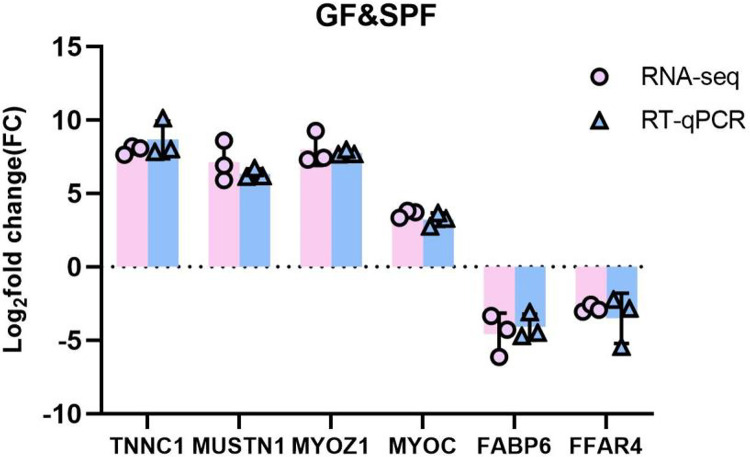
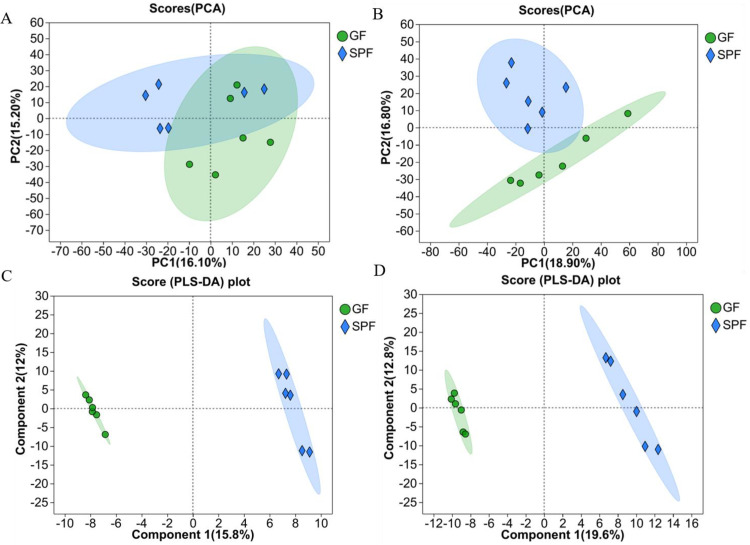
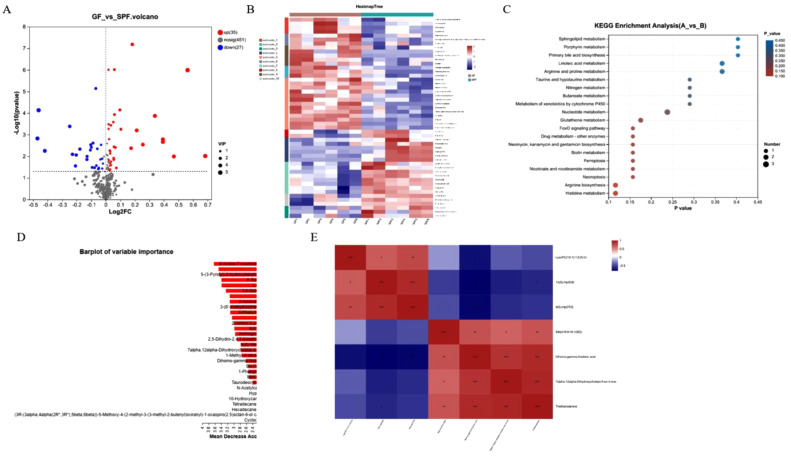
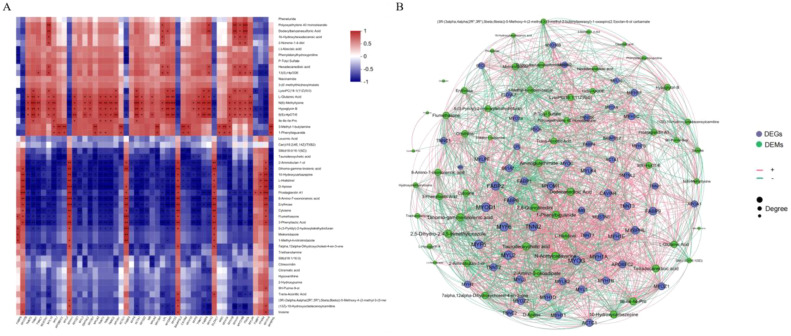
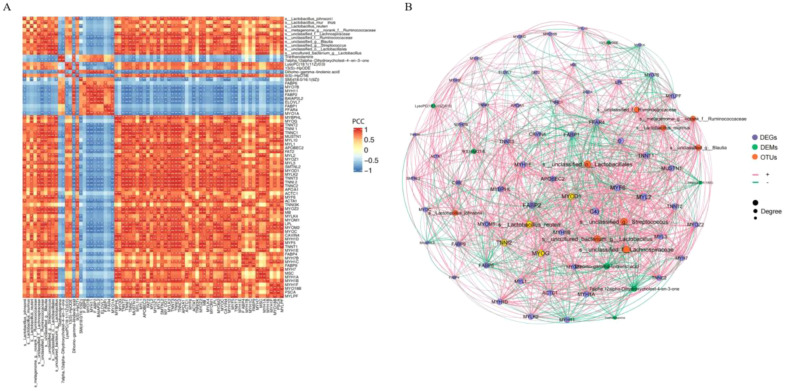
Intestinal microbiota regulates the host metabolism, including fat metabolism and muscle development in mammals; however, studies on the interactions between the gut microbiome and in chickens with respect to fat metabolism and muscle development are still rare. We established a germ-free (GF) chicken model to determine the transcriptomes and metabolomes of GF and specific-pathogen-free (SPF) chickens. Transcriptome analysis showed 1,282 differentially expressed genes (DEGs) in GF and SPF chickens. The expression levels of some genes related to muscle formation were very high in SPF chickens but low in GF chickens, suggesting that GF chickens had poorer muscle development ability. In contrast, the expression levels of some fat synthesis-related genes were very low in SPF chickens but high in GF chickens, suggesting that GF chickens had a more potent fat-synthesizing ability. Metabolome analysis revealed 62 differentially expressed metabolites (DEMs) in GF and SPF chickens, of which 35 were upregulated and 27 were downregulated. Furthermore, the Pearson correlation coefficient (PCC) was calculated, and an interaction network was constructed to visualize the crosstalk between the genes, metabolites, and gut microbiota in GF and SPF chickens. The top 10 gut microbiota were positively correlated with lipid metabolism including13(S)-HpODE and 9(S)-HpOTrE, and genes related to muscle development, while were negatively correlated with genes related to fat synthesis. In conclusion, this study indicated that chicken intestinal microbiota regulate host metabolism, inhibit fat synthesis, and may promote muscle development.
Keywords: GF chicken; fat accumulation; intestinal microbes; metabolism; muscle development.
Copyright © 2023 The Authors. Published by Elsevier Inc. All rights reserved.
Figures
Similar articles
-
Dietary fat and gut microbiota interactions determine diet-induced obesity in mice.Mol Metab. 2016 Oct 13;5(12):1162-1174. doi: 10.1016/j.molmet.2016.10.001. eCollection 2016 Dec. Mol Metab. 2016. PMID: 27900259 Free PMC article.
-
Integrated omics analysis reveals differences in gut microbiota and gut-host metabolite profiles between obese and lean chickens.Poult Sci. 2022 Nov;101(11):102165. doi: 10.1016/j.psj.2022.102165. Epub 2022 Sep 5. Poult Sci. 2022. PMID: 36179649 Free PMC article.
-
Galacto-oligosaccharides and xylo-oligosaccharides affect meat flavor by altering the cecal microbiome, metabolome, and transcriptome of chickens.Poult Sci. 2022 Nov;101(11):102122. doi: 10.1016/j.psj.2022.102122. Epub 2022 Aug 30. Poult Sci. 2022. PMID: 36167016 Free PMC article.
-
Microbiota protect against frailty and loss of skeletal muscle, and maintain inflammatory tone during aging in mice.Am J Physiol Cell Physiol. 2025 Mar 1;328(3):C887-C894. doi: 10.1152/ajpcell.00869.2024. Epub 2025 Feb 10. Am J Physiol Cell Physiol. 2025. PMID: 39925101
-
Characterization of the serum and liver proteomes in gut-microbiota-lacking mice.Int J Med Sci. 2017 Feb 23;14(3):257-267. doi: 10.7150/ijms.17792. eCollection 2017. Int J Med Sci. 2017. PMID: 28367086 Free PMC article.
Cited by
-
Effects of different photoperiods on melatonin level, cecal microbiota and breast muscle morphology of broiler chickens.Front Microbiol. 2025 Mar 25;16:1504264. doi: 10.3389/fmicb.2025.1504264. eCollection 2025. Front Microbiol. 2025. PMID: 40201434 Free PMC article.
-
Effect of cecal microbiota transplantation on peripheral 5-hydroxytryptamine and breast muscle glucose metabolism in long-photoperiod broilers.Poult Sci. 2025 Aug;104(8):105225. doi: 10.1016/j.psj.2025.105225. Epub 2025 Apr 28. Poult Sci. 2025. PMID: 40398302 Free PMC article.
References
-
- Boyd F.M., Edwards H.M., Jr Fat absorption by germ-free chicks. Poult. Sci. 1967;46:1481–1483. - PubMed
-
- Fan Y.Y., Ramos K.S., Chapkin R.S. Dietary gamma-linolenic acid suppresses aortic smooth muscle cell proliferation and modifies atherosclerotic lesions in apolipoprotein E knockout mice. J. Nutr. 2001;131:1675–1681. - PubMed
MeSH terms
LinkOut - more resources
Full Text Sources
