. 2024 Feb:80:101880.
doi: 10.1016/j.molmet.2024.101880. Epub 2024 Jan 11.

Antibody blockade of activin type II receptors preserves skeletal muscle mass and enhances fat loss during GLP-1 receptor agonism

Affiliations

Antibody blockade of activin type II receptors preserves skeletal muscle mass and enhances fat loss during GLP-1 receptor agonism

Elizabeth Nunn et al. Mol Metab. 2024 Feb.

Abstract

Objective: Glucagon-like peptide 1 (GLP-1) receptor agonists reduce food intake, producing remarkable weight loss in overweight and obese individuals. While much of this weight loss is fat mass, there is also a loss of lean mass, similar to other approaches that induce calorie deficit. Targeting signaling pathways that regulate skeletal muscle hypertrophy is a promising avenue to preserve lean mass and modulate body composition. Myostatin and Activin A are TGFβ-like ligands that signal via the activin type II receptors (ActRII) to antagonize muscle growth. Pre-clinical and clinical studies demonstrate that ActRII blockade induces skeletal muscle hypertrophy and reduces fat mass. In this manuscript, we test the hypothesis that combined ActRII blockade and GLP-1 receptor agonism will preserve muscle mass, leading to improvements in skeletomuscular and metabolic function and enhanced fat loss.

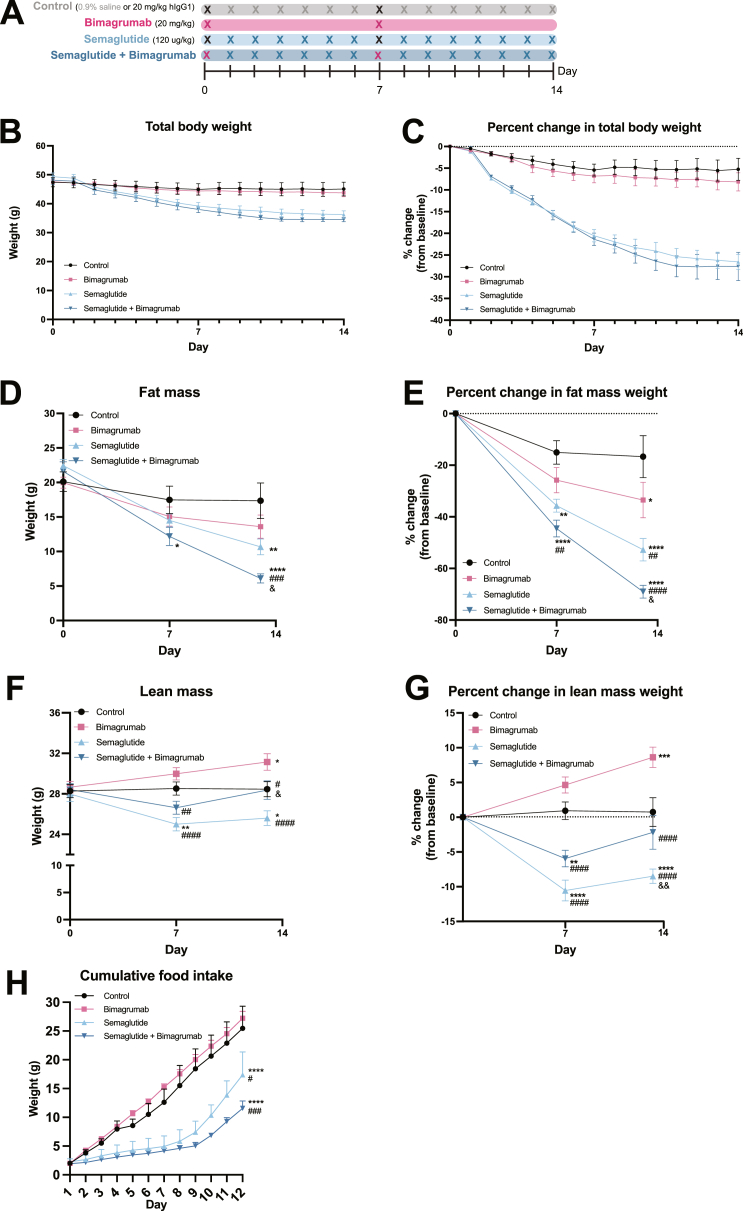
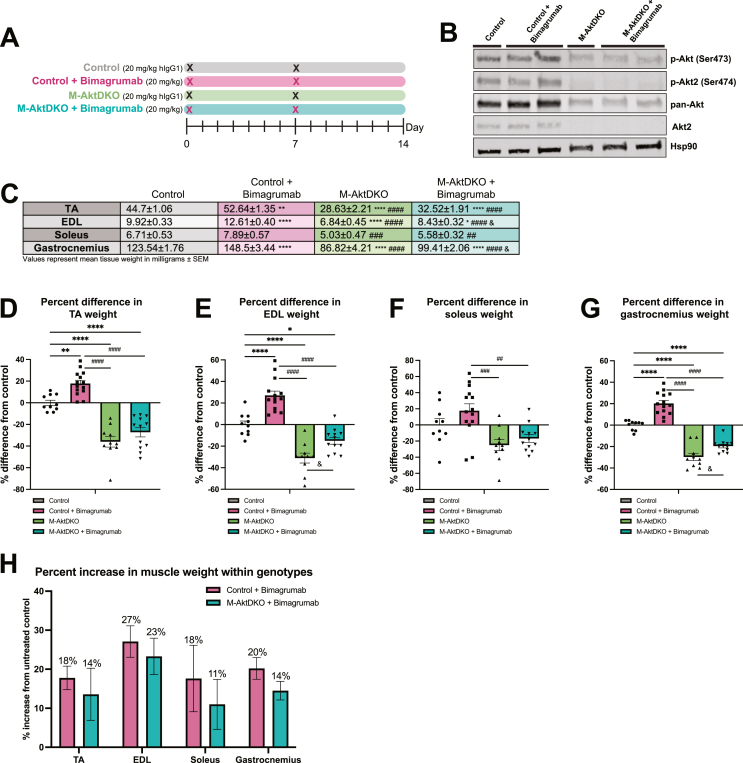
Methods: In this study, we explore the therapeutic potential of bimagrumab, a monoclonal antibody against ActRII, to modify body composition alone and during weight loss induced by GLP-1 receptor agonist semaglutide in diet-induced obese mice. Mechanistically, we define the specific role of the anabolic kinase Akt in mediating the hypertrophic muscle effects of ActRII inhibition in vivo.

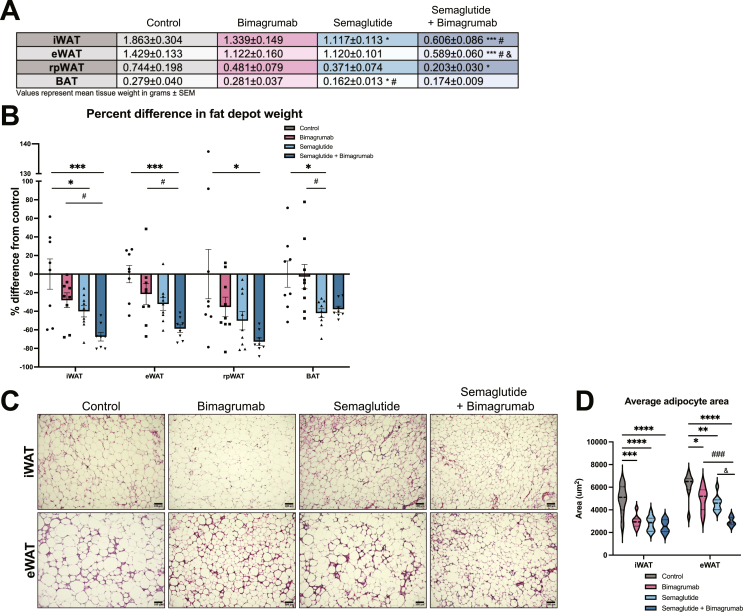
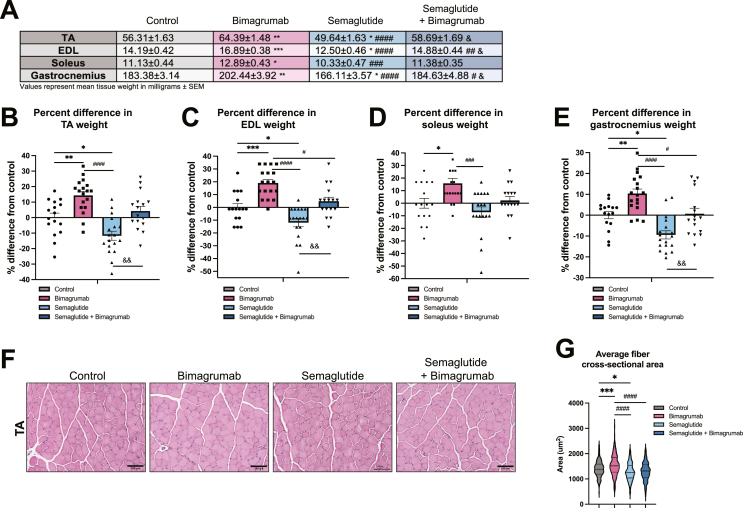
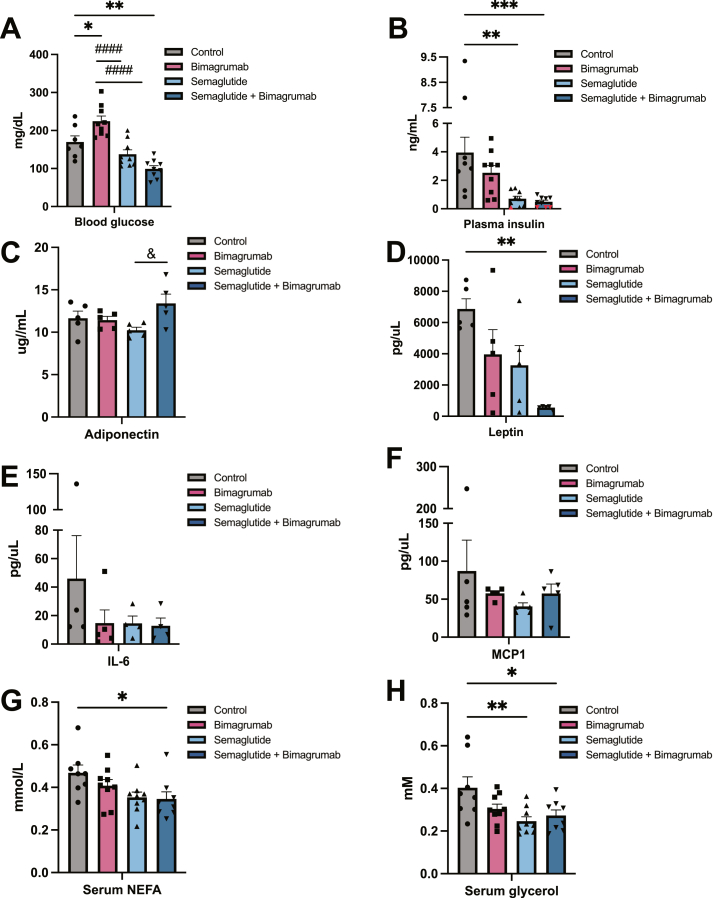
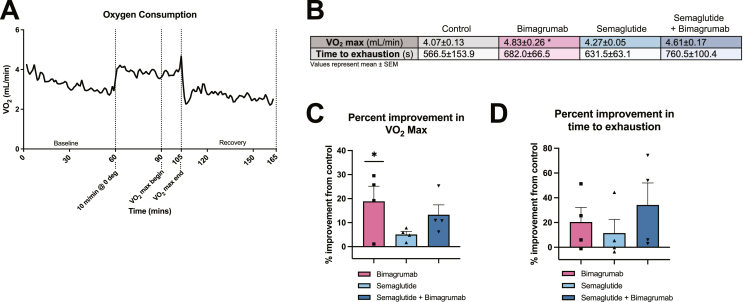
Results: Treatment of obese mice with bimagrumab induced a ∼10 % increase in lean mass while simultaneously decreasing fat mass. Daily treatment of obese mice with semaglutide potently decreased body weight; this included a significant decrease in both muscle and fat mass. Combination treatment with bimagrumab and semaglutide led to superior fat mass loss while simultaneously preserving lean mass despite reduced food intake. Treatment with both drugs was associated with improved metabolic outcomes, and increased lean mass was associated with improved exercise performance. Deletion of both Akt isoforms in skeletal muscle modestly reduced, but did not prevent, muscle hypertrophy driven by ActRII inhibition.

Conclusions: Collectively, these data demonstrate that blockade of ActRII signaling improves body composition and metabolic parameters during calorie deficit driven by GLP-1 receptor agonism and demonstrate the existence of Akt-independent pathways supporting muscle hypertrophy in the absence of ActRII signaling.

Keywords: Activin type II receptor (ActRII); Akt; Body composition; Glucagon-like peptide 1 (GLP-1); Obesity; Weight loss.


Conflict of interest statement

Declaration of competing interest None declared.

Figures

Figure 1
Figure 1
ActRII inhibition enhances fat mass loss and preserves lean mass during weight loss induced by GLP-1 receptor agonism in obese mice. A) Experimental schematic. B) Change in total body weight (g) over 14 days. C) Percent change in total body weight from baseline over 14 days. D) Change in fat mass (g) determined by MRI at day 0, 7, and 13. E) Percent change in fat mass from baseline at day 0, 7, and 13. F) Change in lean mass (g) determined by MRI at day 0, 7, and 13. G) Percent change in lean mass from baseline at day 0, 7, and 13. H) Cumulative food intake over 12 days (n = 3 mice per group for days 1–4; n = 2 for control group (one mouse removed due to animal welfare complications) and n = 3 for semaglutide, bimagrumab, and semaglutide plus bimagrumab groups for days 5–12). n = 8 mice for control and semaglutide + bimagrumab groups, n = 9 mice for semaglutide and bimagrumab groups unless otherwise indicated.∗p < 0.05, ∗∗p < 0.001, ∗∗∗p < 0.0005, ∗∗∗∗p < 0.0001 for control vs. bimagrumab, semaglutide, and semaglutide + bimagrumab; #p < 0.05, ##p < 0.001, ###p < 0.0005, ####p < 0.0001 for bimagrumab vs. semaglutide and semaglutide + bimagrumab; & p < 0.05, && p < 0.001 for semaglutide vs. semaglutide + bimagrumab.
Figure 2
Figure 2
ActRII inhibition plus GLP-1 receptor agonism further decreases adipose tissue mass during weight loss. A) Weights (g) of iWAT, eWAT, rpWAT, and BAT depots isolated from HFD-fed mice treated for 14 days. B) Percent difference in fat depot weights compared to control group. C) Representative iWAT and eWAT sections stained with H&E (10x magnification, scale bar = 100 um). D) Quantification of average adipocyte size in iWAT and eWAT sections (n = 8: 2 images analyzed per animal, 4 animals per group). n = 8 mice for control and semaglutide + bimagrumab groups, n = 9 mice for semaglutide and bimagrumab groups unless otherwise indicated.∗p < 0.05, ∗∗p < 0.001, ∗∗∗p < 0.0005, ∗∗∗∗p < 0.0001 for control vs. bimagrumab, semaglutide, and semaglutide + bimagrumab; #p < 0.05, ##p < 0.001, ###p < 0.0005, ####p < 0.0001 for bimagrumab vs. semaglutide and semaglutide + bimagrumab; & p < 0.05, && p < 0.001 for semaglutide vs. semaglutide + bimagrumab.
Figure 3
Figure 3
ActRII inhibition drives skeletal muscle hypertrophy and preserves muscle mass during weight loss induced by GLP-1 receptor agonism. A) Weights (mg) of TA, EDL, soleus, and gastrocnemius muscles isolated from HFD-fed mice treated for 14 days. B) Percent difference in weight of TA muscles compared to control group. C) Percent difference in weight of EDL muscles compared to control group. D) Percent difference in weight of soleus muscles compared to control group. E) Percent difference in weight of gastrocnemius muscles compared to control group. F) Representative TA sections stained with H&E (20x magnification, scale bar = 100 um). G) Quantification of average muscle fiber cross-sectional area in TA sections (n = 4: 2 images analyzed per animal, 2 animals per group). n = 8 mice for control and semaglutide + bimagrumab groups, n = 9 mice for semaglutide and bimagrumab groups unless otherwise indicated.∗p < 0.05, ∗∗p < 0.001, ∗∗∗p < 0.0005, ∗∗∗∗p < 0.0001 for control vs. bimagrumab, semaglutide, and semaglutide + bimagrumab; #p < 0.05, ##p < 0.001, ###p < 0.0005, ####p < 0.0001 for bimagrumab vs. semaglutide and semaglutide + bimagrumab; & p < 0.05, && p < 0.001 for semaglutide vs. semaglutide + bimagrumab.
Figure 4
Figure 4
Combined ActRII blockade plus GLP-1 receptor agonism improves circulating markers of adipose inflammation and function. A) Ad libitum blood glucose levels from HFD-fed mice. B) Ad libitum plasma insulin levels from HFD-fed mice. Values below the limit of detection were given the concentration value of 0.1 ng/mL and marked in red. C) Serum adiponectin levels from HFD-fed mice (n = 5). D) Serum leptin levels from HFD-fed mice (n = 5). E) Serum IL-6 levels from HFD-fed mice (n = 5). F) Serum MCP1 levels from HFD-fed mice (n = 5). G) Serum glycerol levels from HFD-fed mice. H) Serum NEFA levels from HFD-fed mice. n = 8 mice for control and semaglutide + bimagrumab groups, n = 9 mice for semaglutide and bimagrumab groups unless otherwise indicated. ∗p < 0.05, ∗∗p < 0.001, ∗∗∗p < 0.0005, ∗∗∗∗p < 0.0001 for control vs. bimagrumab, semaglutide, and semaglutide + bimagrumab; #p < 0.05, ##p < 0.001, ###p < 0.0005, ####p < 0.0001 for bimagrumab vs. semaglutide and semaglutide + bimagrumab; & p < 0.05, && p < 0.001 for semaglutide vs. semaglutide + bimagrumab.
Figure 5
Figure 5
Muscle hypertrophy driven by ActRII blockade is associated with improved exercise performance. A) Example oxygen consumption trace from control animals during exercise performance protocol. B) VO2 max (mL/min) and time to exhausation (s) during VO2 protocol. C) Percent improvement in VO2 max over the control group. D) Percent improvement in time to exhaustion over the control group. n = 4 mice for control, bimagrumab, semaglutide, semaglutide + bimagrumab groups. ∗p < 0.05 for control vs. bimagrumab, semaglutide, and semaglutide + bimagrumab.
Figure 6
Figure 6
ActRII inhibition drives skeletal muscle hypertrophy in the absence of Akt. A) Experimental schematic. B) Immunoblot analysis for indicated proteins in control and M-AktDKO mice refed for 1 h following 16 h of fasting. C) Weights (mg) of TA, EDL, soleus, and gastrocnemius muscles isolated from control and M-AktDKO mice treated for 14 days. D) Percent difference in weight of TA muscles compared to control group. E) Percent difference in weight of EDL muscles compared to control group. F) Percent difference in weight of soleus muscles compared to control group. G) Percent difference in weight of gastrocnemius muscles compared to control group. H) Percent increase in muscle weights induced by bimagrumab within genotypes. n = 5 mice for control and M-AktDKO groups, n = 6 mice for M-AktDKO + bimagrumab group, and n = 7 for control + bimagrumab group.∗p < 0.05, ∗∗p < 0.001, ∗∗∗p < 0.0005, ∗∗∗∗p < 0.0001 for control vs. Control + bimagrumab, M-AktDKO, and M-AktDKO + bimagrumab; #p < 0.05, ##p < 0.001, ###p < 0.0005, ####p < 0.0001 for control + bimagrumab vs. M-AktDKO and M-AktDKO + bimagrumab; & p < 0.05 for M-AktDKO vs. M-AktDKO + bimagrumab.

References

    1. N.d. World Obesity Federation . 2023. World obesity atlas.https://data.worldobesity.org/publications/?cat=19
    1. Bray G.A., Ryan D.H. Evidence-based weight loss interventions: individualized treatment options to maximize patient outcomes. Diabetes Obes Metabol. 2021;23(Suppl 1):50–62. doi: 10.1111/dom.14200. - DOI - PubMed
    1. Rosenbaum M., Foster G. Differential mechanisms affecting weight loss and weight loss maintenance. Nat Metab. 2023;5(8):1266–1274. doi: 10.1038/s42255-023-00864-1. - DOI - PubMed
    1. Campbell J.E., Müller T.D., Finan B., DiMarchi R.D., Tschöp M.H., D'Alessio D.A. GIPR/GLP-1R dual agonist therapies for diabetes and weight loss—chemistry, physiology, and clinical applications. Cell Metabol. 2023 doi: 10.1016/j.cmet.2023.07.010. - DOI - PMC - PubMed
    1. Wilding J.P.H., Batterham R.L., Calanna S., Davies M., Van Gaal L.F., Lingvay I., et al. Once-weekly semaglutide in adults with overweight or obesity. N Engl J Med. 2021;384(11):989–1002. doi: 10.1056/NEJMoa2032183. - DOI - PubMed

MeSH terms