. 2024 Apr:374:114690.
doi: 10.1016/j.expneurol.2024.114690. Epub 2024 Jan 12.

Gene knockout of RNA binding motif 5 in the brain alters RIMS2 protein homeostasis in the cerebellum and Hippocampus and exacerbates behavioral deficits after a TBI in mice

Affiliations

Gene knockout of RNA binding motif 5 in the brain alters RIMS2 protein homeostasis in the cerebellum and Hippocampus and exacerbates behavioral deficits after a TBI in mice

Kara Snyder et al. Exp Neurol. 2024 Apr.

Abstract

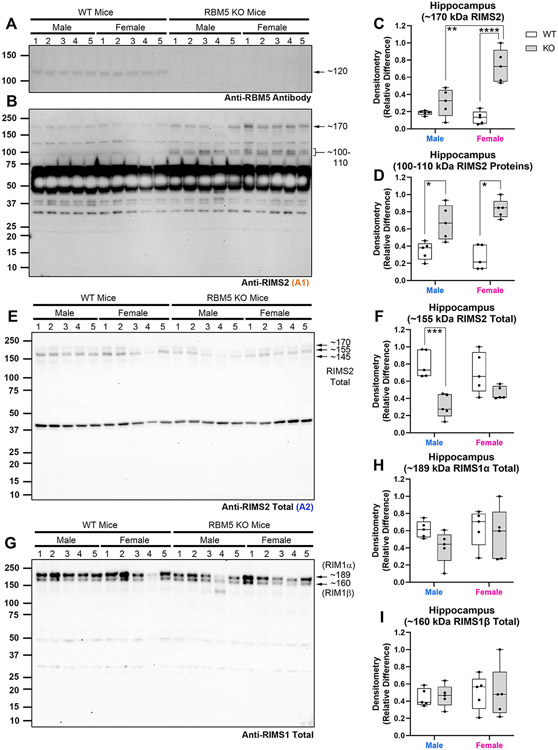
RNA binding motif 5 (RBM5) is a tumor suppressor in cancer but its role in the brain is unclear. We used conditional gene knockout (KO) mice to test if RBM5 inhibition in the brain affects chronic cortical brain tissue survival or function after a controlled cortical impact (CCI) traumatic brain injury (TBI). RBM5 KO decreased baseline contralateral hemispheric volume (p < 0.0001) and exacerbated ipsilateral tissue loss at 21 d after CCI in male mice vs. wild type (WT) (p = 0.0019). CCI injury, but not RBM5 KO, impaired beam balance performance (0-5d post-injury) and swim speed on the Morris Water Maze (MWM) (19-20d) (p < 0.0001). RBM5 KO was associated with mild learning impairment in female mice (p = 0.0426), reflected as a modest increase in escape latency early in training (14-18d post-injury). However, KO did not affect spatial memory at 19d post-injury in male or in female mice but it was impaired by CCI in females (p = 0.0061). RBM5 KO was associated with impaired visual function in male mice on the visible platform test at 20d post-injury (p = 0.0256). To explore signaling disturbances in KOs related to behavior, we first cross-referenced known brain-specific RBM5-regulated gene targets with genes in the curated RetNet database that impact vision. We then performed a secondary literature search on RBM5-regulated genes with a putative role in hippocampal function. Regulating synaptic membrane exocytosis 2 (RIMS) 2 was identified as a gene of interest because it regulates both vision and hippocampal function. Immunoprecipitation and western blot confirmed protein expression of a novel ~170 kDa RIMS2 variant in the cerebellum, and in the hippocampus, it was significantly increased in KO vs WT (p < 0.0001), and in a sex-dependent manner (p = 0.0390). Furthermore, male KOs had decreased total canonical RIMS2 levels in the cerebellum (p = 0.0027) and hippocampus (p < 0.0001), whereas female KOs had increased total RIMS1 levels in the cerebellum (p = 0.0389). In summary, RBM5 modulates brain function in mammals. Future work is needed to test if RBM5 dependent regulation of RIMS2 splicing effects vision and cognition, and to verify potential sex differences on behavior in a larger cohort of mice.

Keywords: Blindness; Cerebellum; Hippocampus; Learning; RBM5; RIMS2; Splicing; TBI; Vision.


Conflict of interest statement

Declaration of competing interest TCJ and PMK are inventors on a USPTO patent (No. 9610266).

Figures

Fig. 1:
Fig. 1:. The Effect of RBM5 Gene KO on Chronic Brain Tissue Survival after a TBI.
(A) Box plots show the effect of injury and genotype on ipsilateral (left) hemispheric volume in male mice (n=10/group). (B) Box plots show the effect of injury and genotype on contralateral (right) hemispheric volume in male mice (n=10/group). (C) The estimation plot shows the effect of genotype on the % Ipsilateral Hemispheric Tissue Loss normalized to the average value of the ipsilateral hemispheres in male naïve WT or KO mice, respectively (n=10/group). (D) Box plots show the effect of injury and genotype on ipsilateral (left) hemispheric volume in female mice (n=10/group). (E) Box plots show the effect of injury and genotype on contralateral (right) hemispheric volume in female mice (n=10/group). (F) The estimation plot shows the effect of genotype on the % Ipsilateral Hemispheric Tissue Loss in female mice. Box plots show minimum, median, maximum, interquartile range, and with individual data points superimposed. Wild-type (WT) mice are indicated by open white IQR. Knockout (KO) mice are indicated by grey filled IQR. Estimation plots show individual data points, group means, and the 95% confidence interval. Data were significant at p<0.05 with a 2-sided test. (*) p<0.05, (**) p<0.01, (****) p<0.0001. Controlled cortical impact (CCI).
Fig. 2:
Fig. 2:. The Effect of RBM5 Gene KO on Acute Motor Function and Subacute Spatial Learning Performance after a TBI.
(A and B) Line graphs show the effect of injury, genotype, and training day on beam balance performance in male and in female mice, respectively (n=10/group). (C and D) Line graphs show the effect of injury, genotype, and training day on the ability of male and female mice, respectively, to learn the location of the escape platform in the Morris Water Maze (MWM) test (n=10/group). Post-hoc asterisks highlight differences between naïve (black dots) and injured groups (red dots) on specific training days. Line graphs show group means (dots) and standard deviation. Data were significant at p<0.05 with a 2-sided test. (*) p<0.05, (**) p<0.01, (***) p<0.001). Controlled cortical impact (CCI), wild-type (WT), knock out (KO), aligned rank transformation (art).
Fig. 3:
Fig. 3:. The Effect of RBM5 Gene KO on Probe Trial Memory Performance after a TBI.
Box plots show the effect of injury and genotype on latency to first entry into the goal quadrant of the Morris Water Maze (MWM) probe trial test at 19d post-injury in (A and B) males and in females, respectively (n=10/group). Box plots show the effect of injury and genotype on distance traveled of the MWM probe trial test at 19d post-injury in (C and D) males and in females, respectively (n=10/group). Box plots show the effect of injury and genotype on swim speed of the MWM probe trial test at 19d post-injury in (E and F) males and in females, respectively (n=10/group). Box plots show minimum, median, maximum, interquartile range, and with individual data points superimposed. Wild-type (WT) mice are indicated by open white IQR. Knockout (KO) mice are indicated by grey filled IQR. Data were significant at p<0.05 with a 2-sided test. (*) p<0.05, (**) p<0.01, (****) p<0.0001. Controlled cortical impact (CCI).
Fig. 4:
Fig. 4:. The Effect of RBM5 Gene KO on Visible Platform Test Performance after a TBI.
Box plots show the effect of injury and genotype on escape latency to find the visible platform on the Morris Water Maze (MWM) at 20d post-injury in (A and B) males and in females, respectively (n=10/group). Box plots show the effect of injury and genotype on distance traveled on the visible platform test at 20d post-injury in (E and F) males and in females, respectively (n=10/group). Box plots show the effect of injury and genotype on swim speed on the visible platform test at 20d post-injury in (E and F) males and in females, respectively (n=10/group). Box plots show minimum, median, maximum, interquartile range, and with individual data points superimposed. Wild-type (WT) mice are indicated by open white IQR. Knockout (KO) mice are indicated by grey filled IQR. Data were significant at p<0.05 with a 2-sided test. (*) p<0.05, (**) p<0.01, (****) p<0.0001. Controlled cortical impact (CCI).
Fig. 5:
Fig. 5:. Novel RIMS2 Protein Variants that Harbor the Spliced Tri-Exon Block are Expressed at the Protein Level in the Mouse Brain.
(A) A graphic showing the 27 exons that comprise the canonical protein for mouse regulating synaptic membrane exocytosis 2 (RIMS2). The tri-exon block spans exons 20-22. The A1 antibody (orange) generated in a rabbit targets epitopes found in exons 20-21. The A2 antibody (blue) generated in a guinea pig targets epitopes found in exons 4-16. (B) The 7 recognized linear RIMS2 transcripts (validated or computationally predicted) of which 5 have the tri-exon block. The predicted molecular weights assume that the tri-exon block is retained in the final translated protein. (C) A graphic showing the amino acids (antigen peptide) used to generate the A1 antibody. The predicted molecular weight of the tri-exon block is ~18.7 kDa. (D) A western blot showing the results of A1 antibody enriched immunoprecipitates probed with the A1 antibody from contralateral (right) cerebellar tissue extracts from 3 female uninjured RBM5 KO mice. (E) A western blot showing the results of A1 antibody enriched immunoprecipitates probed with the A2 antibody from contralateral (right) cerebellar tissue extracts from 2 female uninjured RBM5 KO mice. Kilodalton (kDa), Immunoglobulin G (IgG).
Fig. 6:
Fig. 6:. The Effect of Genotype and Sex on the Levels of RIM proteins in the Cerebellum.
Whole cell tissue extracts were prepared from ipsilateral (left) cerebellum from uninjured wild-type (WT) and RBM5 knockout (KO) mice. (A) A western blot showing the absence of RBM5 protein in the cerebellum in male and in female KOs. (B) The full-length western blot showing bands detected by the A1 antibody in WT versus KO cerebellar extracts. (C) Box plots show densitometry for the levels of novel low molecular weight RIMS2-related signals detected by the A1 antibody in WT versus KO tissue (n=5/group). (D) The full-length western blot showing bands detected by the A2 antibody (total RIMS2) in WT versus KO cerebellar extracts. Box plots show densitometry for the levels of canonical (E) RIMS2α and (F) RIMS2β detected by the A2 antibody. (G) The full-length western blot showing bands detected by an antibody against total RIMS1 in WT versus KO cerebellar extracts. (H) Box plots show densitometry for the levels of canonical RIMS1β (n=5/group). Total protein stains used as a loading control for target normalization are available in the supplementary. Box plots show minimum, median, maximum, interquartile range, and with individual data points superimposed. WT mice are indicated by open white IQR. KO mice are indicated by grey filled IQR. Data were significant at p<0.05 with a 2-sided test. (*) p<0.05 and (**) p<0.01. Regulating synaptic membrane exocytosis 1 (RIMS1) and regulating synaptic membrane exocytosis 2 (RIMS2).
Fig. 7:
Fig. 7:. The Effect of Genotype and Sex on the Levels of RIM proteins in the Hippocampus.
Whole cell tissue extracts were prepared from ipsilateral (left) hippocampus from uninjured wild-type (WT) and RBM5 knockout (KO) mice. (A) A western blot showing the absence of RBM5 protein in the hippocampus in male and in female KOs. (B) The full-length western blot showing bands detected by the A1 antibody in WT versus KO hippocampus extracts. (C and D) Box plots show densitometry for the levels of the novel ~170 kDa tri-exon block containing RIMS2 variant, and the levels of novel low molecular weight RIMS2-related signals (100-110 kDa), detected by the A1 antibody in WT versus KO tissue (n=5/group). (E) The full-length western blot showing bands detected by the A2 antibody (total RIMS2) in WT versus KO hippocampal extracts. (F) Box plots show densitometry for the levels of canonical RIMS2β detected by the A2 antibody (n=5/group). (G) The full-length western blot showing bands detected by an antibody against total RIMS1 in WT versus KO hippocampal extracts. (H) Box plots show densitometry for the levels of canonical RIMS1β (n=5/group). Total protein stains used as a loading control for target normalization are available in the supplementary. Box plots show minimum, median, maximum, interquartile range, and with individual data points superimposed. WT mice are indicated by open white IQR. KO mice are indicated by grey filled IQR. Data were significant at p<0.05 with a 2-sided test. (*) p<0.05 and (**) p<0.01. Regulating synaptic membrane exocytosis 1 (RIMS1) and regulating synaptic membrane exocytosis 2 (RIMS2).
Fig. 8
Fig. 8. Computational Analysis of Calpain Cleavage Sites, Structural Prediction, and Phosphorylation Sites in RIMS2 and in the Tri-Exon Block.
(A) The graphic shows the Uniprot amino acid sequence for the conical RIMS2 mouse protein. The blue highlighted areas indicate the 3 spliced exons that encompass the tri-exon block region. The red arrows indicate predicted μ calpain cleavage sites. The black arrow indicates a predicted m-calpain cleavage site. (B) The predicted structure of the RIMS2 protein in AlphaFold. The 3 exons of the tri-exon block region were manually color-adjusted (see the associated key) to enhance their visualization from other structures. The results of PhosphositePlus software to analyze potential phosphorylated amino acids in the tri-exon block region are indicated in green in the bottom left. (C) A theoretical framework for the potential role of RBM5 mediated exclusion of the tri-exon block. Elimination of the spliced exons may yield RIMS2 proteins that are more resistance to proteolytic cleavage from calpains and retain the critical c-terminal RIMS2 C2B domain that regulates neurotransmission.

References

    1. Abe N, Matsumoto K, Nishihara M, Nakano Y, Shibata A, Maruyama H, Shuto S, Matsuda A, Yoshida M, Ito Y, Abe H, 2015. Rolling Circle Translation of Circular RNA in Living Human Cells. Sci Rep 5, 16435. - PMC - PubMed
    1. Cole JT, Yarnell A, Kean WS, Gold E, Lewis B, Ren M, McMullen DC, Jacobowitz DM, Pollard HB, O'Neill JT, Grunberg NE, Dalgard CL, Frank JA, Watson WD, 2011. Craniotomy: true sham for traumatic brain injury, or a sham of a sham? J Neurotrauma 28, 359–369. - PMC - PubMed
    1. Elkin LA, Kay M, Higgins JJ, Wobbrock JO, 2021. An Aligned Rank Transform Procedure for Multifactor Contrast Tests, The 34th Annual ACM Symposium on User Interface Software and Technology. Association for Computing Machinery, Virtual Event, USA, pp. 754–768.
    1. Fan X, Yang Y, Chen C, Wang Z, 2022. Pervasive translation of circular RNAs driven by short IRES-like elements. Nat Commun 13, 3751. - PMC - PubMed
    1. Farooq J, Snyder K, Janesko-Feldman K, Gorse K, Vagni VA, Kochanek PM, Jackson TC, 2022. RNA Binding Motif 5 Gene Deletion Modulates Cell Signaling in a Sex-Dependent Manner but Not Hippocampal Cell Death. J Neurotrauma 39, 577–589. - PMC - PubMed