. 2024 Jan 13;7(1):95.
doi: 10.1038/s42003-024-05782-w.

Compromise or choose: shared movement decisions in wild vulturine guineafowl

Affiliations

Compromise or choose: shared movement decisions in wild vulturine guineafowl

Danai Papageorgiou et al. Commun Biol. .

Abstract

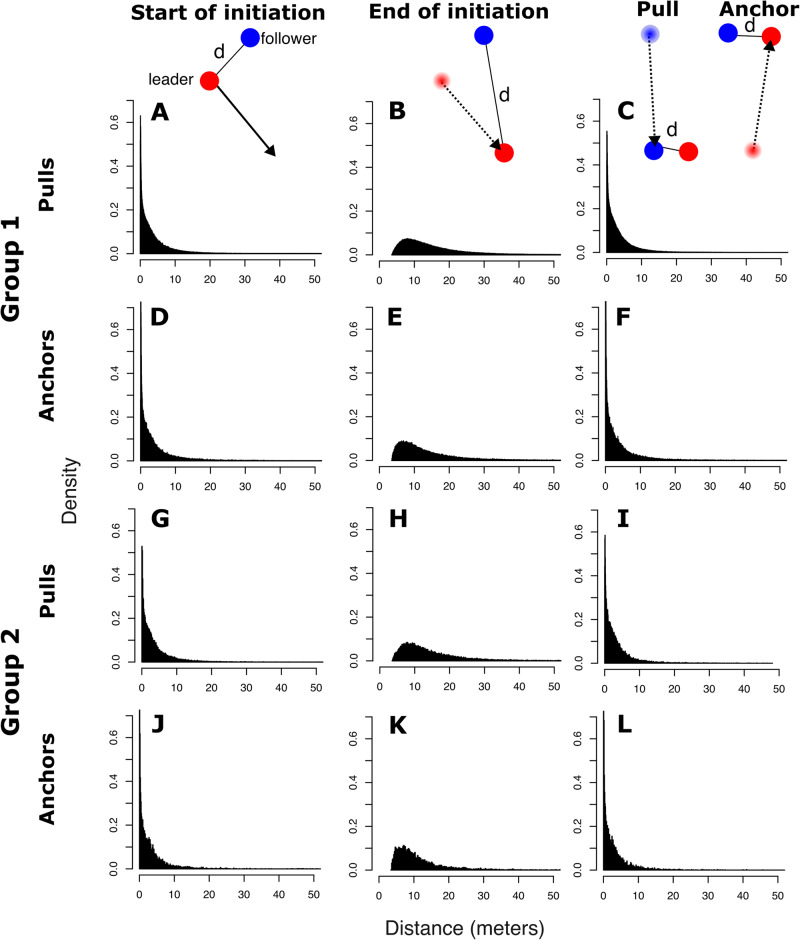
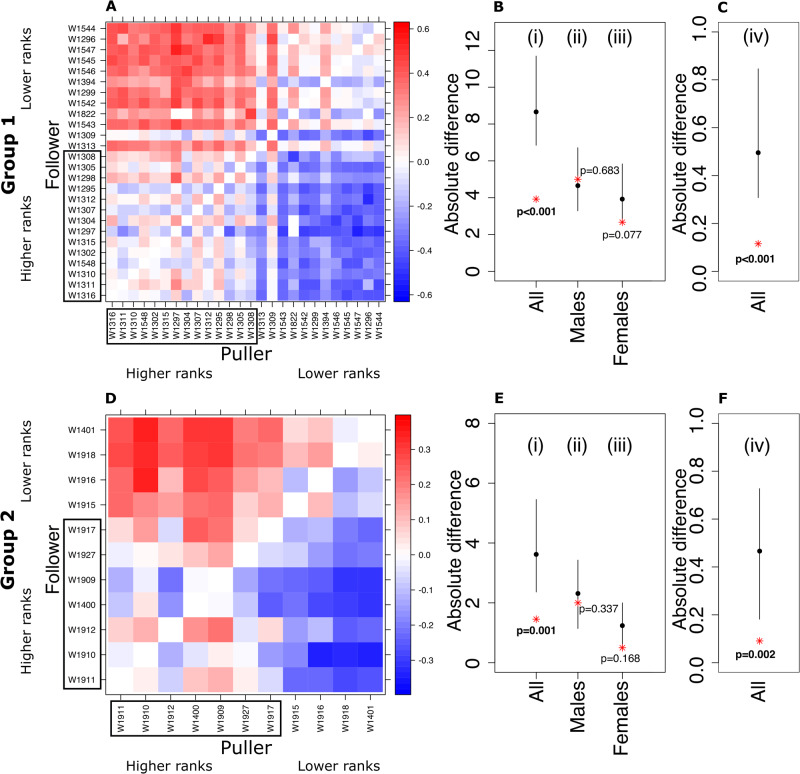
Shared-decision making is beneficial for the maintenance of group-living. However, little is known about whether consensus decision-making follows similar processes across different species. Addressing this question requires robust quantification of how individuals move relative to each other. Here we use high-resolution GPS-tracking of two vulturine guineafowl (Acryllium vulturinum) groups to test the predictions from a classic theoretical model of collective motion. We show that, in both groups, all individuals can successfully initiate directional movements, although males are more likely to be followed than females. When multiple group members initiate simultaneously, follower decisions depend on directional agreement, with followers compromising directions if the difference between them is small or choosing the majority direction if the difference is large. By aligning with model predictions and replicating the findings of a previous field study on olive baboons (Papio anubis), our results suggest that a common process governs collective decision-making in moving animal groups.


Conflict of interest statement

The authors declare no competing interests.

Figures

Fig. 1
Fig. 1. The distribution of distances (d, in metres) between initiators and potential followers, during pulls and anchors at three different times.
First, when the initiation starts (first column; A, D, G, J); second, when the initiator reaches the maximum distance away from the potential follower (second column; B, E, H, K); and third, when the potential follower starts moving towards the leader (in pulls; C, I) or the leader returns by moving towards the potential follower (in anchors; F, L). Distributions of inter-individual distances are shown separately for groups 1 (AF) and 2 (GL).
Fig. 2
Fig. 2. Dyadic influence, and relationships with dominance and sex, across two social groups.
A, D In each group, we calculated the dyadic influence index, ranging from 1 (red) when the individual in the column always leads the individual in the row to −1 (blue) when the relationship is reversed. Individuals are plotted in descending dominance rank, e.g. the alpha male of Group 1 is “W1316” and the lowest ranking group member being the female “W1544”. Individuals in rectangles are males. B, E The result of permutation tests on the relationship between dominance and leadership across all individuals (i), within males (ii), and within females (iii). While there appears to be an effect of dominance on individual influence (i), this effect is not present within sexes (ii-iii). The y-axis corresponds to the absolute difference between dominance rank and influence rank (see Methods). C, F A permutation test on the relationship between sex and influence confirms that the relationship is driven by males being more influential than females. The y-axis shows the absolute difference between two binary variables; whether an individual was within the top n-ranked individuals, where n represented the number of males in the group and whether the individual was a male or not (see Methods). Panels B, C, E, F show the observed value (red star) relative to the mean (black dot) and 95% range from 1000 permutations of the datasets. P values are calculated as the proportion of the number of values of the randomised data being larger than the observed values divided by the number of randomised values (i.e. 1000).
Fig. 3
Fig. 3. Initiation rates, and relationships with dominance and sex, across two social groups.
Panels A and D show the number of times each individual pulled another group member (black) or was anchored (grey). Individuals are plotted in descending dominance rank and those in rectangles are males. B, E The result of permutation tests on the relationship between dominance and successful initiation rates per hour (i.e. pulls) across all individuals (i), within males (ii), and within females (iii). While there appears to be a weak effect of dominance (i), this effect is not present within sexes (ii-iii). C, F A permutation test on the relationship between sex and successful initiation rates per hour (i.e. pulls) confirms that the relationship is driven by males initiating more often than females. The y-axis shows the absolute difference between two binary variables; whether an individual was within the top n-ranked individuals, where n represented the number of males in the group and whether the individual was a male or not (see Methods). The y-axes in B, C, E, F correspond to the absolute difference between dominance rank and ranked values of initiation rates. Permutation tests and panels are as per Fig. 2.
Fig. 4
Fig. 4. An individual is more likely to follow when there are few simultaneous initiators, and, as the number of concurrent initiators increases, when initiators have high agreement.
As the number of initiators increases, then the directional agreement becomes increasingly important in determining the decision of a follower, as revealed by the positive interaction term in the GEE models (Supplementary Table 1).
Fig. 5
Fig. 5. When following, vulturine guineafowl transition from compromise to choose depending on the angular disagreement between initiators.
Plots show the angle between two initiators relative to a potential follower (x-axis) and the resulting direction taken by the follower (y-axis). When the angular difference between initiators is above a critical threshold (see grey rectangle for transitional zone), follower directions are significantly bimodal (see Supplementary Fig. 3), suggesting that followers choose one direction or the other. Colours blue, white and red show the probability of a direction to be chosen by a follower. Solid white lines represent the median of the chosen direction(s) under the compromise and choose regimes (or both in the transitional zone).
Fig. 6
Fig. 6. When two clusters of initiators propose different directions with a large angle of disagreement, followers disproportionately choose the direction of the largest cluster of initiators, thus following a majority rule.
Black dots represent the empirical data and error bars are 95% confidence intervals estimated by 1000 bootstrapped replications of the data. The red line shows a significant sigmoidal fit to the data. Model summaries are presented in Supplementary Table 3.

Similar articles

Cited by

References

    1. Conradt L, Roper TJ. Group decision-making in animals. Nature. 2003;421:155–158. doi: 10.1038/nature01294. - DOI - PubMed
    1. Galton F. Vox populi (The wisdom of crowds) Nature. 1907;75:450–451. doi: 10.1038/075450a0. - DOI
    1. Simons AM. Many wrongs: the advantage of group navigation. Trends Ecol. Evol. 2004;19:453–455. doi: 10.1016/j.tree.2004.07.001. - DOI - PubMed
    1. Biro D, Sumpter DJT, Meade J, Guilford T. From Compromise to Leadership in Pigeon Homing. Curr. Biol. 2006;16:2123–2128. doi: 10.1016/j.cub.2006.08.087. - DOI - PubMed
    1. Conradt L, Roper TJ. Conflicts of interest and the evolution of decision sharing. Philos. Trans. R. Soc. B: Biol. Sci. 2009;364:807–819. doi: 10.1098/rstb.2008.0257. - DOI - PMC - PubMed

Publication types