. 2024 Jan 13;19(1):62.
doi: 10.1186/s13018-023-04384-2.

Identification of sulfur metabolism-related gene signature in osteoarthritis and TM9SF2's sustenance effect on M2 macrophages' phagocytic activity

Affiliations

Identification of sulfur metabolism-related gene signature in osteoarthritis and TM9SF2's sustenance effect on M2 macrophages' phagocytic activity

Shuang Zheng et al. J Orthop Surg Res. .

Abstract

Background: Osteoarthritis (OA) is a chronic and low-grade inflammatory disease associated with metabolism disorder and multiple cell death types in the synovial tissues. Sulfur metabolism has not been studied in OA.

Methods: First, we calculated the single sample gene set enrichment analysis score of sulfur metabolism-associated annotations (i.e., cysteine metabolism process, regulation of sulfur metabolism process, and disulfidptosis) between healthy and synovial samples from patients with OA. Sulfur metabolism-related differentially expressed genes (DEGs) were analyzed in OA. Least absolute shrinkage and selection operator COX regression were used to identify the sulfur metabolism-associated gene signature for diagnosing OA. Correlation and immune cell deconvolution analyses were used to explore the correlated functions and cell specificity of the signature gene, TM9SF2. TM9SF2's effect on the phagocytosis of macrophages M2 was analyzed by coculturing macrophages with IgG-coated beads or apoptotic Jurkat cells.

Results: A diagnostic six gene signature (i.e., MTHFD1, PDK4, TM9SF2, POU4F1, HOXA2, NCKAP1) was identified based on the ten DEGs, validated using GSE12021 and GSE1919 datasets. TM9SF2 was upregulated in the synovial tissues of OA at both mRNA and protein levels. The relationship between TM9SF2 and several functional annotations, such as antigen processing and presentation, lysosome, phagosome, Fcγ-mediated phagocytosis, and tyrosine metabolism, was identified. TM9SF2 and macrophages M2 were significantly correlated. After silencing TM9SF2 in THP-1-derived macrophages M2, a significantly reduced phagocytosis and attenuated activation of PLC-γ1 were observed.

Conclusion: A sulfur metabolism-associated six-gene signature for OA diagnosis was constructed and upregulation of the phagocytosis-associated gene, TM9SF2, was identified. The findings are expected to deepen our understanding of the molecular mechanism underlying OA development and be used as potential therapeutic targets.

Keywords: Diagnosis; Osteoarthritis; Phagocytosis; Sulfur metabolism; TM9SF2.


Conflict of interest statement

The authors declare no competing interests.

Figures

Fig. 1
Fig. 1
ssGSEA scores for different gene sets related to glycolysis, OXPHOS, cysteine metabolic process, sulfur metabolic process, and disulfidptosis in synovial samples. A Boxplot shows the ssGSEA score for each gene set in synovial samples. Only the scores of the cysteine metabolic process, regulation of the sulfur metabolic process, and disulfidptosis gene sets are significantly downregulated. The P value is shown at the top of the figure for each group. B The heatmap shows the normalized ssGSEA score for each gene set. C The heatmap shows the expression of DEGs between healthy (red samples) and OA (light blue samples) groups. DEGs: differentially expressed genes between OA and healthy groups
Fig. 2
Fig. 2
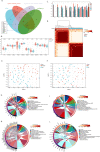
Sulfur-associated DEGs distinguish classes C1 and C2, along with their differentially enriched functions. A The Venn diagram shows ten overlapping genes between DEGs and sulfur-associated gene sets (i.e., cysteine metabolic process, regulation of sulfur metabolic process, and disulfidptosis gene sets). DEGs: differentially expressed genes between OA and healthy groups. B The violin plot shows the expression of the ten 10 sulfur metabolism-associated DEGs. C The bar graph shows the consistency within each group following consensus cluster analysis. Different colors represent the K-value or the number of groups set in each round of the clustering algorithm. The clustering solution based on K = 2 groups shows a higher intra-group consistency compared to other K values. D The heatmap shows two classes distinguished by consensus cluster analysis based on the 10 sulfur-associated DEGs. E, F Clusters identified by tSNE analysis for the expression profile of all genes. These are labeled with colors for healthy/OA groups (E) or C1/C2 groups (F), and the results suggest a consistency between the two classifications G, H. KEGG (G) and GO (H) enriched functions for the upregulated genes in class C2 (OA-dominated); e.g., cell adhesion molecules, IL-17 signaling pathways, rheumatoid arthritis, extracellular matrix, and leukocyte migration. I, J KEGG (I) and GO (J) enriched functions for genes upregulated in class C1 (healthy-dominated); e.g., tyrosine metabolism, fatty acid degradation, and lipid transport.`
Fig. 3
Fig. 3
Establishment of the diagnostic gene signature by LASSO COX regression analysis. A LASSO COX regression for 9 sulfur-associated genes. The coefficient profile plot was generated against the log (lambda) sequence (Upper). LASSO coefficient profiles of the nine genes in the merged dataset (Lower). B Accuracy of the diagnostic model for the six-gene signature to predict OA diagnosis, as evidenced by the receiver operating characteristic (ROC) curve analysis. When AUC (i.e., Area under the ROC curve) is 0.5, it means there is a 50% chance that the model can distinguish between positive and negative classes; 0.7 ≥ AUC > 0.6: acceptable discrimination; AUC > 0.7: excellent discrimination. C Detailed diagnostic information (healthy/OA) and expressional patterns of candidate genes differ between high-risk score and low-risk score groups. Upper layer: level of risk score for each sample; middle layer: OA status (red: OA, green: healthy); lower layer: heatmap shows the gene expression. D The boxplot shows differential expression levels of the six genes between healthy and OA groups
Fig. 4
Fig. 4
Validation of the diagnostic six-gene signature in GSE12021 and GSE1919 datasets. A, B Accuracy of the diagnostic model for the six-gene signature in predicting osteoarthritis by ROC analysis in GSE12021 (A) and GSE1919 (B) datasets. C, D Boxplot shows the differential expression of the six genes between healthy and OA groups in the GSE12021 (C) and GSE1919 (D) datasets. E, F Detailed diagnostic information (healthy/OA) and expression patterns of candidate genes between high-risk score and low-risk score groups in the GSE12021 (E) and GSE1919 (F) datasets, thus validating the diagnostic performance of the six-gene signature. Upper layer: risk score for each sample; middle layer: OA status (red: OA, green: healthy); lower layer: heatmap shows the gene expression
Fig. 5
Fig. 5
Functional enrichment analysis and cell-specificity analysis. A Functionally enriched annotations from GO and KEGG analyses for the positively correlated genes of TM9SF2, suggesting potential functions, including antigen processing and presentation, lysosome, and phagosome. B Enriched KEGG annotations in high- or low-TM9SF2 expression samples after GSEA, suggesting potential functions, including lysosome, phagocytosis, and tyrosine metabolism. C The heatmap shows the correlation between the six genes and CIBERSORT-identified immune cells. There is a strong correlation between TM9SF1 and macrophages M1/M2. D The heatmap shows the correlation between the six genes and xCell-identified immune cells. There is a strong correlation between TM9SF1 and macrophage M2
Fig. 6
Fig. 6
The effect of TM9SF2 on phagocytosis of macrophages M2. A, B Knocking down TM9SF2 in THP-1-derived macrophages M2 at mRNA (A) and protein (B) levels. C The downregulation of macrophage phagocytosis on PE-stained IgG-coated latex beads by knocking down TM9SF2. D Downregulation of macrophage phagocytosis on PKH26-stained apoptotic Jurkat cells following TM9SF2 knockdown. Flow cytometry and immunofluorescence results with statistical values obtained from three biological replicates in one technical replicate. The data are representative of three independent experiments. *P < 0.05, two-sided t-test. Red scale bar: 50 μm
Fig. 7
Fig. 7
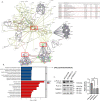
Proteins interacting with TM9SF2 and their enriched annotations. A The TM9SF2-centered STRING PPI network was enriched in functions “Fc gamma R-mediated phagocytosis,” “Regulation of actin cytoskeleton,” and “Endocytosis” as evidenced by the direct interaction with ARPC5 and BCAR1. B Proteins interacting with TM9SF2 (from BioGRID and HIPPIE databases) were enriched in functions of “activation of phospholipase C activity,” “endocytic vesicle,” and “phagocytic vesicles.” Enriched proteins are shown on the right side (pointed out by arrow), such as LPAR1 and RAB9A. C Knocking down TM9SF2 attenuates PLC-γ1 activation, as reflected by phosphorylation at its Y783 position. Data are representative of three independent experiments. *P < 0.05, **P < 0.01, two-sided t test

Similar articles

Cited by

References

    1. Sharma L. Osteoarthritis of the knee. N Engl J Med. 2021;384(1):51–59. doi: 10.1056/NEJMcp1903768. - DOI - PubMed
    1. Allen KD, Thoma LM, Golightly YM. Epidemiology of osteoarthritis. Osteoarthr Cartil. 2022;30(2):184–195. doi: 10.1016/j.joca.2021.04.020. - DOI - PMC - PubMed
    1. Xu M, Ji Y. Immunoregulation of synovial macrophages for the treatment of osteoarthritis. Open Life Sci. 2023;18(1):20220567. doi: 10.1515/biol-2022-0567. - DOI - PMC - PubMed
    1. Mushenkova NV, et al. Phenotype diversity of macrophages in osteoarthritis: implications for development of macrophage modulating therapies. Int J Mol Sci. 2022;23(15):8381. doi: 10.3390/ijms23158381. - DOI - PMC - PubMed
    1. Wu CL, et al. The role of macrophages in osteoarthritis and cartilage repair. Osteoarthr Cartil. 2020;28(5):544–554. doi: 10.1016/j.joca.2019.12.007. - DOI - PMC - PubMed