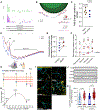
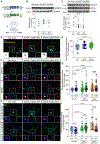
. 2024 Feb 27;43(2):113670.
doi: 10.1016/j.celrep.2023.113670. Epub 2024 Jan 13.

The integrated stress response effector GADD34 is repurposed by neurons to promote stimulus-induced translation

Affiliations

The integrated stress response effector GADD34 is repurposed by neurons to promote stimulus-induced translation

Mauricio M Oliveira et al. Cell Rep. .

Abstract

Neuronal protein synthesis is required for long-lasting plasticity and long-term memory consolidation. Dephosphorylation of eukaryotic initiation factor 2α is one of the key translational control events that is required to increase de novo protein synthesis that underlies long-lasting plasticity and memory consolidation. Here, we interrogate the molecular pathways of translational control that are triggered by neuronal stimulation with brain-derived neurotrophic factor (BDNF), which results in eukaryotic initiation factor 2α (eIF2α) dephosphorylation and increases in de novo protein synthesis. Primary rodent neurons exposed to BDNF display elevated translation of GADD34, which facilitates eIF2α dephosphorylation and subsequent de novo protein synthesis. Furthermore, GADD34 requires G-actin generated by cofilin to dephosphorylate eIF2α and enhance protein synthesis. Finally, GADD34 is required for BDNF-induced translation of synaptic plasticity-related proteins. Overall, we provide evidence that neurons repurpose GADD34, an effector of the integrated stress response, as an orchestrator of rapid increases in eIF2-dependent translation in response to plasticity-inducing stimuli.

Keywords: BDNF; CP: Molecular biology; CP: Neuroscience; GADD34; cytoskeleton; eIF2α; local translation; mRNA translation; neuron; neuronal plasticity; protein synthesis; synaptic plasticity.


Conflict of interest statement

Declaration of interests The authors declare no competing interests.

Figures

Figure 1.
Figure 1.. GADD34 is constitutively expressed in neurons
(A) Fluorescence in situ hybridization (FISH) targeting GADD34 mRNA (punctate signal). Green, FISH; blue, DAPI; cyan, MAP2. Scale bar: 50 μm. (B) Top: percentage of total mRNA localized to somatic vs. dendritic compartments. Bottom: radial quantification of GADD34 mRNA puncta in neurons, from soma (light blue background) to dendritic portions (dark blue background) (n = 34 neurons/3 independent cultures). (C) SICO.shRNA system for knockdown of GADD34. (D) Neurons transduced with AAV9.EF1α.mCherry.SICO-shRNA.Ppp1r15a. Scale bar: 200 μm. (E) Representative images of GADD34 immunostaining in neurons transduced with AAV9.EF1α.mCherry.SICO-shRNA.Ppp1r15a. Yellow, GADD34; cyan, MAP2; red, mCherry. Scale bar: 50 μm. (F) Quantification of (E) (n = 20–23 neurons from 2 independent cultures). One-way ANOVA followed by Dunnett post hoc test. Error bars represent min to max values. (G) Western blot of cell lysates obtained from naive neurons or co-transduced with AAV9.CamKIIα.Cre + AAV9.hSyn2.DIO.mCherry or AAV9.CamKIIα.Cre + AAV9.EF1α.mCherry.SICO-shRNA.Ppp1r15a (n = 5 independent cultures). Top row, GADD34; bottom row, β-actin. One-way ANOVA followed by Dunnet post hoc test. (H) Western blot of cell lysates obtained from naive neurons or co-transduced with AAV9.CamKIIα.Cre + AAV9.hSyn2.DIO.mCherry or AAV9.CamKIIα.Cre + AAV9.EF1α.mCherry.SICO-shRNA.Ppp1r15a (n = 5 independent cultures). Top row, eIF2α-P; middle row, total eIF2α; bottom row, β-actin. One-way ANOVA followed by Dunnet post hoc test.
Figure 2.
Figure 2.. BDNF promotes transcription-independent increase in GADD34 protein levels
(A) Western blot probed for GADD34 (top blot) or β-actin control (bottom lane) using samples obtained from neurons exposed to BDNF at time points indicated. (B) Western blot probed for eIF2α-P (Ser51, top lane) or total eIF2α (bottom lane) using the same samples described in (A). (C) Quantification of (A) and (B) (n = 5 independent primary cultures). One-way ANOVA repeated measures followed by Dunnett post hoc test. (D) Immunofluorescence staining for GADD34 in neurons. Green, GADD34; cyan, MAP2; blue, DAPI. Scale bar: 50 μm. (E) Representation of the radial quantification of GADD34 expression in neurons. (F) Radial quantification of GADD34 expression in soma (light blue background) and in dendrites (dark blue background) of neurons exposed to either vehicle (blue line) or BDNF for 1 h (red line). Light shade surrounding the lines represents SEM. (G) Total amount of GADD34 in either soma or dendrites of neurons exposed to either vehicle or 50 ng/mL BDNF for 1 h. Statistical analysis was performed to compare differences in each compartment, independently (n = 37–38 neurons/condition from 3 independent cultures). Unpaired t test. Error bars represent min to max values. See STAR Methods for details on the quantification. (H) RNA-scope-based FISH staining against GADD34 mRNA in neurons. Green, FISH; cyan, MAP2; blue, DAPI. Scale bar: 50 μm. (I) Representation of the radial quantification of Ppp1r15a mRNA expression in primary neurons. (J) Radial quantification of Ppp1r15a mRNA expression in soma (light blue background) and in dendrites (dark blue background) of neurons exposed to either vehicle (blue line) or BDNF (red line) for 1 h. Light shade surrounding the lines represent SEM. (K) Total amounts of Ppp1r15a mRNA in either soma or dendrites of neurons exposed to either vehicle or BDNF for 1 h (n = 33–34 neurons/condition from 3 independent cultures). Error bars represent min to max values. See STAR Methods. (L) Representation of timeline for experiment with cycloheximide and BDNF. (M) Western blot using samples obtained from neurons treated as described in (L) (n = 4 independent cultures). Top row, GADD34; bottom row = β-actin. Two-way ANOVA followed by Tukey’s post hoc test, p(Veh vs. BDNF) = 0.0357; p(BDNF vs. BDNF+Chx) = 0.0029. Mean ± SEM. (N) Western blot using samples obtained from neurons treated as described in (L) (n = 4 independent cultures). Top row, eIF2α-P; middle row, total eIF2α; bottom row, β-actin. Two-way ANOVA followed by Tukey’s post hoc test, p(Veh vs. BDNF) = 0.0111; p(BDNF vs. BDNF+Chx) = 0.0231. Mean ± SEM.
Figure 3.
Figure 3.. BDNF increases GADD34 translation in neurons
(A) Ribo-seq data from Glock et al. indicating stalled ribosomes at the uORFs of Ppp1r15a mRNA in neuronal soma and dendrites. (B) Schematics of the workflow for TRAP-qPCR. See STAR Methods. (C) TRAP-qPCR and qPCR (total lysate) analysis of Ppp1r15a normalized by Gapdh (n = 4–5 independent cultures). Wilcoxon rank test. (D) Representative polysome fractionation from neurons exposed to either vehicle (red) or BDNF for 1 h (blue). (E) Polysome/monosome ratio. Paired t test, p = 0.0411. Unpaired t test, p = 0.2094. (F) Quantification of loaded Ppp1r15a mRNA in different fractions of polysome profiling, assessed by real-time PCR (n = 5 independent primary cultures). Blue dashed line represents vehicle, normalized to 1 in every fraction. Statistical analyses were performed comparing the mean variations per fraction. Wilcoxon rank test, ns, non-significant, p = 0.0314. (G) Puro-PLA experimental design. (H) Quantification of total puro-PLA signal in neurons exposed to BDNF in time points indicated (n = 35–36 neurons from 3 independent cultures). One-way ANOVA repeated measures followed by Dunnett post hoc test. (I) Representative images of puro-PLA from the experiment described in (H). Green, puro-PLA; red, MAP2; blue, DAPI. Scale bar: 150 μm. (J) Representative images of dendritic signal from the puro-PLA time course experiment. PLA signals are represented as black dots. (K) Quantification of GADD34 puro-PLA signal at the 60 min time point of exposure to BDNF, isolating somatic and dendritic compartments (n = 35–36 neurons from 3 independent cultures). Unpaired t test. Error bars represent min to max values. See STAR Methods.
Figure 4.
Figure 4.. BDNF promotes GADD34-eIF2α interactions and GADD34-dependent protein synthesis
(A) Representative images of GADD34-eIF2α PLA in neurons. Green, PLA; red, MAP2; blue, DAPI. Scale bar: 100 μm. (B) Quantification of (D) (N = 50 neurons from 3 independent cultures). Statistical analysis was performed comparing each compartment independently. Unpaired t test. Error bars represent min to max values. See STAR Methods. (C) Representative images of eIF2α-P levels measured using spPLA in neurons transduced with either AAV9.EF1α.mCherry.SICO-shRNA.Ppp1r15a or control AAV9.hSyn.DIO.mCherry. Cyan, MAP2; red, mCherry; yellow, eIF2α-P. Scale bar: 50 μm. (D) Quantification of (F) (n = 18–29 neurons/condition from 3 independent cultures). Two-way ANOVA followed by Tukey’s post hoc test. Error bars represent min to max values. (E) Representative images of de novo protein synthesis measured using in situ SUnSET in neurons transduced with either AAV9.EF1α.mCherry.SICO-shRNA.Ppp1r15a or control AAV9.hSyn.DIO.mCherry. Cyan, MAP2; red, mCherry; pseudo color, puromycin. Scale bar: 50 μm. (F) Quantification of (F) (n = 28–41 neurons/condition from 3 independent cultures). Two-way ANOVA followed by Tukey’s post hoc test. Error bars represent min to max values.
Figure 5.
Figure 5.. GADD34 mediates the BDNF-induced translation of mRNAs that encode synaptic-plasticity-related proteins
(A) Volcano plot demonstrating log2FC of upregulated (orange) and downregulated (blue) mRNAs in total mRNA fraction. (B) Volcano plot demonstrating log2FC of upregulated (orange) and downregulated (blue) mRNAs in the TRAP purified fraction. (C) Correlation plot between log2FCs of total mRNA fraction (x axis) vs. TRAP fraction (y axis). Each black dot is an individual mRNA. (D) FCs of IEGs induced by BDNF both in total fraction (blue) and TRAP fraction (beige). (E) GO analysis of DEGs significantly upregulated by BDNF. Size of circle indicates counts of mRNAs in each group, and color indicates adjusted p value of that GO group. (F) Comparison of log2FCs of mRNAs belonging to the “synapse organization” GO and all mRNAs identified in total mRNA or TRAP fractions. Gene ratio, the number of genes identified in each group divided by the amount of background genes. Unpaired t test. (G) Comparison of log2FCs of mRNAs belonging to the “positive regulation of MAPK cascade” GO and all mRNAs identified in total mRNA or TRAP fractions. Gene ratio is the same as in (F). Unpaired t test. (H) GO analysis of DEGs significantly downregulated by BDNF. Size of circle indicates counts of mRNAs in each group, and color indicates adjusted p value of that GO group. (I) Comparison of log2FCs of mRNAs belonging to the “ribosome” GO and all mRNAs identified in total mRNA or TRAP fractions. Gene ratio is the same as in (F). Unpaired t test. (J) Comparison of log2FCs of mRNAs belonging to the “microtubule” GO and all mRNAs identified in total mRNA or TRAP fractions. Gene ratio is the same as in (F). Unpaired t test. (K) Correlation plot between log2FCs of WT (x axis) vs. KO cells (y axis). Each dot is an individual mRNA. Orange dots indicate mRNAs that are downregulated in WT, corrected in KO. Blue dots indicate mRNAs that are upregulated in WT, corrected in KO. (L) GO analysis of DEGs significantly upregulated by BDNF, corrected in KO. Size of circle indicates counts of mRNAs in each group, and color indicates adjusted p value of that GO group. (M) GO analysis of DEGs significantly downregulated by BDNF, corrected in KO. Size of circle indicates the total count of mRNAs in each group, and color indicates adjusted p value of that GO group. (N) Comparison of log2FC WT vs. log2FC KO of mRNAs belonging to the “synaptic organization” or “positive regulation of MAPK cascade” GOs. Comparisons were made in total and TRAP fractions. Unpaired t test. (O) Comparison of log2FC WT vs. log2FC KO of mRNAs belonging to the “ribosome” or “microtubule” GOs. Comparisons were made in total and TRAP fractions. Unpaired t test. (P) Heatmaps comparing the log2FCs of mRNAs belonging to either “synaptic organization” or “post-synapse.” Comparisons were performed in total and TRAP fractions.
Figure 6.
Figure 6.. BDNF increases the physical interaction between G-actin and GADD34
(A) Representative western blots probed cofilin-P (ser 3, top row), total cofilin (middle row), and β-actin (bottom row) using samples from neurons exposed to vehicle or BDNF for 1 h. (B) Quantification of the ratio of cofilin-P over cofilin (n = 3 primary cultures). Paired t test. Unpaired t test, p = 0.0743. (C) Quantification of the ratio of cofilin-P over β-actin (n = 3 primary cultures). Paired t test. Unpaired t test, p = 0.8249. (D) Quantification of the ratio of cofilin over β-actin (n = 3 primary cultures). Paired t test. Unpaired t test, p = 0.2710. (E) Representative images of the PLA for GADD34-pan actin in primary neurons. Insets represent the PLA signal in the soma (black dots). Below the images are dendritic representations of the PLA signal. Yellow, PLA GADD34-eIF2α; cyan, MAP2; blue, DAPI. Scale bar: 100 μm. (F) Quantification of (G) (n = 39–44 neurons from 3 independent cultures). Statistical analysis was performed to compare differences in each compartment, independently. Unpaired t test. Error bars represent min to max values. See STAR Methods. (G) Representative images of GADD34-eIF2α PLA in primary neurons transduced with AAV9.U6.shRNA-cofilin or control and then exposed to BDNF for 1 h. Yellow, GADD34-eIF2α PLA; cyan, MAP2. Scale bar: 50 μm. (H) Quantification of (I) (n = 29–31 neurons/group from 3 independent cultures). Two-way ANOVA followed by Dunnet’s post hoc test. Error bars represent min to max values.
Figure 7.
Figure 7.. Increasing cofilin activity promotes protein synthesis and eIF2α dephosphorylation
(A) Viral system used to overexpress WT or mutant cofilin in primary neurons. (B) Western blot probed for GADD34 (top lane) or β-actin (bottom lane) on samples from neurons transduced with either no virus, cof-WT, or cof-S3A. Below is the quantification of GADD34 normalized by β-actin (n = 5 independent primary cultures). One-way ANOVA followed by Dunnett post hoc test. (C) Top: western blot probed for eIF2α-P (ser 5, top lane), total eIF2α (middle lane), or β-actin (bottom lane) on samples from neurons transduced with no virus, cof-WT, or cof-S3A. Bottom: quantification of eIF2α-P normalized by eIF2α and β-actin (n = 5 independent primary cultures). One-way ANOVA followed by Dunnett post hoc test. (D) Representative images of GADD34-eIF2α PLA in neurons transduced with no virus, AAV5.CamKIIα.Cof-WT-HA, or AAV5.CamKIIα.Cof-S3A-HA. Yellow, PLA; cyan, MAP2; blue, DAPI; green, HA (bottom right inset). Scale bar: 100 μm. (E) Quantification of the total PLA signal normalized by the neuronal area (n = 32–34 neurons from 3 independent cultures). One-way ANOVA followed by Dunnett post hoc test. Error bars represent min to max values. (F) Representative images of in situ SUnSET in neurons transduced with no virus (left column), AAV5.CamKIIα.Cof-WT-HA (middle column), or AAV5.CamKIIα.Cof-S3A-HA (right column), exposed to vehicle (top row) or BDNF (bottom row). Cyan, MAP2; gray, DAPI; pseudo color, puromycin (bottom left inset); red, HA (bottom right inset). Scale bar: 100 μm. (G) Quantification of (E) (n = 27–41 neurons from 3 independent cultures). Comparisons of vehicle vs. BDNF for each group (no virus, cof-WT, or cof-S3A): unpaired t test. Comparisons between groups: one-way ANOVA followed by Dunnett’s post hoc test. Error bars represent min to max values. (H) Representative images of in situ SUnSET in neurons transduced with no virus (left column), AAV5.CamKIIα.Cof-WT-HA (middle column), or AAV5.CamKIIα.Cof-S3A-HA (right column), co-transduced with CamKIIα.EGFP (top row) or CamKIIα.Cre-EGFP (bottom row). Cyan, MAP2; green, EGFP; pseudo color, puromycin (bottom left inset); red, HA (bottom right inset). Scale bar: 50 μm. (I) Quantification of (H) (n = 21–31 neurons from 3 independent cultures). Comparisons of vehicle vs. BDNF for each group (no virus, cof-WT, or cof-S3A): unpaired t test. Comparisons between groups: two-way ANOVA followed by Dunnett’s post hoc test. Error bars represent min to max values.

References

    1. Flexner LB, Flexner JB, Roberts RB, and Delahaba G (1964). Loss of Recent Memory in Mice as Related to Regional Inhibition of Cerebral Protein Synthesis. Proc. Natl. Acad. Sci. USA 52, 1165–1169. - PMC - PubMed
    1. Oliveira MM, and Klann E (2022). eIF2-dependent translation initiation: Memory consolidation and disruption in Alzheimer’s disease. Semin. Cell Dev. Biol 125, 101–109. - PMC - PubMed
    1. Cheng W, Wang S, Mestre AA, Fu C, Makarem A, Xian F, Hayes LR, Lopez-Gonzalez R, Drenner K, Jiang J, et al. (2018). C9ORF72 GGGGCC repeat-associated non-AUG translation is upregulated by stress through eIF2alpha phosphorylation. Nat. Commun 9, 51. - PMC - PubMed
    1. Chou A, Krukowski K, Jopson T, Zhu PJ, Costa-Mattioli M, Walter P, and Rosi S (2017). Inhibition of the integrated stress response reverses cognitive deficits after traumatic brain injury. Proc. Natl. Acad. Sci. USA 114, E6420–E6426. - PMC - PubMed
    1. Evans HT, Benetatos J, van Roijen M, Bodea LG, and Götz J (2019). Decreased synthesis of ribosomal proteins in tauopathy revealed by non-canonical amino acid labelling. EMBO J. 38, e101174. - PMC - PubMed

Publication types

Substances