. 2024;17(5):853-876.
doi: 10.1016/j.jcmgh.2024.01.006. Epub 2024 Jan 14.

Noncanonical TRAIL Signaling Promotes Myeloid-Derived Suppressor Cell Abundance and Tumor Growth in Cholangiocarcinoma

Affiliations

Noncanonical TRAIL Signaling Promotes Myeloid-Derived Suppressor Cell Abundance and Tumor Growth in Cholangiocarcinoma

Emilien J Loeuillard et al. Cell Mol Gastroenterol Hepatol. 2024.

Abstract

Background & aims: Proapoptotic tumor necrosis factor-related apoptosis-inducing ligand (TRAIL) signaling as a cause of cancer cell death is a well-established mechanism. However, TRAIL-receptor (TRAIL-R) agonists have had very limited anticancer activity in human beings, challenging the concept of TRAIL as a potent anticancer agent. Herein, we aimed to define mechanisms by which TRAIL+ cancer cells can leverage noncanonical TRAIL signaling in myeloid-derived suppressor cells (MDSCs) promoting their abundance in murine cholangiocarcinoma (CCA).

Methods: Multiple immunocompetent syngeneic, orthotopic models of CCA were used. Single-cell RNA sequencing and cellular indexing of transcriptomes and epitopes by sequencing of CD45+ cells in murine tumors from the different CCA models was conducted.

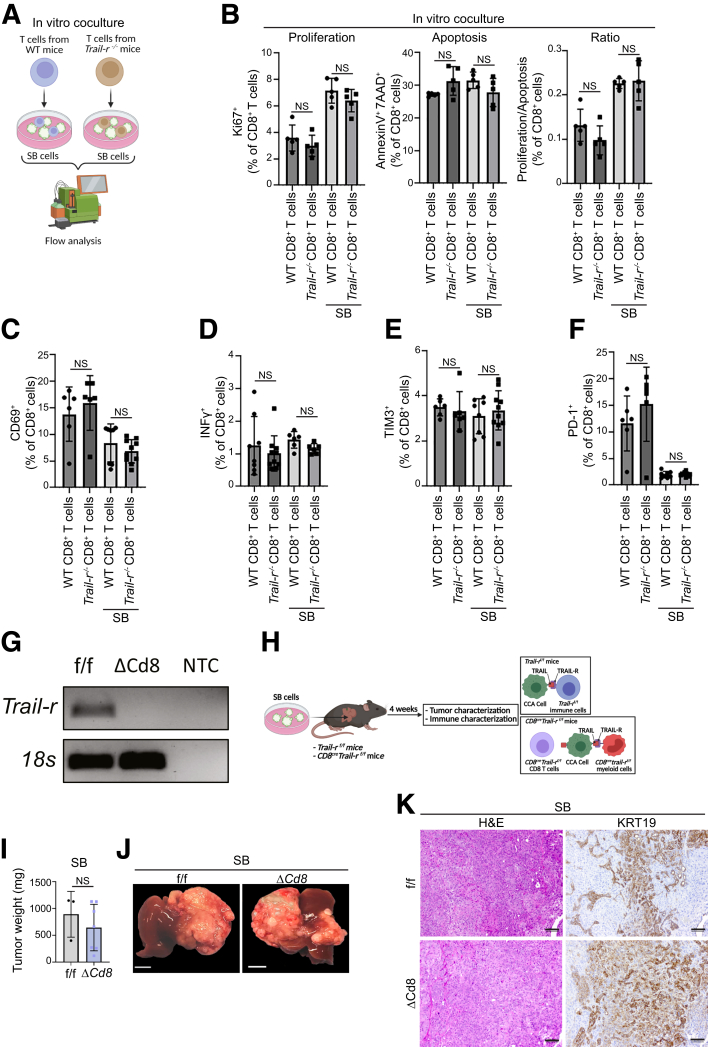
Results: In multiple immunocompetent murine models of CCA, implantation of TRAIL+ murine cancer cells into Trail-r-/- mice resulted in a significant reduction in tumor volumes compared with wild-type mice. Tumor-bearing Trail-r-/- mice had a significant decrease in the abundance of MDSCs owing to attenuation of MDSC proliferation. Noncanonical TRAIL signaling with consequent nuclear factor-κB activation in MDSCs facilitated enhanced MDSC proliferation. Single-cell RNA sequencing and cellular indexing of transcriptomes and epitopes by sequencing of immune cells from murine tumors showed enrichment of a nuclear factor-κB activation signature in MDSCs. Moreover, MDSCs were resistant to TRAIL-mediated apoptosis owing to enhanced expression of cellular FLICE inhibitory protein, an inhibitor of proapoptotic TRAIL signaling. Accordingly, cellular FLICE inhibitory protein knockdown sensitized murine MDSCs to TRAIL-mediated apoptosis. Finally, cancer cell-restricted deletion of Trail significantly reduced MDSC abundance and murine tumor burden.

Conclusions: Our findings highlight the therapeutic potential of targeting TRAIL+ cancer cells for treatment of a poorly immunogenic cancer.

Keywords: Granulocytic MDSCs; Immune Evasion; NF-κB; cFLIP.


Figures

None
Graphical abstract
Figure 1
Figure 1
TRAIL-R+immune cells in the TIME are essential in facilitating tumor progression. (A and B) Uniform manifold approximation and projection (UMAP) plots of single cells from 34 human CCA tumors in public scRNA-seq data sets (GSE210066, GSE189903, GSE138709, GSE125449, and HRA000863). (A) CCA cells (7426) were colored (red) by TRAIL (TNFSF10) expression and expression of epithelial cell markers (violet) in these tumor cells. (B) Immune cells (156,063) were colored by TRAIL-R1 (TNFRSF10A) expression (left) and TRAIL-R2 (TNFRSF10B) expression (right). Positive cells (in red) were defined as those with a unique molecular identifier of the specific gene larger than 1.7. (C) Graph depicts Kaplan–Meier survival curve of 117 iCCA patients from the International Cancer Genome Consortium cohort (GSE89747), stratified according to expression of the TRAIL-R1 gene (TRAIL-R1 high and TRAIL-R1 low). The Gehan–Breslow–Wilcoxon test was performed to assess the overall survival of the 2 groups. Wilcoxon P value is provided. (D) Immunoblot analysis of TRAIL expression in SB, KPPC, and FAC mouse CCA cell lysates. β-actin (ACTIN) was used as a loading control. (E) Schematic of SB syngeneic CCA model in WT and Trail-r-/- mice. (F) Average tumor weights of WT and Trail-r-/- mice (n > 15). (G) Representative photographs of livers from panel F. Scale bar: 0.5 cm. (H) Schematic of KPPC syngeneic CCA model in WT and Trail-r-/- mice. (I) Average tumor weights of WT and Trail-r-/- mice (n > 10). (J) Representative photographs of livers from panel I. Scale bar: 0.5 cm. (K) Schematic of FAC syngeneic CCA model in WT and Trail-r-/- mice. (L) Average tumor weights of WT and Trail-r-/- mice (n = 4). (M) Representative photographs of livers from panel L. Scale bar: 0.5 cm. Data are represented as means ± SD. Unpaired Student t test was used. ∗P < .05, ∗∗∗P < .001. ANXA, Annexin; EPCAM, Epithelial Cell Adhesion Molecule.
Figure 2
Figure 2
SB, KPPC, and FAC mouse tumors have phenotypic features of CCA. (A) Representative photomicrographs of H&E-stained (left panel) and KRT19 immunohistochemistry (IHC) (right panel) of SB tumor sections from WT and Trail-r-/- mice. Scale bar: 50 μm. (B) Representative photomicrographs of H&E (left panel), pan-cytokeratin (Pan-CK) and hepatocyte nuclear factor 4α (HNF4α) IHC (middle panels), and immunofluorescence depicting costaining of pan-CK and HNF4α (right panel) of KPPC tumor sections from WT and Trail-r-/- mice. Nuclei counterstained with Hoechst stain in immunofluorescence images. Scale bar: 50 μm. (C) Representative photomicrographs of H&E-stained (left panel) and KRT19 IHC (right panel) of FAC tumor sections from WT mice. Scale bar: 50 μm. All photomicrographs represent results from at least n ≥ 3 mice.
Figure 3
Figure 3
Genetic deletion of Trail-r augments CTL infiltration and function. (A) Percentage of CTLs in tumor-adjacent livers or SB tumors from WT and Trail-r-/- mice (n ≥ 19). (B) Percentage of reactive CTLs in tumor-adjacent livers or SB tumors from WT and Trail-r-/- mice (n ≥ 5). (C) Percentage of granzyme B in tumor-adjacent livers or SB tumors from WT and Trail-r-/- mice (n ≥ 9). (D) Percentage of PD-1+ reactive CTLs in tumor-adjacent livers or SB tumors from WT and Trail-r-/- mice (n ≥ 19). (E) Left: Representative photomicrographs of CD8a and CD11a immunohistochemistry of SB tumor section from WT and Trail-r-/- mice. Scale bar: 100 μm. Right: Zoom of field of interest. Scale bar: 50 μm. (F) Percentage of CTLs in tumor-adjacent livers or KPPC tumors from WT and Trail-r-/- mice (n ≥ 3). (G) Percentage of reactive CTLs in tumor-adjacent livers or KPPC tumors from WT and Trail-r-/- mice (n ≥ 3). (H) Percentage of CD4+ T cells of CD45+ cells in tumor-adjacent livers and SB tumors from WT and Trail-r-/- mice (n ≥ 2). (I) Percentage of NK cells of CD45+ cells in tumor-adjacent livers and SB tumors from WT and Trail-r-/- mice (n ≥ 8). (J) Percentage of Annexin V+7AAD+ CTLs in tumor-adjacent livers or SB tumors from WT and Trail-r-/- mice (n ≥ 5). (K) Percentage of Ki67+ CTLs in tumor-adjacent livers or SB tumors from WT and Trail-r-/- mice (n ≥ 5). Data are represented as means ± SD. Unpaired Student t test was used. ∗P < .05, ∗∗P < .01, and ∗∗∗P < .001. PD-1, programmed death-1.
Figure 4
Figure 4
TRAIL/TRAIL-R does not have a direct effect on CD8+T cells. (A) Schematic of T cell and SB cell coculture experiment. Cells were cocultured for 36 hours. (B) Percentage of Ki67+CD8+ T cells (right panel), percentage of Annexin V+7AAD+ CD8+ T cells (middle panel), and ratio of proliferation/apoptosis (left panel) (n ≥ 5). (C) Percentage of CD69+ CTLs after 36 hours of coculture with SB cells (n ≥ 5). (D) Percentage of interferon (IFN)γ+ CTLs after 36 hours of coculture with SB cells (n ≥ 5). (E) Percentage of T cell immunoglobulin and mucin domain-containing protein 3 (TIM3)+ CTLs after 36 hours of coculture with SB cells (n ≥ 5). (F) Percentage of PD-1+ CTLs after 36 hours of coculture with SB cells (n ≥ 5). (G) Expression of Trail-r in CD8+ T cells isolated from Trail-rf/f (f/f) and Cd8creTrail-rf/f (ΔCd8) mice. 18s ribosomal RNA was used as a normalization control. Water was used as a no template control (NTC). (H) Schematic of CD8creTrail-rf/f (ΔCd8) model of CCA implanted with SB cells. (I) Average tumor weight of f/f or ΔCd8 mice (n ≥ 3). (J) Representative photographs of livers from panel I. Scale bar: 0.5 cm. (K) Representative photomicrographs of H&E-stained and KRT19 immunohistochemistry of SB tumor section from f/f and ΔCd8 mice. Scale bar: 50 μm. Data are represented as means ± SD. Unpaired Student t test was used. PD-1, programmed death-1. All photomicrographs represent results from at least n ≥ 3 mice.
Figure 5
Figure 5
Genetic deletion of Trail-r restricts murine tumor progression via significant reduction in MDSCs. (A) Percentage of G-MDSCs of CD45+ cells and (B) M-MDSCs of CD45+ cells in WT mouse livers from mice without tumors, tumor-adjacent livers, and SB tumors from WT and Trail-r-/- mice (n ≥ 5). (C) Percentage of macrophages of CD45+ cells, (D) percentage of TAMs, (E) Percentage of M1-like macrophages of CD45+ cells, and (F) percentage of dendritic cells of CD45+ cells in WT mouse livers from mice without tumors, tumor-adjacent livers, and SB tumors from WT and Trail-r-/- mice (n ≥ 5). (G) Percentage of G-MDSCs and (H) M-MDSCs in tumor-adjacent livers and KPPC tumors from WT and Trail-r-/- mice (n ≥ 4). (I) Percentage of macrophages of CD45+ cells, (J) percentage of M1-like macrophages of CD45+ cells, and (K) percentage of TAMs of CD45+ cells in tumor-adjacent livers and KPPC tumors from WT and Trail-r-/- mice (n ≥ 4). Data are represented as means ± SD. Unpaired Student t test was used. ∗∗P < .01, ∗∗∗P < .001.
Figure 6
Figure 6
TRAIL/TRAIL-R promotes tumor progression by increasing MDSC abundance. (A) Schematic of LysMcreTrail-rf/f mouse model of CCA and Trail-rf/f mice. Expression of Trail-r in MDSCs from Trail-rf/f and LysMcreTrail-rf/f (Δmye) mice. 18S ribosomal RNA was used as a normalization control. Water was used as a no template control (NTC). (B) Average tumor weight of SB tumor-bearing f/f or Δmye mice (n ≥ 8). (C) Representative photographs of livers from panel B. Scale bar: 0.5 cm. (D) Average tumor weight of KPPC tumor-bearing f/f or Δmye mice (n = 4). (E) Representative photographs of livers from panel D. Scale bar: 0.5 cm. (F) Representative photomicrographs of H&E-stained and KRT19 immunohistochemistry of SB tumor section from f/f and ΔCd8 mice. Scale bar: 50 μm. (G) Percentage of CTLs and reactive CTLs in SB tumors from f/f and Δmye mice (n ≥ 8). (H) Percentage of G-MDSCs in SB tumors from f/f and Δmye mice (n ≥ 6). (I) Percentage of M-MDSCs in SB tumors from f/f and Δmye mice (n ≥ 6). (J) Percentage of macrophages of CD45+ cells in tumor-adjacent livers and SB tumors from f/f and Δmye mice (n ≥ 6). (K) Percentage of CD206+ macrophages of CD45+ cells in tumor-adjacent livers and SB tumors from f/f and Δmye mice (n ≥ 6). (L) Percentage of M1-like macrophages of CD45+ cells in tumor-adjacent livers and SB tumors from f/f and Δmye mice (n ≥ 6). Data are represented as means ± SD. Unpaired Student t test was used. ∗P < .05, ∗∗∗P < .001. All photomicrographs represent results from n ≥ 3 mice.
Figure 7
Figure 7
TRAIL/TRAIL-R augments MDSC abundance via enhanced cellular proliferation. (A) Percentage of Annexin V+7AAD+ G-MDSCs in tumor-adjacent livers and SB tumors from WT and Trail-r-/- mice (n ≥ 5). (B) Percentage of Ki67+ G-MDSCs in tumor-adjacent livers and SB tumors from WT and Trail-r-/- mice (n ≥ 4). (C) Percentage of Annexin V+7AAD+ G-MDSCs in tumor-adjacent livers and SB tumors from f/f and Δmye mice (n ≥ 11). (D) Percentage of Ki67+ G-MDSCs in tumor-adjacent livers and SB tumors from f/f and Δmye mice (n ≥ 11). (E) Percentage of Annexin V+7AAD+ M-MDSCs in tumor-adjacent livers and SB tumors from WT and Trail-r-/- mice (n ≥ 5). (F) Percentage of Ki67+ M-MDSCs in tumor-adjacent livers and SB tumors from WT and Trail-r-/- mice (n ≥ 4). (G) Percentage of arginase 1+ G-MDSCs in tumor-adjacent livers and SB tumors from WT and Trail-r-/- mice (n ≥ 5). (H) Percentage of IL10+ G-MDSCs in tumor-adjacent livers and SB tumors from WT and Trail-r-/- mice (n ≥ 4). (I) Percentage of arginase 1+ M-MDSCs in tumor-adjacent livers and SB tumors from WT and Trail-r-/- mice (n ≥ 5). (J) Percentage of IL10+ M-MDSCs in tumor-adjacent livers and SB tumors from WT and Trail-r-/- mice (n ≥ 4). (K) Percentage of arginase 1+ G-MDSCs in tumor-adjacent livers and SB tumors from f/f and Δmye mice (n ≥ 11). (L) Percentage of IL10+ G-MDSCs in tumor-adjacent livers and SB tumors from f/f and Δmye mice (n ≥ 11). (M) Percentage of arginase 1+ M-MDSCs in tumor-adjacent livers and SB tumors from f/f and Δmye mice (n ≥ 11). (N) Percentage of IL10+ M-MDSCs in tumor-adjacent livers and SB tumors from f/f and Δmye mice (n ≥ 11). Data are represented as means ± SD. An unpaired Student t test was used. ∗P < .05, ∗∗P < .01.
Figure 8
Figure 8
MDSC proliferation is a direct effect of TRAIL signaling activation. (A) Schematic of in vitro coculture of SB cells and BM-derived MDSCs from WT and Trail-r mice. Expression of Trail-r in MDSCs from WT and Trail-r mice. 18s ribosomal RNA was used as a normalization control. (B) Percentage of Ki67+ MDSCs after 24 hours of coculture with SB cells (n ≥ 10). (C) Percentage of arginase 1+ MDSCs and (D) IL10+ MDSCs after 24 hours of coculture with SB cells (n ≥ 10). Data are represented as means ± SD. An unpaired Student t test was used. ∗∗∗P < .001. Gr-1, granulocyte receptor-1 antigen; NTC, no template control.
Figure 9
Figure 9
Noncanonical TRAIL-R signaling promotes MDSC survival in an NF-κB–dependent manner. (A) Immunoblot analysis for IκBα phosphorylation in BM-MDSCs incubated with SB cell CM. Total IκBα was used as a loading control. (B) Immunoblot analysis for the p65 subunit of NF-κB pathway activation in nuclear extracts of BM-MDSCs incubated with SB cell conditioned medium. Histone H3 was used as loading control. (C) Immunoblot analysis for IκBα phosphorylation (p-IκBα) in MDSCs isolated from WT and Trail-r-/- mice and incubated with SB cell conditioned medium. Total IκBα was used as loading control. (D) Immunoblot analysis for the p65 subunit in nuclear extracts of MDSCs from WT and Trail-r-/- mice and incubated with SB cell conditioned medium. Lamin B2 was used as loading control. (E) Schematic of in vitro experiment with MDSCs from WT mice incubated with/without TPCA-1 and/or SB cells. Cells were cocultured for 48 hours. (F) Percentage of Ki67+ MDSCs (CD11b+Gr-1+) (n ≥ 6). (G) Uniform manifold approximation and projection (UMAP) plot of 42031 immune cells from SB, KPPC, and FAC tumors. (H) Seurat module score for the NF-κB pathway was calculated in tumors from 3 murine CCA models (SB, KPPC, FAC) using scRNA-seq data. Data are represented as means ± SD. An unpaired Student t test was used. ∗∗∗P < .001. DC, dendritic cell. Gr-1, granulocyte receptor-1 antigen.
Figure 10
Figure 10
Enhanced cFLIP expression confers resistance to canonical, proapoptotic TRAIL signaling in MDSCs. (A) Viability assay in BM-MDSCs treated with vehicle or different formulations of recombinant mouse TRAIL (200 ng/mL) for 48 hours (n = 4). (B) scRNA-seq data showing the percentage of Cflar+ MDSCs from tumor-adjacent liver and tumors from SB, KPPC, and FAC tumor-bearing mice. (C) mRNA expression of Cflar in murine WT MDSCs incubated with/without SB CM (n = 4). (D) Immunoblot analysis for FLIPL in WT murine MDSCs incubated with SB conditioned medium (CM) for 24, 48, and 72 hours. β-actin was used as a loading control. (E) Immunoblot analysis for FLIPL in murine WT MDSCs and Trail-r-/- MDSCs after 48 hours of culture with SB CM. β-actin was used as a loading control. mRNA expression of (F) xiap, (G) ciap-1, (H) ciap-2, (I) Mcl-1, (J) Bcl-2, and (K) Bcl-xL in WT and Trail-r-/- MDSCs incubated with control medium (Dulbecco’s modified Eagle medium [DMEM]) or SB conditioned medium (SB CM). (L) mRNA expression of Cflar in murine WT MDSCs after transfection with siNT or siCflar (n = 4). (M) Percentage of Annexin V+7AAD+ MDSCs after transfection with siNT or siCflar and incubation with/without SB CM for 24 hours (n ≥ 5). Data are represented as means ± SD. An unpaired Student t test was used. ∗P < .05, ∗∗P < .01, and ∗∗∗P < .001. Adj, Adjacent; Tx, Treatment; Veh, vehicle.
Figure 11
Figure 11
TRAIL/TRAIL-R has pleiotropic effects on the CCA TIME. (A) Schematic of WT C57BL/6J mice implanted with SB-NT, SB-Trail-/-, or SB-Trail-r-/-. (B) Average tumor weights of WT mice implanted with SB-NT, SB-Trail-/-, or SB-Trail-r-/- (n ≥ 17). (C) Representative photographs of livers from panel B. Scale bar: 0.5 cm. (D) Representative photomicrographs of H&E-stained (left panel) and KRT19 immunohistochemistry (right panel) of SB tumor sections from WT mice implanted with SB-NT, SB-Trail-/-, or SB-Trail-r-/- cells. (E) Ultrasound images depict representative tumor cross-sectional areas on day 25 after implantation of SB-NT or SB-Trail-/- cells. Total volumetric area was quantified after 3-dimensional reconstruction using Prospect software. (F) Percentage of G-MDSCs in tumor-adjacent livers and tumors from WT mice bearing SB-NT or SB-Trail-/- tumors (n ≥ 4). (G) Percentage of M-MDSCs in tumor-adjacent livers and tumors from WT mice bearing SB-NT or SB-Trail-/- tumors (n ≥ 4). (H) Percentage of macrophages in tumor-adjacent livers and tumors from WT mice bearing SB-NT or SB-Trail-/- tumors (n ≥ 4). (I) Percentage of TAMs in tumor-adjacent livers and tumors from WT mice bearing SB-NT or SB-Trail-/- tumors (n ≥ 4). (J) Percentage of M1-like macrophages in tumor-adjacent livers and tumors from WT mice bearing SB-NT or SB-Trail-/- tumors (n ≥ 4). (K) Percentage of CTLs in tumor-adjacent livers and tumors from WT mice bearing SB-NT or SB-Trail-/- tumors (n ≥ 4). (L) Percentage of reactive CTLs in tumor-adjacent livers and tumors from WT mice bearing SB-NT or SB-Trail-/- tumors (n ≥ 4). (M) Schematic depicting coculture experiment with MDSCs and SB-NT or SB-Trail-/- cells. Cells were cocultured for 48 hours. (N) Percentage of Annexin V+7AAD+ MDSCs (left panel), and percentage of Ki67+ MDSCs (right panel) after 48 hours of coculture with SB-NT or SB-Trail-/- cells (n ≥ 9). (O) Left: Proliferating cancer cells were quantified by counting Ki67-positive cells in 5 random microscopic fields using a fluorescent microscope. Right: Representative photomicrographs depicting Ki67 and KRT19 staining (red and green, respectively) in sections of SB-NT or SB-Trail-r-/- tumors. Nuclei were counterstained with Hoechst stain. Scale bar: 50 μm. (P) Left: Apoptotic cancer cells were quantified by counting TUNEL-positive nuclei in 5 random microscopic fields using a fluorescent microscope. Right: Representative photomicrographs depicting apoptotic cancer cells using TUNEL and KRT19 staining (red and green, respectively) in sections of SB-NT or SB-Trail-r-/- tumors. Nuclei were counterstained with Hoechst stain. Scale bar: 50 μm. Data are represented as means ± SD. An unpaired Student t test was used. ∗P < .05. NT, non-target. All photomicrographs represent results from at least n ≥ 3 mice.
Figure 12
Figure 12
Higher TRAIL levels correlate with higher MDSC gene expression in human CCA. (A) TRAIL (TNFSF10) expression level in MDSCs from human CCA and (B) correlation of TRAIL (TNFSF10) expression with MDSC signature genes were analyzed using a published data set (GSE76297). (C) Heatmap depicting normalized gene expression data for MDSC signature genes for 92 CCA tumor samples from a Gene Expression Omnibus data set (GSE76297). Data are represented as means ± SD. An unpaired Student t test was used. ∗∗P < .01.

Update of

Similar articles

Cited by

References

    1. von Karstedt S., Montinaro A., Walczak H. Exploring the TRAILs less travelled: TRAIL in cancer biology and therapy. Nat Rev Cancer. 2017;17:352–366. - PubMed
    1. Pan G., O'Rourke K., Chinnaiyan A.M., et al. The receptor for the cytotoxic ligand TRAIL. Science. 1997;276:111–113. - PubMed
    1. Walczak H., Degli-Esposti M.A., Johnson R.S., et al. TRAIL-R2: a novel apoptosis-mediating receptor for TRAIL. EMBO J. 1997;16:5386–5397. - PMC - PubMed
    1. Wu G.S., Burns T.F., Zhan Y., et al. Molecular cloning and functional analysis of the mouse homologue of the KILLER/DR5 tumor necrosis factor-related apoptosis-inducing ligand (TRAIL) death receptor. Cancer Res. 1999;59:2770–2775. - PubMed
    1. Hartwig T., Montinaro A., von Karstedt S., et al. The TRAIL-induced cancer secretome promotes a tumor-supportive immune microenvironment via CCR2. Mol Cell. 2017;65:730–742 e5. - PMC - PubMed