Ryanodine receptor dysfunction causes senescence and fibrosis in Duchenne dilated cardiomyopathy
- PMID: 38221511
- PMCID: PMC10995256
- DOI: 10.1002/jcsm.13411
Ryanodine receptor dysfunction causes senescence and fibrosis in Duchenne dilated cardiomyopathy
Abstract
Background: Duchenne muscular dystrophy (DMD) is an X-linked disorder characterized by progressive muscle weakness due to the absence of functional dystrophin. DMD patients also develop dilated cardiomyopathy (DCM). We have previously shown that DMD (mdx) mice and a canine DMD model (GRMD) exhibit abnormal intracellular calcium (Ca2+) cycling related to early-stage pathological remodelling of the ryanodine receptor intracellular calcium release channel (RyR2) on the sarcoplasmic reticulum (SR) contributing to age-dependent DCM.
Methods: Here, we used hiPSC-CMs from DMD patients selected by Speckle-tracking echocardiography and canine DMD cardiac biopsies to assess key early-stage Duchenne DCM features.
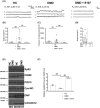
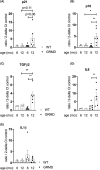
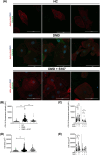
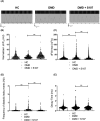
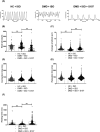
Results: Dystrophin deficiency was associated with RyR2 remodelling and SR Ca2+ leak (RyR2 Po of 0.03 ± 0.01 for HC vs. 0.16 ± 0.01 for DMD, P < 0.01), which led to early-stage defects including senescence. We observed higher levels of senescence markers including p15 (2.03 ± 0.75 for HC vs. 13.67 ± 5.49 for DMD, P < 0.05) and p16 (1.86 ± 0.83 for HC vs. 10.71 ± 3.00 for DMD, P < 0.01) in DMD hiPSC-CMs and in the canine DMD model. The fibrosis was increased in DMD hiPSC-CMs. We observed cardiac hypocontractility in DMD hiPSC-CMs. Stabilizing RyR2 pharmacologically by S107 prevented most of these pathological features, including the rescue of the contraction amplitude (1.65 ± 0.06 μm for DMD vs. 2.26 ± 0.08 μm for DMD + S107, P < 0.01). These data were confirmed by proteomic analyses, in particular ECM remodelling and fibrosis.
Conclusions: We identified key cellular damages that are established earlier than cardiac clinical pathology in DMD patients, with major perturbation of the cardiac ECC. Our results demonstrated that cardiac fibrosis and premature senescence are induced by RyR2 mediated SR Ca2+ leak in DMD cardiomyocytes. We revealed that RyR2 is an early biomarker of DMD-associated cardiac damages in DMD patients. The progressive and later DCM onset could be linked with the RyR2-mediated increased fibrosis and premature senescence, eventually causing cell death and further cardiac fibrosis in a vicious cycle leading to further hypocontractility as a major feature of DCM. The present study provides a novel understanding of the pathophysiological mechanisms of the DMD-induced DCM. By targeting RyR2 channels, it provides a potential pharmacological treatment.
Keywords: Calcium; DMD; Ryanodine receptor; Senescence; hiPSC‐derived cardiomyocytes.
© 2024 The Authors. Journal of Cachexia, Sarcopenia and Muscle published by Wiley Periodicals LLC.
Conflict of interest statement
A.R.M. is a board member and owns shares in ARMGO Pharma Inc., which is targeting RyR channels for therapeutic purposes. The rest of the authors declare no conflict of interest.
Figures


Similar articles
-
Leaky RyR2 trigger ventricular arrhythmias in Duchenne muscular dystrophy.Proc Natl Acad Sci U S A. 2010 Jan 26;107(4):1559-64. doi: 10.1073/pnas.0908540107. Epub 2010 Jan 4. Proc Natl Acad Sci U S A. 2010. PMID: 20080623 Free PMC article.
-
Intracellular calcium handling in ventricular myocytes from mdx mice.Am J Physiol Heart Circ Physiol. 2007 Feb;292(2):H846-55. doi: 10.1152/ajpheart.00688.2006. Epub 2006 Sep 29. Am J Physiol Heart Circ Physiol. 2007. PMID: 17012353
-
Personalized medicine in the dish to prevent calcium leak associated with short-coupled polymorphic ventricular tachycardia in patient-derived cardiomyocytes.Stem Cell Res Ther. 2023 Sep 23;14(1):266. doi: 10.1186/s13287-023-03502-5. Stem Cell Res Ther. 2023. PMID: 37740238 Free PMC article.
-
Modeling Duchenne Muscular Dystrophy Cardiomyopathy with Patients' Induced Pluripotent Stem-Cell-Derived Cardiomyocytes.Int J Mol Sci. 2023 May 12;24(10):8657. doi: 10.3390/ijms24108657. Int J Mol Sci. 2023. PMID: 37240001 Free PMC article. Review.
-
Dysregulation of Calcium Handling in Duchenne Muscular Dystrophy-Associated Dilated Cardiomyopathy: Mechanisms and Experimental Therapeutic Strategies.J Clin Med. 2020 Feb 14;9(2):520. doi: 10.3390/jcm9020520. J Clin Med. 2020. PMID: 32075145 Free PMC article. Review.
Cited by
-
Conduction defects and arrhythmias in mdx mice are not associated with a degeneration of the cardiac Purkinje network.Front Physiol. 2025 Jun 26;16:1607916. doi: 10.3389/fphys.2025.1607916. eCollection 2025. Front Physiol. 2025. PMID: 40642299 Free PMC article.
-
Calcium handling remodeling in dilated cardiomyopathy: From molecular mechanisms to targeted therapies.Channels (Austin). 2025 Dec;19(1):2519545. doi: 10.1080/19336950.2025.2519545. Epub 2025 Jun 16. Channels (Austin). 2025. PMID: 40523026 Free PMC article. Review.
References
-
- Kamdar F, Garry DJ. Dystrophin‐deficient cardiomyopathy. J Am Coll Cardiol 2016;67:2533–2546. - PubMed
-
- Cazorla O, Barthélémy I, Su JB, Meli AC, Chetboul V, Scheuermann V, et al. Stabilizing ryanodine receptors improves left ventricular function in juvenile dogs with Duchenne muscular dystrophy. J Am Coll Cardiol 2021;78:2439–2453. - PubMed
MeSH terms
Substances
Grants and funding
- ANR-10-INBS-04/French National Research Agency
- 17124/French Muscular Dystrophy Association
- 16396/French Muscular Dystrophy Association
- 15632/French Muscular Dystrophy Association
- 15208/French Muscular Dystrophy Association
- 14389/French Muscular Dystrophy Association
- 20225/French Muscular Dystrophy Association
- MNM2 2012/French Muscular Dystrophy Association
- 16073/French Muscular Dystrophy Association
- 15083/French Muscular Dystrophy Association
- SPF20130526710/'Fondation de la Recherche Médicale'
- Institut National pour la Santé et la Recherche Médicale' (INSERM)
- 'Fondation Coeur et Recherche'
LinkOut - more resources
Full Text Sources
Medical
Research Materials
Miscellaneous

