

Cellograph: a semi-supervised approach to analyzing multi-condition single-cell RNA-sequencing data using graph neural networks
- PMID: 38221640
- PMCID: PMC10788980
- DOI: 10.1186/s12859-024-05641-9
Cellograph: a semi-supervised approach to analyzing multi-condition single-cell RNA-sequencing data using graph neural networks
Abstract
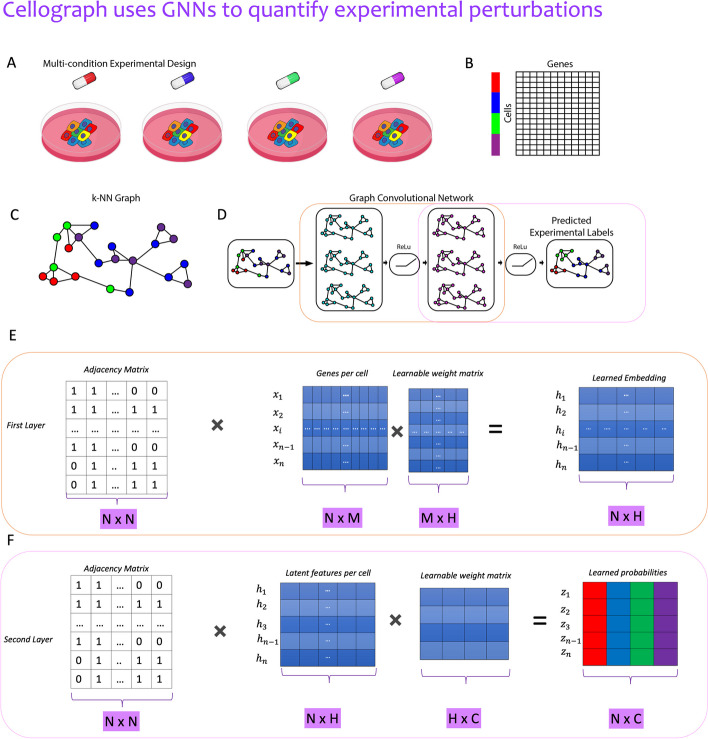
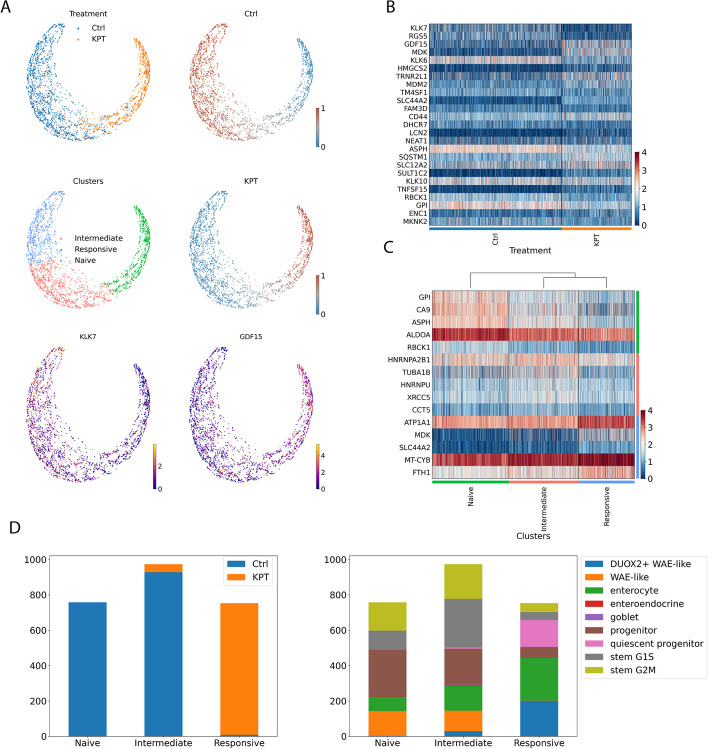
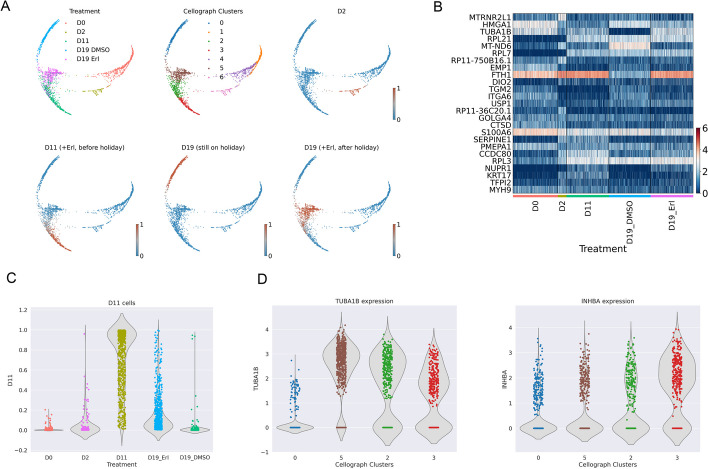
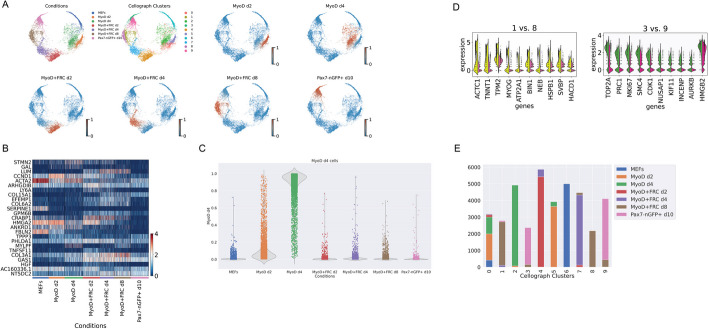
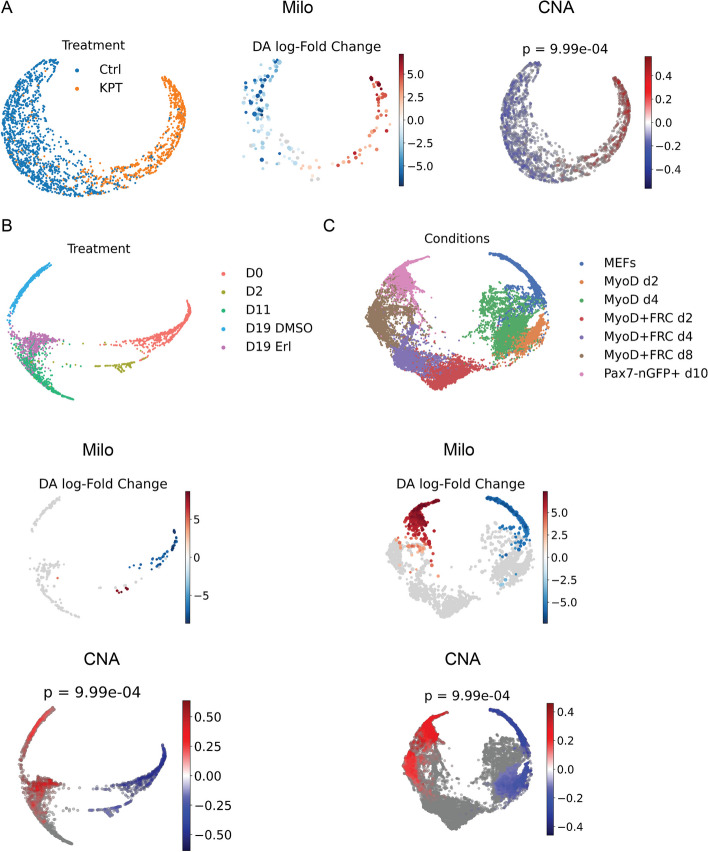
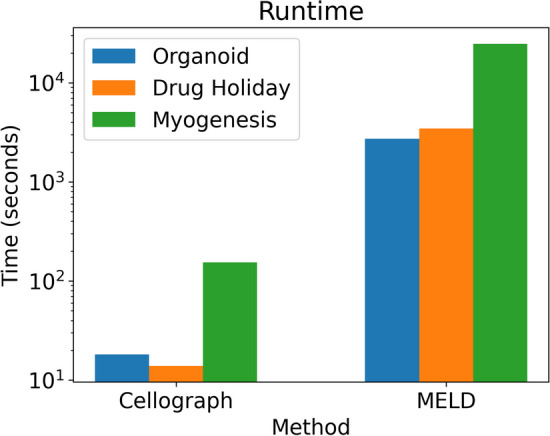
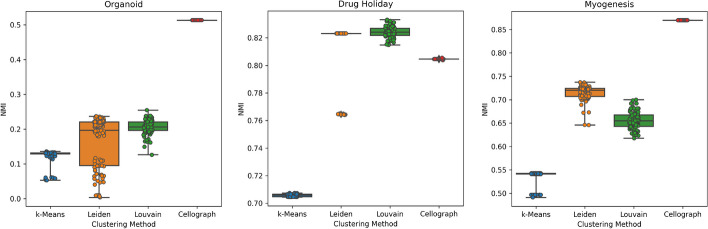
With the growing number of single-cell datasets collected under more complex experimental conditions, there is an opportunity to leverage single-cell variability to reveal deeper insights into how cells respond to perturbations. Many existing approaches rely on discretizing the data into clusters for differential gene expression (DGE), effectively ironing out any information unveiled by the single-cell variability across cell-types. In addition, DGE often assumes a statistical distribution that, if erroneous, can lead to false positive differentially expressed genes. Here, we present Cellograph: a semi-supervised framework that uses graph neural networks to quantify the effects of perturbations at single-cell granularity. Cellograph not only measures how prototypical cells are of each condition but also learns a latent space that is amenable to interpretable data visualization and clustering. The learned gene weight matrix from training reveals pertinent genes driving the differences between conditions. We demonstrate the utility of our approach on publicly-available datasets including cancer drug therapy, stem cell reprogramming, and organoid differentiation. Cellograph outperforms existing methods for quantifying the effects of experimental perturbations and offers a novel framework to analyze single-cell data using deep learning.
Keywords: Graph neural networks; Semi-supervised learning; Single-cell genomics.
© 2024. The Author(s).
Conflict of interest statement
The authors declare that they have no competing interests.
Figures
Similar articles
-
MGLNN: Semi-supervised learning via Multiple Graph Cooperative Learning Neural Networks.Neural Netw. 2022 Sep;153:204-214. doi: 10.1016/j.neunet.2022.05.024. Epub 2022 Jun 3. Neural Netw. 2022. PMID: 35750007
-
Deep structural clustering for single-cell RNA-seq data jointly through autoencoder and graph neural network.Brief Bioinform. 2022 Mar 10;23(2):bbac018. doi: 10.1093/bib/bbac018. Brief Bioinform. 2022. PMID: 35172334
-
Deep semi-supervised learning via dynamic anchor graph embedding in latent space.Neural Netw. 2022 Feb;146:350-360. doi: 10.1016/j.neunet.2021.11.026. Epub 2021 Dec 1. Neural Netw. 2022. PMID: 34929418
-
A unified deep semi-supervised graph learning scheme based on nodes re-weighting and manifold regularization.Neural Netw. 2023 Jan;158:188-196. doi: 10.1016/j.neunet.2022.11.017. Epub 2022 Nov 19. Neural Netw. 2023. PMID: 36462365
-
scSemiAAE: a semi-supervised clustering model for single-cell RNA-seq data.BMC Bioinformatics. 2023 May 26;24(1):217. doi: 10.1186/s12859-023-05339-4. BMC Bioinformatics. 2023. PMID: 37237310 Free PMC article.
Cited by
-
Graph neural networks for single-cell omics data: a review of approaches and applications.Brief Bioinform. 2025 Mar 4;26(2):bbaf109. doi: 10.1093/bib/bbaf109. Brief Bioinform. 2025. PMID: 40091193 Free PMC article.
-
AI-Driven Transcriptome Prediction in Human Pathology: From Molecular Insights to Clinical Applications.Biology (Basel). 2025 Jun 4;14(6):651. doi: 10.3390/biology14060651. Biology (Basel). 2025. PMID: 40563902 Free PMC article. Review.
-
AI-Driven Quality Monitoring and Control in Stem Cell Cultures: A Comprehensive Review.Biotechnol J. 2025 Aug;20(8):e70100. doi: 10.1002/biot.70100. Biotechnol J. 2025. PMID: 40785233 Free PMC article. Review.
-
Uncovering latent biological function associations through gene set embeddings.BMC Bioinformatics. 2025 Mar 24;26(1):90. doi: 10.1186/s12859-025-06100-9. BMC Bioinformatics. 2025. PMID: 40128671 Free PMC article.
References
-
- Reshef YA, Rumker L, Kang JB, Nathan A, Korsunsky I, Asgari S, Murray MB, Moody DB, Raychaudhuri S. Co-varying neighborhood analysis identifies cell populations associated with phenotypes of interest from single-cell transcriptomics. Nat Biotechnol. 2021;40(3):355–363. doi: 10.1038/s41587-021-01066-4. - DOI - PMC - PubMed
MeSH terms
Substances
LinkOut - more resources
Full Text Sources
