Childhood, adolescent, and adult primary brain and central nervous system tumor statistics for practicing healthcare providers in neuro-oncology, CBTRUS 2015-2019
- PMID: 38222052
- PMCID: PMC10785588
- DOI: 10.1093/nop/npad061
Childhood, adolescent, and adult primary brain and central nervous system tumor statistics for practicing healthcare providers in neuro-oncology, CBTRUS 2015-2019
Abstract
Background: The Central Brain Tumor Registry of the United States (CBTRUS), in collaboration with the Centers for Disease Control and Prevention (CDC) and National Cancer Institute (NCI), is the largest aggregation of histopathology-specific population-based data for primary brain and other central nervous system (CNS) in the US. CBTRUS publishes an annual statistical report which provides critical reference data for the broad neuro-oncology community. Here, we summarize the key findings from the 2022 CBTRUS annual statistical report for healthcare providers.
Methods: Incidence data were obtained from the CDC's National Program of Cancer Registries (NPCR) and NCI's Surveillance, Epidemiology, and End Results Program for 52 central cancer registries (CCRs). Survival data were obtained from 42 NPCR CCRs. All rates are per 100 000 and age-adjusted using the 2000 US standard population. Overall median survival was estimated using Kaplan-Meier models. Survival data for selected molecularly defined histopathologies are from the National Cancer Database. Mortality data are from the National Vital Statistics System.
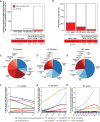
Results: The average annual age-adjusted incidence rate of all primary brain and other CNS tumors was 24.25/100 000. Incidence was higher in females and non-Hispanics. The most commonly occurring malignant and predominately non-malignant tumors was glioblastoma (14% of all primary brain tumors) and meningioma (39% of all primary brain tumors), respectively. Mortality rates and overall median survival varied by age, sex, and histopathology.
Conclusions: This summary describes the most up-to-date population-based incidence, mortality, and survival, of primary brain and other CNS tumors in the US and aims to serve as a concise resource for neuro-oncology providers.
Keywords: Central Brain Tumor Registry of the United States; brain tumors; epidemiology; neuro-oncology.
© The Author(s) 2023. Published by Oxford University Press on behalf of the Society for Neuro-Oncology and the European Association of Neuro-Oncology. All rights reserved. For permissions, please e-mail: journals.permissions@oup.com.
Conflict of interest statement
Jill S. Barnholtz-Sloan, PhD, is a full-time paid employee of the NIH/NCI. Gino Cioffi, MPH, and Kristin A. Waite, PhD, are full-time contractors of the NIH/NCI.
Figures


References
-
- Kromer C, Xu J, Ostrom QT, et al. Estimating the annual frequency of synchronous brain metastasis in the United States 2010-2013: a population-based study. J Neurooncol. 2017;134(1):55–64. - PubMed
Publication types
LinkOut - more resources
Full Text Sources

