

Machine Learning Models for Predicting Stroke Mortality in Malaysia: An Application and Comparative Analysis
- PMID: 38222138
- PMCID: PMC10784718
- DOI: 10.7759/cureus.50426
Machine Learning Models for Predicting Stroke Mortality in Malaysia: An Application and Comparative Analysis
Abstract
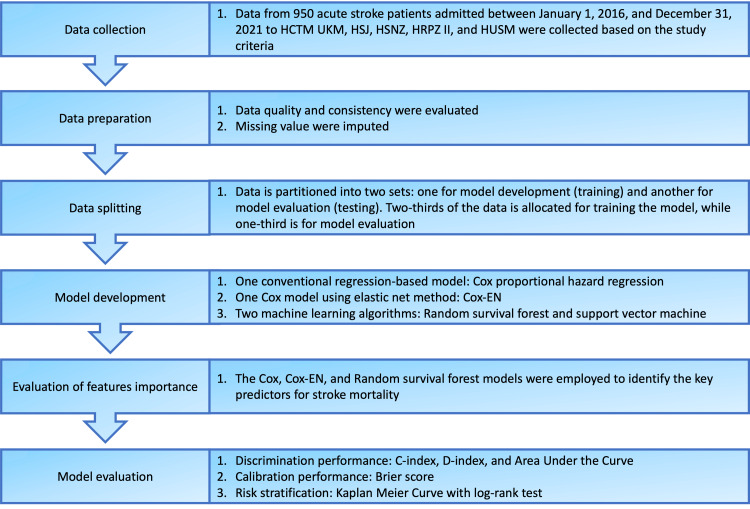
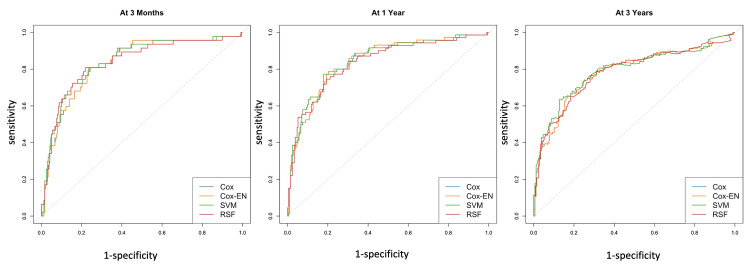
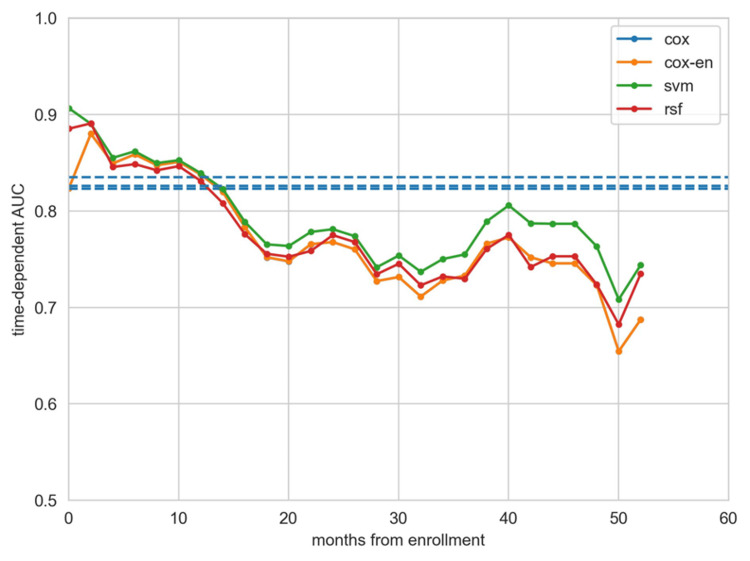
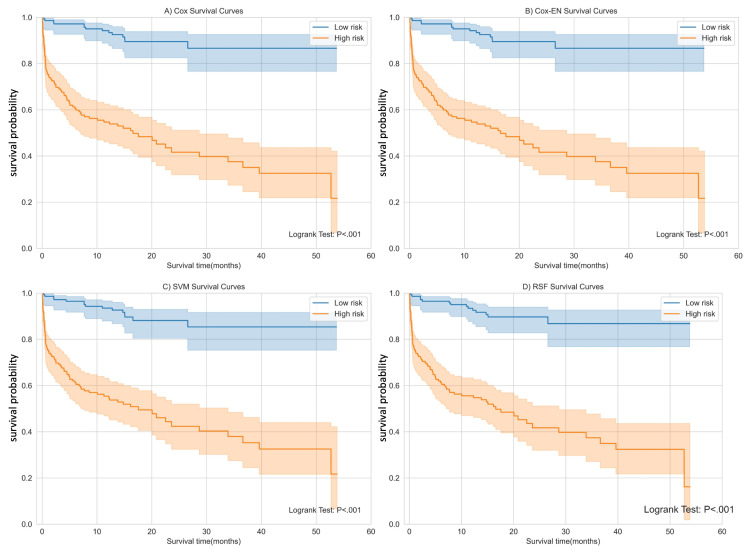
Background Stroke is a significant public health concern characterized by increasing mortality and morbidity. Accurate long-term outcome prediction for acute stroke patients, particularly stroke mortality, is vital for clinical decision-making and prognostic management. This study aimed to develop and compare various prognostic models for stroke mortality prediction. Methods In a retrospective cohort study from January 2016 to December 2021, we collected data from patients diagnosed with acute stroke from five selected hospitals. Data contained variables on demographics, comorbidities, and interventions retrieved from medical records. The cohort comprised 950 patients with 20 features. Outcomes (censored vs. death) were determined by linking data with the Malaysian National Mortality Registry. We employed three common survival modeling approaches, the Cox proportional hazard regression (Cox), support vector machine (SVM), and random survival forest (RSF), while enhancing the Cox model with Elastic Net (Cox-EN) for feature selection. Models were compared using the concordance index (C-index), time-dependent area under the curve (AUC), and discrimination index (D-index), with calibration assessed by the Brier score. Results The support vector machine (SVM) model excelled among the four, with three-month, one-year, and three-year time-dependent AUC values of 0.842, 0.846, and 0.791; a D-index of 5.31 (95% CI: 3.86, 7.30); and a C-index of 0.803 (95% CI: 0.758, 0.847). All models exhibited robust calibration, with three-month, one-year, and three-year Brier scores ranging from 0.103 to 0.220, all below 0.25. Conclusion The support vector machine (SVM) model demonstrated superior discriminative performance, suggesting its efficacy in developing prognostic models for stroke mortality. This study enhances stroke mortality prediction and supports clinical decision-making, emphasizing the utility of the support vector machine method.
Keywords: comparative analysis; machine learning; malaysia; prediction models; stroke mortality.
Copyright © 2023, Che Nawi et al.
Conflict of interest statement
The authors have declared that no competing interests exist.
Figures


Similar articles
-
The Application and Comparison of Machine Learning Models for the Prediction of Breast Cancer Prognosis: Retrospective Cohort Study.JMIR Med Inform. 2022 Feb 18;10(2):e33440. doi: 10.2196/33440. JMIR Med Inform. 2022. PMID: 35179504 Free PMC article.
-
Development and validation of machine learning models for predicting prognosis and guiding individualized postoperative chemotherapy: A real-world study of distal cholangiocarcinoma.Front Oncol. 2023 Mar 15;13:1106029. doi: 10.3389/fonc.2023.1106029. eCollection 2023. Front Oncol. 2023. PMID: 37007095 Free PMC article.
-
Predicting Colorectal Cancer Survival Using Time-to-Event Machine Learning: Retrospective Cohort Study.J Med Internet Res. 2023 Oct 26;25:e44417. doi: 10.2196/44417. J Med Internet Res. 2023. PMID: 37883174 Free PMC article.
-
Can Predictive Modeling Tools Identify Patients at High Risk of Prolonged Opioid Use After ACL Reconstruction?Clin Orthop Relat Res. 2020 Jul;478(7):0-1618. doi: 10.1097/CORR.0000000000001251. Clin Orthop Relat Res. 2020. PMID: 32282466 Free PMC article.
-
A machine learning-based survival prediction model of high grade glioma by integration of clinical and dose-volume histogram parameters.Cancer Med. 2021 Apr;10(8):2774-2786. doi: 10.1002/cam4.3838. Epub 2021 Mar 24. Cancer Med. 2021. PMID: 33760360 Free PMC article.
Cited by
-
A comprehensive analysis of stroke risk factors and development of a predictive model using machine learning approaches.Mol Genet Genomics. 2025 Jan 24;300(1):18. doi: 10.1007/s00438-024-02217-3. Mol Genet Genomics. 2025. PMID: 39853452 Free PMC article.
References
-
- The logistic EuroSCORE. Roques F, Michel P, Goldstone AR, Nashef SAM. Eur Heart J. 2003;24:882–883. - PubMed
LinkOut - more resources
Full Text Sources
Research Materials