. 2021 Jul;54(29):294005.
doi: 10.1088/1361-6463/abf958. Epub 2021 May 14.

Compressive sensing for polarization sensitive optical coherence tomography

Affiliations

Compressive sensing for polarization sensitive optical coherence tomography

Jianfeng Wang et al. J Phys D Appl Phys. 2021 Jul.

Abstract

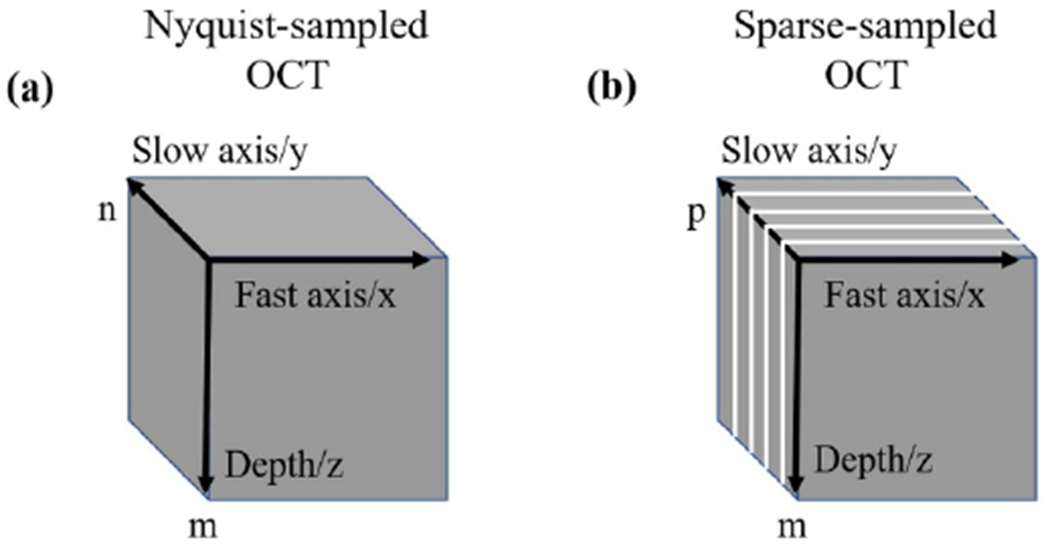
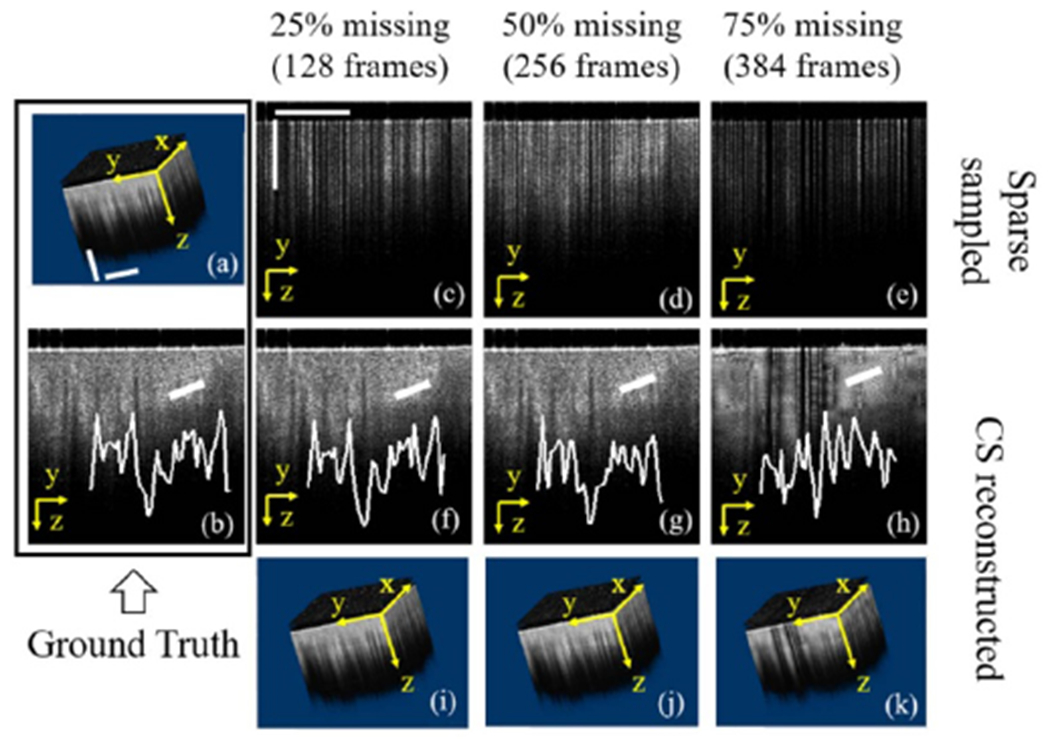
In this report, we report on the implementation of compressive sensing (CS) and sparse sampling in polarization sensitive optical coherence tomography (PS-OCT) to reduce the number of B-scans (frames consisting of an array of A-scans, where each represents a single depth profile of reflections) required for effective volumetric (3D dataset composed of an array of B-scans) PS-OCT measurements (i.e. OCT intensity, and phase retardation) reconstruction. Sparse sampling of PS-OCT is achieved through randomization of step sizes along the slow-axis of PS-OCT imaging, covering the same spatial ranges as those with equal slow-axis step sizes, but with a reduced number of B-scans. Tested on missing B-scan rates of 25%, 50% and 75%, we found CS could reconstruct reasonably good (as evidenced by a correlation coefficient >0.6) PS-OCT measurements with a maximum reduced B-scan rate of 50%, thereby accelerating and doubling the rate of volumetric PS-OCT measurements.

Keywords: compressive sensing; polarization sensitive optical coherence tomography; sparse sampling.


Conflict of interest statement

Conflict of interest S A B is co-founder of Diagnostic Photonics, Inc. which is commercializing interferometric synthetic aperture microscopy and OCT for intraoperative imaging applications.

Figures

Figure 1.
Figure 1.
Illustration of compressive sensing implementation on each channel of PS-OCT. (a) Volumetric OCT satisfying Nyquist-sampling along the slow axis. (b) Sparse sampled OCT along slow axis. The white lines indicated the missing B-scans. The pixel number along depth direction is m, as determined by the CCD pixel number. The B-scan (along y, z plane) number in (a) is n, whilst that for the sparse sampled OCT is p. One notes p < n, and (1 – p/n) is the missing B-scan rate reported.
Figure 2.
Figure 2.
CS implementation results on the OCT intensity of molded plastics, showing (a) volumetric and (b) representative cross-sectional OCT intensity satisfying Nyquist-sampling, (c)ဓ(e) cross-sections OCT intensity with missing B-frame rate of 25%, 50% and 75%, respectively. The corresponding CS reconstructed cross-sectional and volumetric OCT intensities were shown in (f)–(h) and (i)–(k), respectively. The scale bars along x/y and z direction represent 1 mm and 0.4 mm, respectively.
Figure 3.
Figure 3.
CS implementation results on the PS-OCT phase retardation images of molded plastics, showing (a) volumetric and (b) representative cross-sectional phase retardation image satisfying Nyquist-sampling, (c)–(e) cross-sectional PS-OCT phase retardation images with missing B-scan rates of 25%, 50% and 75%, respectively. The corresponding CS reconstructed cross-sectional and volumetric phase retardation images are shown in (f)–(h) and (i)–(k), respectively. The scale bars along x/y and z direction represent 1 mm and 0.4 mm, respectively.
Figure 4.
Figure 4.
CS implementation results on the OCT intensity images from ex vivo chicken breast, showing (a) volumetric and (b) representative cross-sectional OCT intensity image satisfying Nyquist-sampling, (c)–(e) cross-sectional OCT intensity images with missing B-frame rates of 25%, 50% and 75%, respectively. The corresponding CS reconstructed cross-sectional and volumetric OCT intensity images are shown in (f)–(h) and (i)–(k), respectively. The scale bars along x/y and z direction represent 1 mm and 0.4 mm, respectively.
Figure 5.
Figure 5.
CS implementation results on the PS-OCT phase retardation of ex vivo chicken breast, showing (a) volumetric and (b) representative cross-sectional PS-OCT phase retardation images satisfying Nyquist-sampling, (c)–(e) cross-sectional OCT phase retardation images with missing B-scan rates of 25%, 50% and 75%, respectively. The corresponding CS reconstructed cross-sectional and volumetric PS-OCT phase retardation images are shown in (f)–(h) and (i)–(k), respectively. The scale bars along x/y and z direction represent 1 mm and 0.4 mm, respectively.
Figure 6.
Figure 6.
CS implementation results on the OCT intensity images of ex vivo human breast tumor tissue, showing (a) volumetric and (b) representative cross-sectional OCT intensity images satisfying Nyquist-sampling, (c)–(e) cross-sectional OCT intensity images with missing B-scan rates of 25%, 50% and 75%, respectively. The corresponding CS reconstructed cross-sectional and volumetric OCT intensity images are shown in (f)–(h) and (i)–(k), respectively. The scale bars along x/y and z direction represent 1 mm and 0.4 mm, respectively.
Figure 7.
Figure 7.
CS implementation results on the PS-OCT phase retardation of ex vivo human breast tumor tissue, showing (a) volumetric and (b) representative cross-sectional PS-OCT phase retardation images satisfying Nyquist-sampling (c)–(e) cross-sectional PS-OCT phase retardation images with missing B-scan rates of 25%, 50% and 75%, respectively. The corresponding CS reconstructed cross-sectional and volumetric PS-OCT phase retardation images are shown in (f)–(h) and (i)–(k), respectively. The scale bars along x/y and z direction represent 1 mm and 0.4 mm, respectively.
Figure 8.
Figure 8.
Correlation coefficient changes of both OCT intensity (formula image
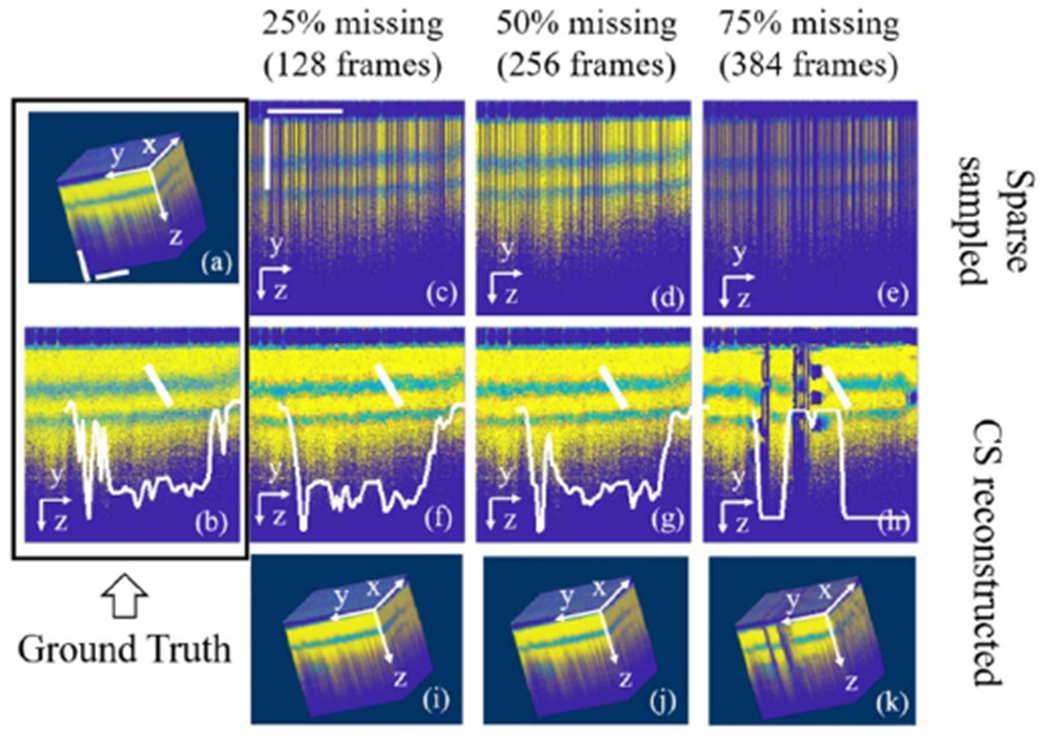
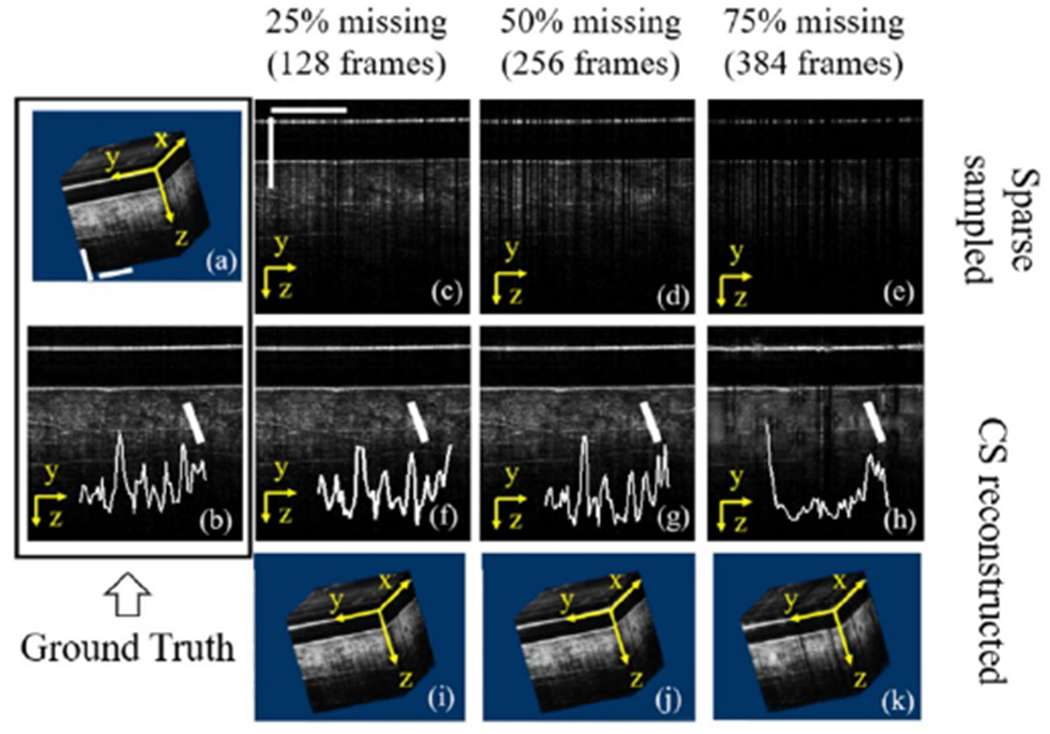
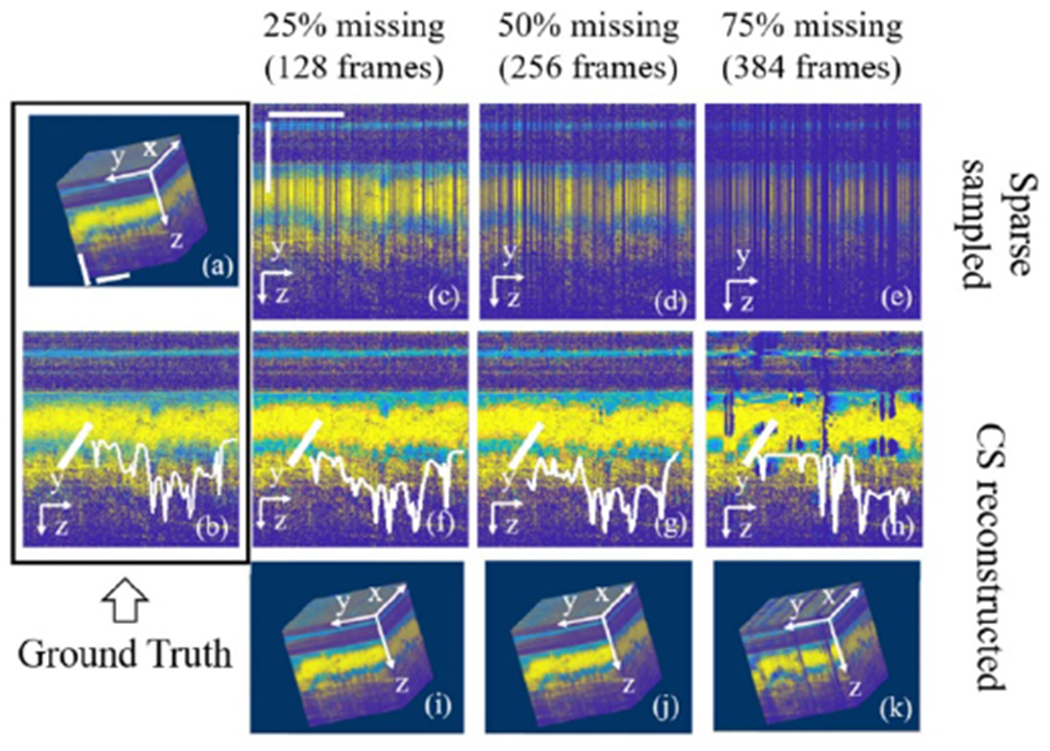
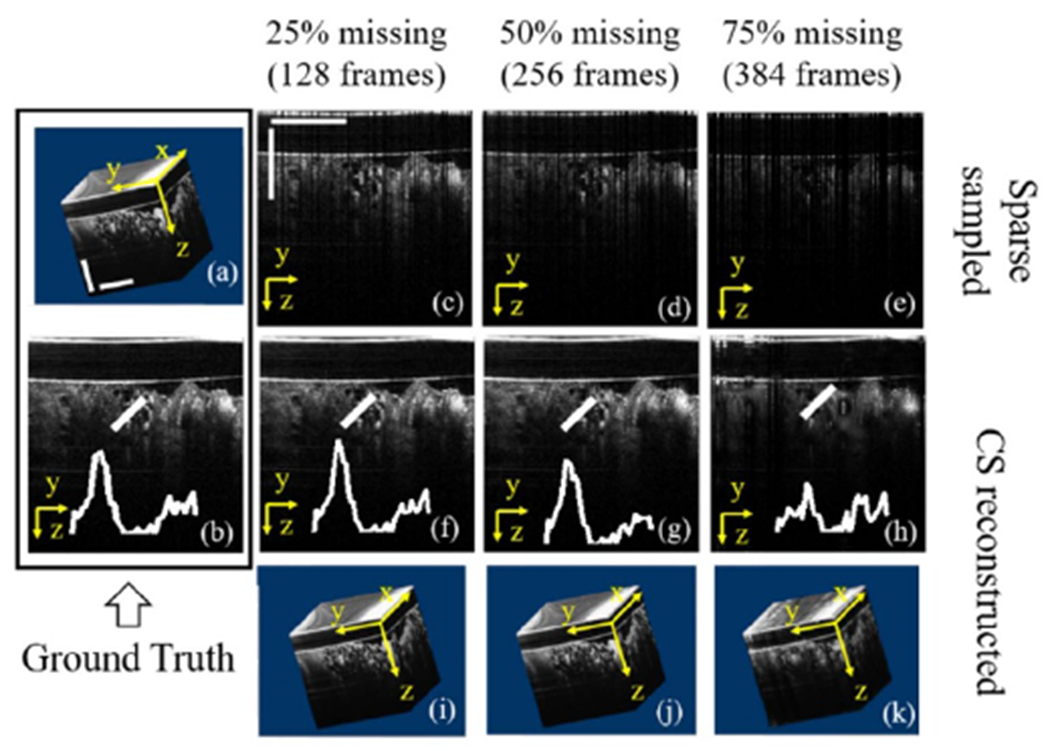
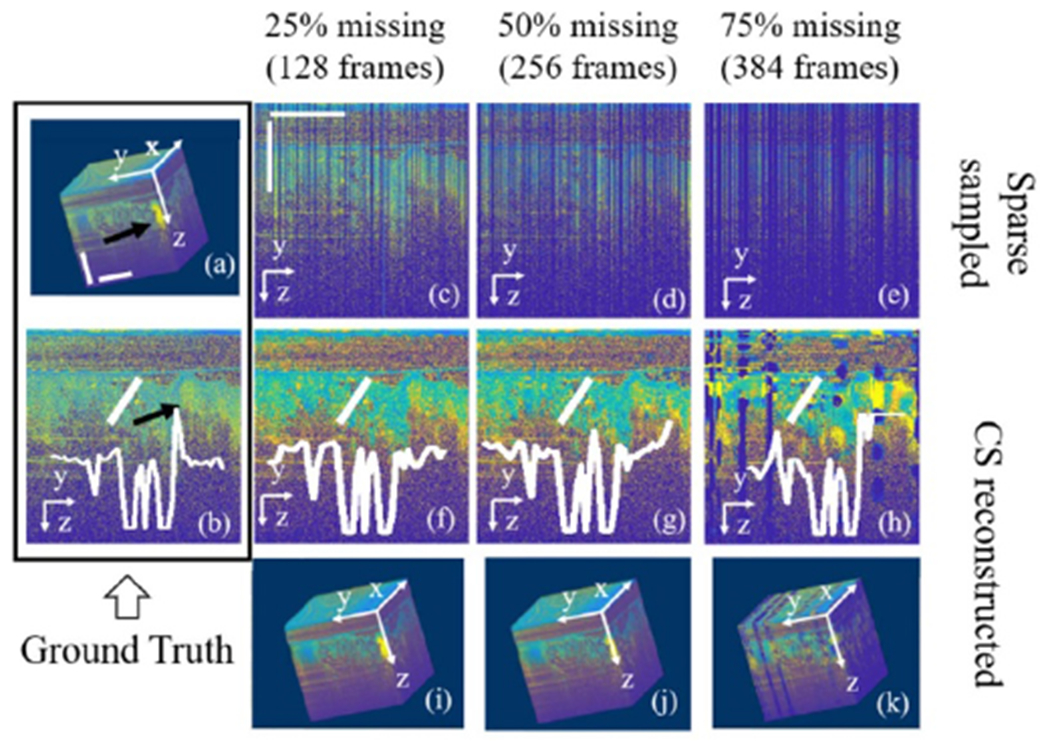
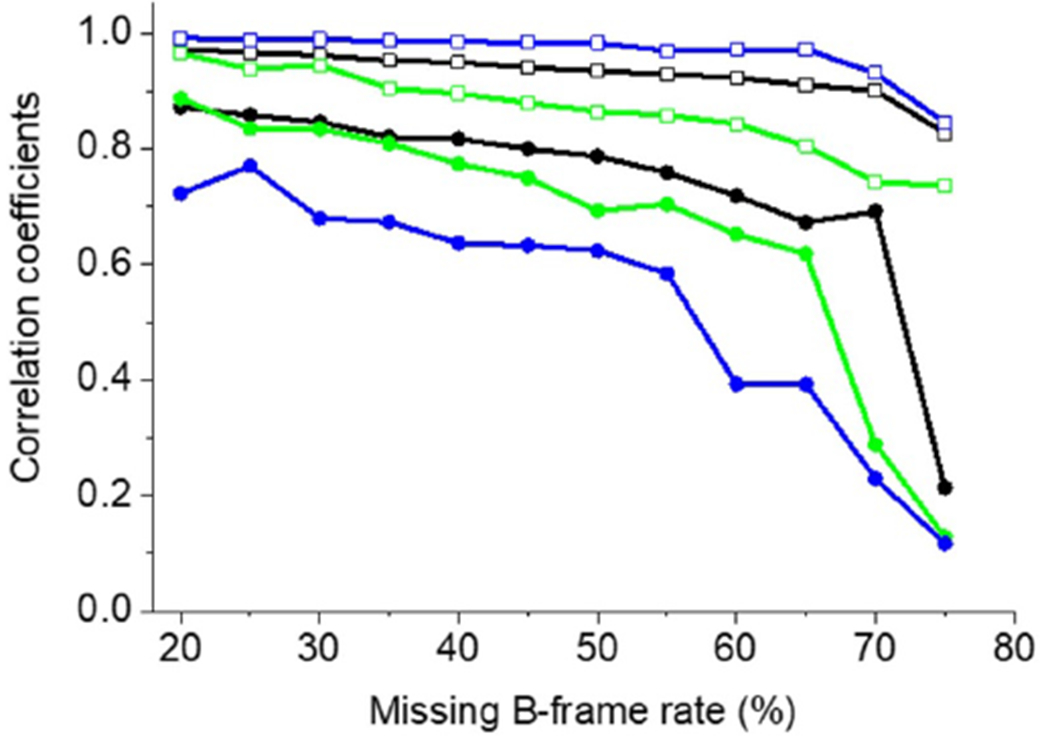
) and PS-OCT phase retardation (formula image) images, of molded plastics (green curves), ex vivo chicken breast (black curves), and ex vivo human breast tumor tissue (blue curves), versus missing B-scan rate.

Similar articles

Cited by

References

    1. Huang D et al. 1991. Science 254 1178–81 - PMC - PubMed
    1. Drexler W, Morgner U, Ghanta RK, Kärtner FX, Schuman JS and Fujimoto JG 2001. Nat. Med 7 502–7 - PMC - PubMed
    1. Wang J, Xu Y and Boppart SA 2017. J. Biomed. Opt 22 1217114 - PMC - PubMed
    1. Tsai TH, Leggett CL, Trindade AJ, Sethi A, Swager AF, Joshi V, Bergman JJ, Mashimo H, Nishioka NS and Namati E 2017. J. Biomed. Opt 22 1217165 - PubMed
    1. Welzel J 2001. Skin Res. Technol 7 1–96 - PubMed

LinkOut - more resources