. 2023 Dec 21;9(1):146-156.
doi: 10.1021/acsomega.3c00763. eCollection 2024 Jan 9.

Salicylic Acid Conjugate of Telmisartan Inhibits Chikungunya Virus Infection and Inflammation

Affiliations

Salicylic Acid Conjugate of Telmisartan Inhibits Chikungunya Virus Infection and Inflammation

Rudra Narayan Dash et al. ACS Omega. .

Abstract

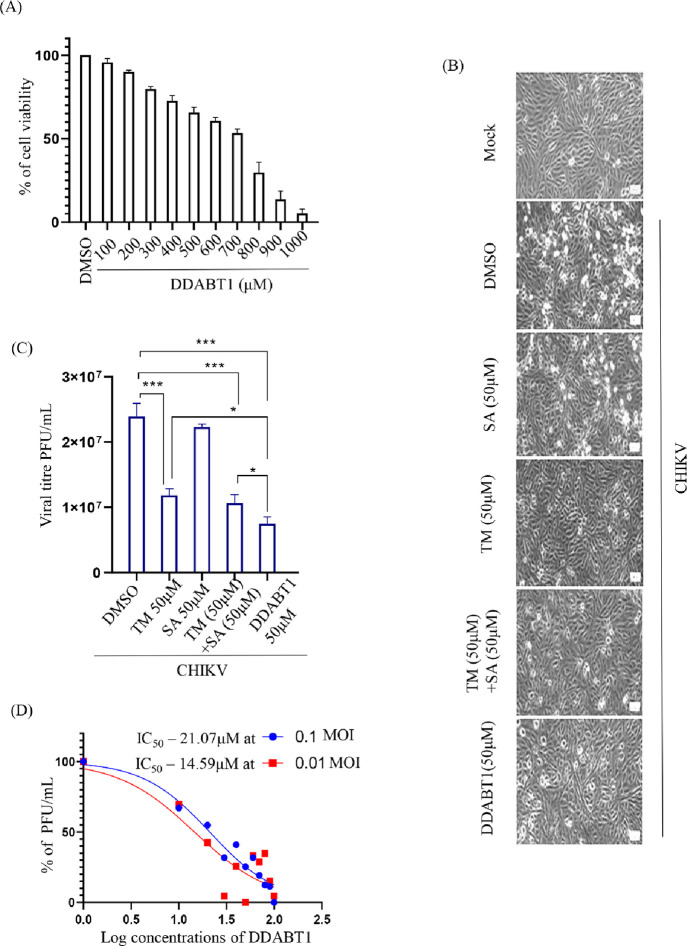
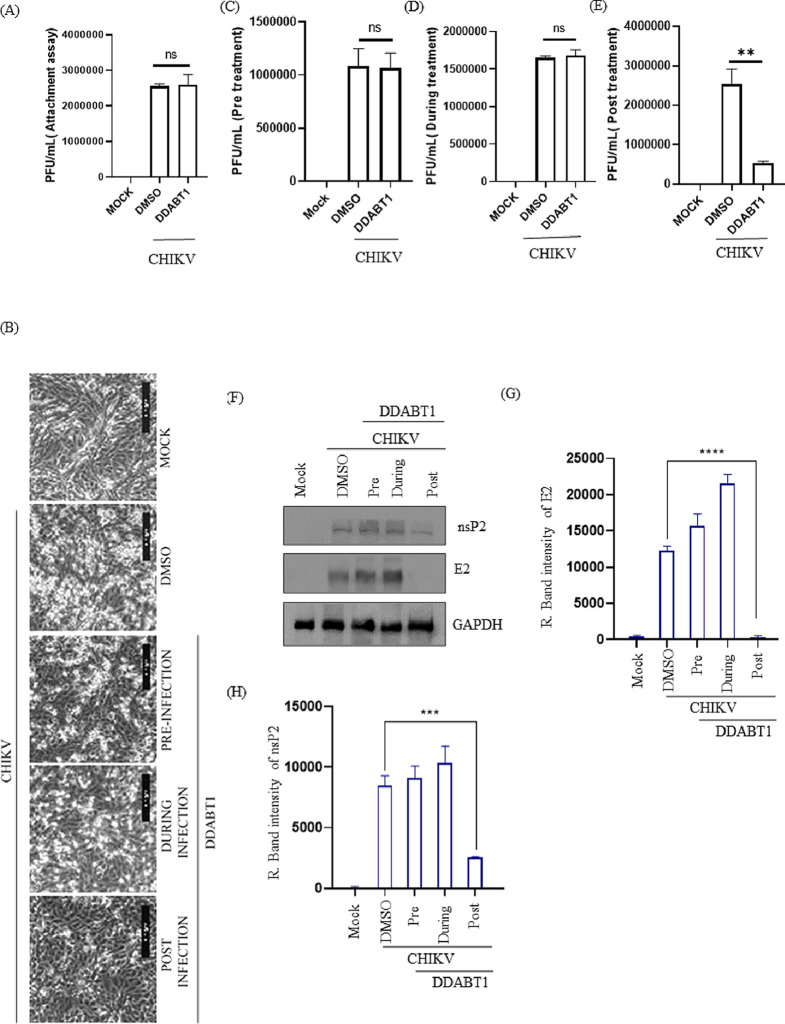
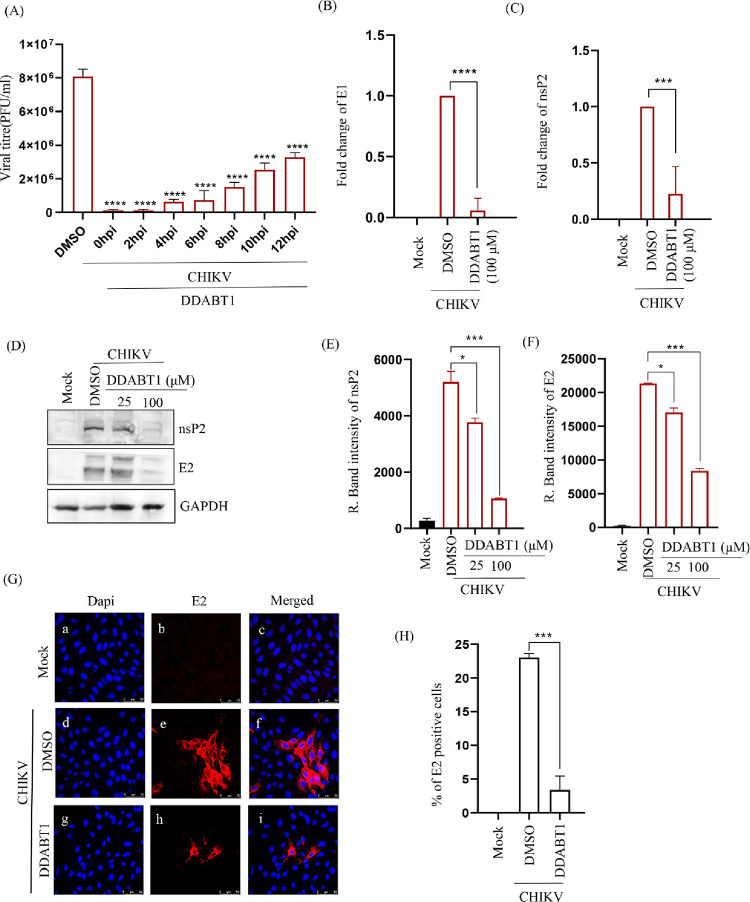
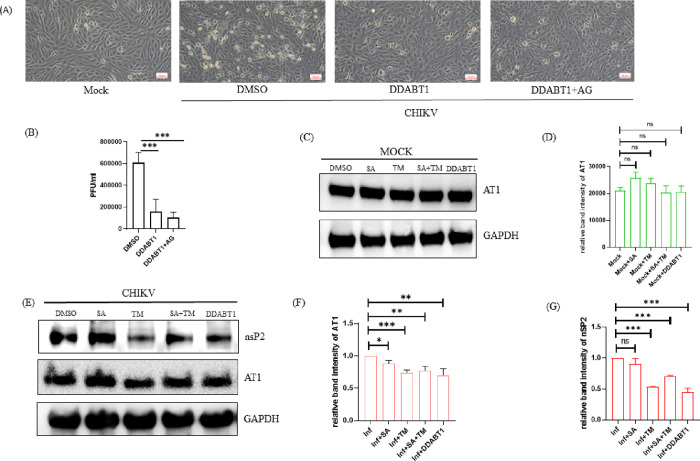
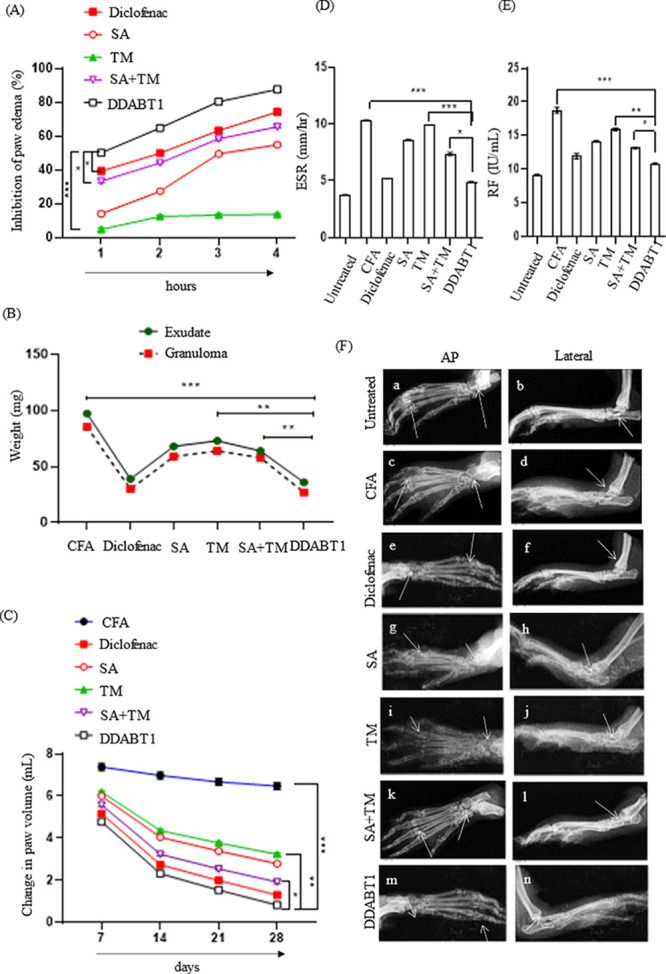
There is no approved antiviral for the management of the Chikungunya virus (CHIKV). To develop an antiviral drug that can manage both CHIKV and arthritis induced by it, an ester conjugate of telmisartan (TM) and salicylic acid (SA) was synthesized (DDABT1). It showed higher potency (IC50 of 14.53 μM) and a good selectivity index [(SI = CC50/IC50) > 33]. On post-treatment of DDABT1, CHIKV infection was inhibited significantly by reducing CPE, viral titer, viral RNA, and viral proteins. Further, the time of addition experiment revealed >95% inhibition up to 4hpi indicating its interference predominantly in the early stages of infection. However, the late stages were also affected. This conjugate of SA and TM was found to increase the antiviral efficacy, and this might be partly attributed to modulating angiotensin II (Ang II) receptor type 1 (AT1). However, DDABT1 might have other modes of action that need further investigation. In addition, the in vivo experiments showed an LD50 of 5000 mg/kg in rats and was found to be more effective than TM, SA, or their combination against acute, subacute, and chronic inflammation/arthritis in vivo. In conclusion, DDABT1 showed remarkable anti-CHIKV properties and the ability to reduce inflammation and arthritis, making it a very good potential drug candidate that needs further experimental validation.


Conflict of interest statement

The authors declare no competing financial interest.

Figures

Figure 1
Figure 1
DDABT1 inhibits CHIKV infection more efficiently than TM: (A) Vero cells were treated with different concentrations of DDABT1 (100–1000 μM) and an MTT assay was performed as mentioned above. Bar graph showing the percent cellular viability of Vero cells with increasing concentration of DDABT1. (B) Morphological changes in cells induced during infection at 18 hpi as observed under microscope at 10× magnification. (C) Vero cells were infected with the CHIKV-PS strain of CHIKV (MOI 0.1) 50 μM doses of the drugs [TM/SA/TM + SA/DDABT1], which were added separately to the infected samples. DMSO was used as vehicle control. The supernatants were harvested at 18hpi and plaque assay was carried out. Bar graph showing viral titers in drug-treated samples and control. (D) The Vero cells were infected with CHIKV-PS and different concentrations of DDABT1 were added. The supernatants were collected at 18 hpi and virus titers were determined by the plaque assay. The line diagram represents the IC50 value of DDABT1 in CHIKV-PS infected Vero cells, where the X-axis depicts the logarithmic value of the different concentrations of DDABT1 and the Y-axis depicts the percentage of PFU/mL. The statistical analysis of the experimental data was presented as mean ± SD of three independent experiments. *, P ≤ 0.05; **, P ≤ 0.01; ***, P ≤ 0.001; and ****, P ≤ 0.0001 were considered statistically significant.
Figure 2
Figure 2
Post-treatment of DDABT1 reduces CHIKV infection significantly. (A) Before infection, the virus was incubated with 100 μM DDABT1 for 1 h [CHIKV + DDABT1]. Vero cells were then infected with CHIKV or preincubated CHIKV with 100 μM DDABT1 as mentioned above and supernatants were harvested at 18 hpi for estimating viral titers through the plaque assay. The bar graph shows the estimated viral titers in PFU/mL. (B) The Vero cells were treated with the compound (100 μm) separately before infection (1 h), during infection (1.5 h), and after infection (18 h). Pictures were taken with 10× magnification in a bright field microscope to show CPE. (C–E) Supernatants present in all three conditions were collected at 18 hpi and were subjected to the plaque assay. The bar diagram shows the percentage of viral titers in different conditions. (F) Cells were harvested at18 hpi and Western blot was performed using E2 and nsP2 specific mAb. GAPDH was taken as the loading control. (G, H) Bar diagram showing the relative band intensities of CHIKV E2 and nsP2. The statistical analysis of the experimental data was presented as mean ± SD of three independent experiments. *, P ≤ 0.05; **, P ≤ 0.01; ***, P ≤ 0.001; and ****, P ≤ 0.0001 were considered statistically significant.
Figure 3
Figure 3
DDABT1 inhibits the CHIKV RNA and protein levels. (A) Vero cells were infected with CHIKV-PS (MOI 0.1) and DDABT1 (100 μM) was added at 0, 2, 4, 6, 8, 10, and 18 hpi. The CHIKV supernatants of all the experimental samples were harvested at 18 hpi and plaque assay was carried out. Bar graph depicting the viral titers in PFU/mL of all the drug-treated samples. DMSO was used as the vehicle control. The data represent the mean ± SD of three independent experiments. *p < 0.05 was considered to be statistically significant. Vero cells were infected with CHIKV-PS (MOI 0.1) and treated with DDABT1 (100 μM or 25 μM and 100 μM). (B, C) The cells were harvested at 18 hpi and total cellular RNA was isolated for amplifying the CHIKV E1 and nsP2 genes by qRT-PCR. (D) Cells were harvested and subsequently lysed in RIPA to perform Western blot using E2 and nsP2 specific mAbs where GAPDH was taken as the loading control. (E, F) Bar diagram demonstrating the relative band intensities of CHIKV E2 and nsP2, respectively. (G) The cells were fixed at 18 hpi and processed for the immunofluorescence assay to assess the protein levels of E2 using specific mAbs. (H) Graph depicting the % of E2 positive cells. The statistical analysis of the experimental data was presented as mean ± SD of three independent experiments. *, P ≤ 0.05; **, P ≤ 0.01; ***, P ≤ 0.001; and ****, P ≤ 0.0001 were considered statistically significant.
Figure 4
Figure 4
DDABT1 retains the ability of TM to inhibit AT1. Vero cells were infected with the CHIKV-PS strain of CHIKV (MOI 0.1) and then treated with DDABT1 (100 μM) along with AG (20 μM) after 90 min of infection. (A) Morphological changes in cells induced during infection at 18 hpi as observed under microscope at 10× magnification. (B) The bar graph shows the viral titer in PFU/ml. (C) Vero cells were treated with 50 μM doses of the compounds [SA/TM/SA+TM/DDABT1]. Cells were harvested at 18 hpi and Western blot was performed using AT1-specific mAb and GAPDH was taken as the loading control. (D) Bar graph showing the relative intensity of AT1 in different conditions of treatment. (E) Vero cells were infected with CHIKV-PS (MOI 0.1) for 90 min. The cells were then washed thrice with 1× PBS and 50 μM doses of the compounds [SA/TM/TM+SA/DDABT1] were added separately to the samples. Cells were harvested at 18 hpi, and Western blots were performed using AT1, nsP2 specific mAb, and GAPDH was taken as the loading control (F, G). Bar graph showing the relative intensity of AT1 and nsP2 in different conditions of infection and treatment. The statistical analysis of the experimental data was presented as mean ± SD of three independent experiments. *, P ≤ 0.05; **, P ≤ 0.01; ***, P ≤ 0.001; and ****, P ≤ 0.0001 were considered statistically significant.
Figure 5
Figure 5
DDABT1 reduces adjuvant-induced arthritis and inflammation in rats. (A) Line diagram representing the acute anti-inflammatory effect. The data in the Y-axis represent the percentage of inhibition in paw edema induced by carrageenan injection in rat paws (an increase in paw edema of the control group is considered as 100%). (B) Line diagram depicting the subacute anti-inflammatory effect. Data in the Y-axis represent the weight of exudate in a cotton-pellet implanted model in rats. (C) The line diagram represents the effect against chronic inflammation. Data in the Y-axis represent the change in paw volume of rats compared to control following induction of arthritis and treatment. (D, E) The bar diagram shows levels of ESR and RF in animals following chronic inflammation (on the 29th day of induction of inflammation by CFA injection). (F) Radiographic images of hind limbs of rats to assess soft tissue swelling and bony destruction. The statistical analysis of the experimental data was presented as mean ± SD of six independent experiments. *, P ≤ 0.05; **, P ≤ 0.01; ***, P ≤ 0.001; and ****, P ≤ 0.0001 were considered statistically significant

Similar articles

Cited by

References

    1. Weaver S. C.; Lecuit M. Chikungunya virus and the global spread of a mosquito-borne disease. N Engl J. Med. 2015, 372 (13), 1231–1239. 10.1056/NEJMra1406035. - DOI - PubMed
    2. Simon F.; Javelle E.; Cabie A.; Bouquillard E.; Troisgros O.; Gentile G.; Leparc-Goffart I.; Hoen B.; Gandjbakhch F.; Rene-Corail P.; et al. French guidelines for the management of chikungunya (acute and persistent presentations). November 2014. Med. Mal Infect 2015, 45 (7), 243–263. 10.1016/j.medmal.2015.05.007. - DOI - PubMed
    1. Cunha R. V. D.; Trinta K. S. Chikungunya virus: clinical aspects and treatment - A Review. Mem Inst Oswaldo Cruz 2017, 112 (8), 523–531. 10.1590/0074-02760170044. - DOI - PMC - PubMed
    1. Queyriaux B.; Simon F.; Grandadam M.; Michel R.; Tolou H.; Boutin J. P. Clinical burden of chikungunya virus infection. Lancet Infect Dis 2008, 8 (1), 2–3. 10.1016/S1473-3099(07)70294-3. - DOI - PubMed
    1. Morrison T. E. Reemergence of chikungunya virus. J. Virol 2014, 88 (20), 11644–11647. 10.1128/JVI.01432-14. - DOI - PMC - PubMed
    1. Kumar A.; Mishra P.; Chattopadhyay S.; Subudhi B. B. Current Strategies for Inhibition of Chikungunya Infection. Viruses 2018, 10 (5), 235.10.3390/v10050235. - DOI - PMC - PubMed
    2. Kovacikova K.; van Hemert M. J. Small-Molecule Inhibitors of Chikungunya Virus: Mechanisms of Action and Antiviral Drug Resistance. Antimicrob. Agents Chemother. 2020, 64 (12), e01788-2010.1128/AAC.01788-20. - DOI - PMC - PubMed

LinkOut - more resources